An Event-Driven Efficient Segmentation and
De-noising of Multi-Channel EEG Signals
S. M. Qaisar, R. Ramadan, A. Subasi
Electrical and Computer Engineering Department, Effat University, Jeddah, KSA [email protected], [email protected], [email protected],
Abstract– The segmentation and de-noising are basic operations, required in every signal processing and classification system. The classical segmentation and de-noising approaches are time-invariant. Consequently, it results in the post processing of an unnecessary information and causes an increase in the system processing activity and power consumption. In this context, an efficient event-driven segmentation and de-noising technique is proposed. It is founded on the principles of level crossing and activity selection. Therefore, it can adapt its sampling frequency, segmentation window length and position along with the filter order by analyzing the input signal local characteristics. As a result, the computational complexity and the power consumption of the proposed system is reduced compared to the counter ones. The suggested system performance is compared with the classical one. It is done for the case of a multi-channel Electroencephalogram (EEG) signals. Results show a noticeable compression gain with an effective adaptation of the de-noising filters order. It aptitudes a significant computational gain, transmission data rate reduction and power consumption reduction of the proposed technique, compared to the counter ones. It shows that the proposed solution is an attractive candidate to embed in the new generation EEG wearables.
Index Terms –Electroencephalogram, Event-Driven signal acquisition, Activity Selection, Data Compression, Adaptive Rate Filtering.
I. INTRODUCTION
The EEG signals contain significant information about the cerebral activities. It is extensively used for the cerebral control [1]. The application of EEG differs from rehabilitation equipment to BCI systems. In this context, a number of models are proposed in order to recognize the chance of differentiating among various brain tasks via the EEG signals [1]. The objective is to recognize dissimilar cerebral commands, by analysing EEG signals, for different motor imagery tasks [1].
The modern EEG wearables are multichannel devices and consist of several transducers, also called as electrodes, which will be in contact with the patient’s head in order to acquire the EEG signals [1, 2]. The brain signals sensed by each electrode are passed through antialiasing filters. The frequency of the band limited EEG signals range between [0.05; 60] Hz [3]. Depending on the frequency bands, the signal is categorized as: Delta [0.05; 4] Hz, Theta [4; 8] Hz, Alpha [8;
13] Hz, Beta [13; 30] Hz, and Gamma [30; 60] Hz [4]. After passing through the antialiasing filter the EEG signals are digitized with the help of Analog to Digital Converters (ADCs). The digitized EEG signals are segmented and de-noised by respectively employing the windowing and filtering operations. The de-noising process enhance the segmented portion signal to noise ratio (SNR). It improves the post analysis and classification modules precision [5, 6].
The classical windowing and filtering techniques are time-invariant. The windowing function shape and length remains unique. Moreover, the temporal distance between consecutive windows centers also remain constant. It represents that the windowing function position is fixed and predictable. Furthermore, each signal segment is de-noised by employing a fixed order filter, which operates at a fixed sampling rate [7, 8]. Due to this time-invariant nature, the classical segmentation and de-noising approaches are parameterized for the worst case of the intended application. Thus, they are highly constrained especially in the case of intermittent EEG signals. The system captures, segments, transmits and process a large number of useless samples. It increases the system processing and transmission activity, resources utilization and consequently the power consumption.
In this paper, this classical segmentation and de-noising approach inadequacy is resolved up to a certain extent by employing the event-driven signal acquisition and multirate processing techniques [9-11]. Following this approach, adaptive rate filtering techniques are suggested [11]. They are based on the level sampling scheme. This sampling process adapts its sampling rate according to the input signal local variations [11, 12]. Hence, it drastically reduces the post processing chain activity because it only samples the relevant information.
This paper follows the work presented in [11, 12, 23-27]. It presents an enhanced adaptive rate windowing and filtering technique, calibrated for the EEG signals effective and efficient segmentation and de-noising. The idea is to adapt the sampling frequency, the windowing function length and position along with the de-noising filter order as a function of the input signal temporal variations. In this context, an efficient solution is proposed by intelligently combining
features of event-driven signal acquisition and selection with an adaptive rate resampling and de-noising of the selected signal. It assures a noticeable data compression, processing and transmission gain of the proposed technique compared to the classical one.
The proposed system principle is described in Section II. Section II, also discusses the employed materials and methods, used to realize the devised system. A summary of the system performance verification results is discussed in Section III. Section IV, finally concludes the article.
II.THE PROPOSED SOLUTION PRINCIPLE
The suggested solution principle is shown on Figure 1. It shows that the intended EEG signals are acquired via an Event Driven A/D converter (EDADC) [13-15, 23-27]. These pulses are firstly passed through an antialiasing band-pass filter with [FCmin=0.05; FCmax=60]Hz. The band limited signal x(t) is
acquired with a uniform quantization based EDADC [13]. The EDADC output is time windowed with the Activity Selection Algorithm (ASA) [11-13]. The windowed signal is resampled uniformly and then de-noised with an appropriate adaptive rate filtering algorithm [11]. A detail of different system modules is provided in the following subsections.
Figure 1: The proposed system block diagram
A. The Event-Driven A/D Conversion (EDADC)
Figure 1, shows that in the studied case the x(t) is acquired with a 5-Bit resolution EDADC [13]. The EDADC is developed on the principle of Level Crossing Sampling (LCS) [13-15].The ADC is an essential component of any signal processing chain [7, 8]. It dictates the overall system performance [16]. The Nyquist sampling and processing theory governs the functionality of traditional ADCs. The signal acquisition is performed at a constant frequency irrespective of its sporadic nature, i.e. without exploiting the local signal variations [13-15]. Consequently, design parameters of the traditional ADCs are chosen for the worst case [16]. Therefore, in the case of low activity random signals like EEG. such ADCs are not effective. The employment of EDADCs can treat this inadequacy up to a certain degree.
The EDDCs are founded on the principle of opportunistic sampling and can adjust their sampling frequency according to the local variations of the intended signal. As a result, only the intended information is acquired. Therefore, a drastic reduction in the, post processing and analysis chain, activity and power consumption is achieved. In this case, the sampling frequency is not fixed, and it is piloted by the input signal. However, the signal reconstruction is confirmed by respecting
the Bernstein inequality [11]. It is realized by employing an appropriate design parameters of the employed EDADC [13].
B. The Windowing and Adaptive Rate Resampling
The EDADC output can be employed for further non-uniform digital processing. However, the practical system realization necessitates the finite time partitioning of the acquired data. Since a real system has limited resources like memory, processing speed, etc. [7, 8].In this context, the Activity Selection Algorithm (ASA) is used for an effective windowing of the EDADC output [11-13]. It exploits the sampling process non-uniformity to window only the relevant parts of signal. Furthermore, the characteristics of each selected signal part are analyzed in order to extract its local parameters. Later on, these extracted parameters are used to adjust the devised system parameters and processing activity accordingly [13, 14].
The output of ASA is resampled uniformly. The extracted window parameters are employed to decide the resampling frequency.The resampler acts as a bridge between the non-uniform and the non-uniform signal processing domains. It allows to realize smart solutions by taking advantage of both verges [11-13].
The interpolation is required during the resampling process. The artifacts are introduced, because of interpolation, in the resampled signal as compared to the original one. In the suggested system, the resampling error is a function of the interpolation technique employed to resample the data, the EDADC resolution, M and amplitude dynamics, ∆V [13, 17, 24, 25, 27]. The employed EDADC thresholds are distributed uniformly within the range, ∆V. Therefore, its quantum, q, can be calculated as q=∆V /(2M-1). For this case, the worst interpolation error is bounded by q [17, 24, 25, 27]. In the devised system the Simplified Linear Interpolator (SLI) is employed for the resampling purpose.
For the SLI the value of an interpolated sample xrn corresponding to a resampling instant trn is set equal to the average of its prior and next non-uniform samples. The process can be mathematically expressed as: xrn=(xn-1+ xn)/2. For SLI the worst error per resampled observation is bounded by q/2 [17].
The resampling frequency of each selected window is adapted by employing the selected window parameters extracted with the ASA. Let Frsi be the resampling frequency for the ith selected window Wi, then its choice depends on Fref,
Fsi and the sampling frequency of filter that is chosen for Wi. The process is further described in the following subsection. Here, Fref is the chosen reference sampling frequency in the system, such as it remains greater than and closest to
FNyq=2.fmax. Here, fmax is the x(t) bandwidth. Fsi=Ni/Li is the sampling frequency for Wi. Here, Li and Ni respectively present the length in time and the number of non-uniform samples exist in Wi. After resampling, there exist Nri uniformly placed samples for Wi.
For the studied case, fmax=60Hz. It is because of the employed FCmax=60Hz.Therefore, Fref=320Hz is chosen [18].
Antialiasing Filter [Fcmin; FCmax]
EDADC
Windowing & Adaptive Rate
Resampling EEG
Signal
y(t) x(t)
xn, tn
Adaptive Rate Filtering
C. The Adaptive Rate Filtering
The uniformly resampled data is de-noised by applying an adaptive rate filtering approach. The suggested filtering approach is an enhancement of work proposed in [11]. In this case, a bank of Finite Impulse Response (FIR) filters is offline designed for a range of sampling frequencies. Later on, during online processing an appropriate filter is chosen, from this bank, during online processing. For the studied case, the FIR filters cut-off frequencies are chosen as [FCDmin=0;
FCDmax=55]Hz. It effectively de-noises the intended signal [5, 6].
The filters bank is offline designed by employing the Parks-McClellan algorithm for a range of sampling frequencies, FR, between 110Hz to 320Hz and with a uniform frequency step of 15Hz [11]. A summary of the employed filters bank is shown on Table 1. Each filter is designed for the cut-off frequencies of [FCDmin=0; FCDmax=55]Hz.
TABLE 1: SUMMARY OF THE REFERENCE FILTERS BANK PARAMETERS
hck h1k h2k h3k h4k h5k h6k
FRc [Hz] 110 125 140 155 170 185
Pc 27 31 35 39 43 47
hck h7k h8k h9k h10k h11k h12k
FRc [Hz] 200 215 230 245 260 275
Pc 50 54 58 62 66 70
hck h13k h14k h15k
FRc [Hz] 290 305 320
Pc 73 77 81
The online filter selection and order adaption feature, for each selected window, allows to achieve the intended signal de-noising with a lesser computational complexity compared to the counter time invariant traditional solutions [11]. It adds to the proposed system computational and power efficiency.
The Fsi can be specific, therefore an appropriate reference filter is chosen, during online computation, for Wi. The choice of reference filter is made as a function of Fref and Fsi. If
Fsi≥Fref¸ then the reference filter, offline designed for Fref, is employed for Wi. Otherwise, if Fsi<Fref ≥2.FCDmax then the reference filter with FRc closest or equal to Fsi, is chosen for
Wi. The index notation, c, makes a distinction between the chosen reference frequency and FR. Afterwards, Frs
i
is chosen equal to FRc. If Fsi<110Hz, then Frsi=2.FCDmax is chosen. This lower bound on Frsi is employed to assure the proper filtering operation for the studied case [7, 8, 11].
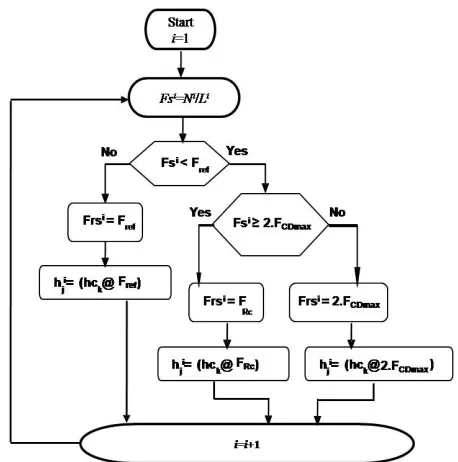
For proper filtering operation Frsi should match to FRc. The Algorithmic State Machine (ASM) chart of selecting Frsi and keeping it coherent with FRc is shown on Figure 2.
This adaptation of Frsi makes to resample Wi closer to the Nyquist rates or at sub-Nyquist rates [11-13]. Therefore, it avoids unnecessary interpolations and filtering operations during the data resampling and de-noising processes. As a result, it improves the proposed approach computational complexity and power efficiency.
Figure 2: The ASM chart for choosing Frsi and a filter from the reference filters bank for Wi.
III. COMPUTATIONAL COMPLEXITY
The computational complexity of a classical FIR filter is well known [7, 8]. A P order FIR filter performs P additions and P multiplications to deliver each filtered sample. If N is the number of samples then the total computational complexity C can be calculated by employing Equation 1.
{
{
tions Multiplica Additions
N
P
N
P
C
=
.
+
.
(1)In the proposed technique, certain extra operations are performed before data filtering [11, 12]. The first step is to uniformly resample the selected windows. It is achieved with an adaptive rate SLI module [23-27]. For each interpolation instant trn, the value of interpolated sample xrn is computed. This process required one addition and a one bit right shift operation. The complexity of this binary weighted division process is negligible as compared to addition and multiplication operations. Therefore, the SLI complexity for
Wi is equal to Nri additions.
The next step is to choose a reference filter hck for Wi. In the worst case, it requires Q comparisons. Here, Q is the total number of FIR filters available in the employed filters bank [11]. Finally, a Pi order filter performs Pi.Nri multiplications and Pi.Nri additions for Wi. The computational complexity of the proposed technique CARF is given by Equation 2. In Equation 2, i represents the selected windows index.
(
)
{s Comparison tions
Multiplica i i I
i Additions i i i
ARF Nr P Nr P Nr Q
C =
∑
+ × + × +=114 24 4 34 14243
(2)
IV. RESULTS AND DISCUSSION
In order to demonstrate the proposed system functionality, a case study is conducted. In this context, an EEG multi channel data set IV for the BCI Competition III is employed [19, 20]. It is a two class data. These classes respectively represent the intention of moving the left hand and the right foot. The data is recorded for five subjects. It is composed of 118 EEG channels. It is recorded by employing a 128 channel EEG cap [21]. The EEG electrodes layout is shown on Figure 3 [22]. The recording time for each channel is 49.74 minutes. Total 280 cues are recorded. Pauses between consecutive cues are kept random between [1.75; 2.25] Seconds, [19, 20].
Figure 3: A 128 channel EEG cap layout [22].
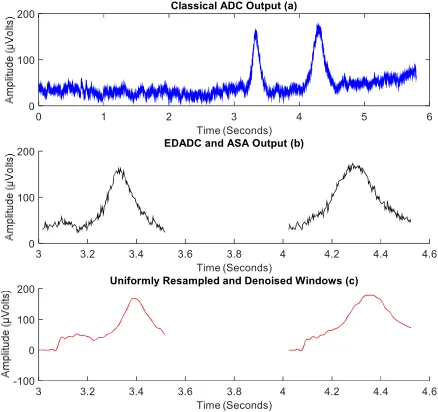
The analog signal y(t) is passed through an antialiasing filter of bandwidth [FCmin=0.05; FCmax=60]Hz. In classical case, the data is sampled by employing an ADC of 16 Bit resolution and at a sampling rate of 320 Samples Per Second (SPS). A portion of the digitized EEG signal acquired from channel 3 in the classical case is shown on Figure 4-a.
The signal acquired by using the EDADC and selected with the ASA is shown on Figure 4-b. The uniformly resampled and de-noised window is shown on Figure 4-c.
Figure 4: The signal obtained at the output of classical ADC (4-a), the signal obtained at the output of EDADC and ASA (4-b), the uniformly resampled and de-noised window (4-c).
Figure 4, shows that the EDADC and ASA allows to acquire and window only the relevant signal part. Moreover, during acquisition process the EDADC removes the low amplitude noise across the signal base line. This phenomenon is called the noise thresholding and it improves the post signal analysis and classification accuracy [4-6]. Furthermore, an additional signal enhancement is achieved with the de-noising process, realized with an adaptive rate filtering method [11].
In this case, the superior bound on the selected windows lengths is chosen as Lref =1seconds [13, 14]. Parameters of selected windows, obtained respectively for the considered signal segment, are summarized in Table 2.
TABLE 2: SUMMARY OF THE SELECTED WINDOWS PARAMETERS
Wi Li
[Sec.]
Ni
[Samples]
Fsi
[HZ)
Frsi
[HZ]
Nri
[Samples]
Pi
1st 0.49 153 312.2 305 149 77
2nd 0.47 107 246.8 245 115 62
Table 2 displays the appealing features of the devised solution. The sampling frequency is adjusted as a function of the x(t) local variations. It is achieved due to the smart features of the EDADC and the ASA. The process is clear from values of Fsi. The adjustment of the resampling frequency for each selected window improves to the computational gain of the proposed technique. It avoids the unnecessary interpolations during the resampling process as clear from values of Frsi. Pi
demonstrates that how the unnecessary operations are reduced during the online filtering process for Wi. Nri exhibits that how the adjustment of Frsi avoids the processing of unnecessary samples during the online filtering and spectral computation processes. Li shows the dynamic feature of the ASA which is to correlate the window function length with the x(t) local variations.
In the classical case, Fs is chosen equal to Fref. The x(t) is constantly sampled at 320Hz regardless of its local variations. It results in an acquisition of unnecessary samples. Besides, the windowing process is not able to select only the active parts of the sampled signal. Therefore, it causes the system to process unnecessary samples and as a consequence results in an increased computational activity than the devised solution. In the classical case, Lref=1 second remains static and is not able to adapt with the signal local variations.
For the considered signal segment of 5.79 seconds duration, in the classical case, six windows are obtained. The number of samples lay in first five windows are 320 and 254 samples lay in the sixth window. However, in the proposed case only two windows are intelligently selected by employing a smart combination of the EDADC and the ASA. It shows a 7 times reduction in the acquired number of samples, obtained by the suggested method as compared to the classical one.
A complexity computational complexity comparison is also made between the proposed technique and the classical one. In this context, it is assumed that the complexity of a comparison process is equal to that of an addition. Therefore, counts of comparisons are merged into the counts of additions for the proposed solution. It results into a simplification of Equation 2 as Equation 3. Consequently, equations 1 and 3 are employed Time (Seconds)
0 1 2 3 4 5 6
0 100
200 Classical ADC Output (a)
Time (Seconds)
3 3.2 3.4 3.6 3.8 4 4.2 4.4 4.6
0 100
200 EDADC and ASA Output (b)
Time (Seconds)
3 3.2 3.4 3.6 3.8 4 4.2 4.4 4.6
-100 0 100
to determine the complexities of the proposed and the classical approaches, for the considered signal segment. Results are summarized in Table 3.
(
4 44)
43 142434 4 2 1
tions Multiplica
i i I
i
Additions i i i
ARF Nr P Nr Q P Nr
C =
∑
+ × + + ×=1
(3)
Table 3 demonstrates the proposed technique computational efficiency compared to the classical approach. It is gained firstly by achieving the smart signal acquisition with smart windowing and secondly by adapting the sampling frequency and the filter order according to the local variations of x(t).
TABLE 3: SUMMARY OF THE COMPUTATIONAL GAIN
Gain in Additions
Gain in Multiplications
7.9 8.1
For an over all recording, 49.74 minutes for channel 3, in the classical case 2985 windows are obtained with a total count of acquired number of samples of 955k. In the suggested solution the number of selected windows obtained in the proposed solution are 1128. The number of samples obtained after resampling these windows are 119.4k. It shows an overall 7.9 times reduction in the acquired number of samples, obtained by the suggested method as compared to the counter classical approach. It shows that in this case the devised approach takes advantage of idle x(t) parts and therefore it will bring additional computational gain of the proposed approach over the classical solutions. It aptitudes a noticeable decrease in the, proposed technique based system, data transmission activity and power consumption over the counter ones.
V. CONCLUSION
A novel, event-driven EEG signal acquisition, segmentation and adaptive rate signal de-noising approach is devised. It is shown that how the employment of EDADC and ASA have avoided the unnecessary samples to process. It results respectively into a 7 and 7.9 times reduction in the acquired number of samples for the considered EEG segment and for the overall channel 3 recording of 49.74 minutes duration. Moreover, the selected windows lengths are adapted as a function of the x(t) local features. It is also shown that how the adaptation of resampling frequency and filter order, for each selected window, further enhances the suggested system efficiency. For the considered EEG segment of 5.79 seconds duration, a gain of 7.9 times and 8.1 times is respectively achieved, in terms of additions and multiplications, by the proposed method over the counter classical one. It aptitudes a further computational gain, transmission activity and power consumption reduction, for the overall EEG channel 3 recording of 49.74 minutes, of the proposed method over the counter classical one. It concludes that the devised solution is a potential candidate for the design and development of a new class of self-organized and efficient EEG wearables.
The devised system performance depends on the type of employed interpolator and de-noising stage. A study on the devised system performance while employing the high order interpolators like polynomial, spline, etc. is a future work. Moreover, the de-noised signal analysis, features extraction, features dimension reduction and classification is another rich axis to explore.
VI. FUNDING
This project is funded by the EFfat University with the decision number UC#7/28Feb 2018/10.2-44g.
VII. ACKNOWLEDGEMENT
Authors are thankful to anonymous reviewers for their valuable feedback.
REFERENCES
[1]. Sanei, Saeid, and Jonathon A. Chambers. EEG signal processing. John Wiley & Sons, 2013.4.
[2]. Leuthardt, Eric C., et al. "Brain-controlled body movement assistance devices and methods." U.S. Patent No. 9,539,118. 10 Jan. 2017.
[3]. Lei, Bangjun, Ferdinand van der Heijden, Guangzhu Xu, Ming Feng, Yaobin Zou, Dick de Ridder, and David MJ Tax. Classification, parameter estimation and state estimation: an engineering approach using MATLAB. John Wiley & Sons, 2017. [4]. Holmes, Geoffrey, Andrew Donkin, and Ian H. Witten. "Weka: A machine learning workbench." In Intelligent Information Systems, 1994. Proceedings of the 1994 Second Australian and New Zealand Conference on, pp. 357-361. IEEE, 1994.
[5]. Rangayyan, R. M. (2015). Biomedical signal analysis (Vol. 33). John Wiley & Sons.
[6]. R. J. Rak, M. Kołodziej, and A. Majkowski, “Brain-computer interface as measurement and control system the review paper,” Metrol. Meas. Syst., vol. 19, no. 3, pp. 427–444, 2012.
[7]. A.V. Openheim, A.S. Willsky and I.T. Young,“Signals and Systems”, Prentice-Hall, 1995.
[8]. E.C. Ifeachor and B.W. Jervis, “Digital Signal Processing: A Practical Approach”, Prentice-Hall, 2001.
[9]. Z. Duan, J. Zhang, C. Zhang and E. Mosca, “A Simple Design Method of Reduced-Order Filters and its Application to Multirate Filter Bank Design”, Elsevier Journal of Signal Processing, vol. 86, pp. 1061-1075, 2006.
[10]. M. Vetterli, “A theory of multirate filter banks”, IEEE transaction on Acoustic, Speeh and Signal Processing, vol. 35, pp.356-372, March 1987.
[11]. Qaisar, S. M., Fesquet, L., &Renaudin, M. (2014). Adaptive rate filtering a computationally efficient signal processing approach. Signal Processing, 94, 620-630.
[12]. QAISAR, S. M. (2009). Signal Driven Sampling and Processing: A Promising Approach for Computationally Efficient Adaptive Rate Solutions (Doctoral dissertation, Institut polytechnique de Grenoble).
[13]. Qaisar, S. M., Yahiaoui, R., &Gharbi, T. (2013, September). An efficient signal acquisition with an adaptive rate A/D conversion. In Circuits and Systems (ICCAS), 2013 IEEE International Conference on (pp. 124-129). IEEE.
[15]. Wang, T., Wang, D., Hurst, P. J., Levy, B. C., & Lewis, S. H. (2009). A level-crossing analog-to-digital converter with triangular dither. IEEE Transactions on Circuits and Systems I: Regular Papers, 56(9), 2089-2099.
[16]. Kester, W. A. (2005). Data conversion handbook. Newnes. [17]. Qaisar, S. M., Akbar, M., Beyrouthy, T., Al-Habib, W., & Asmatulah, M. (2016, June). An error measurement for resampled level crossing signal. In Event-based Control, Communication, and Signal Processing (EBCCSP), 2016 Second International Conference on (pp. 1-4). IEEE.
[18]. Tangermann, M., Müller, K. R., Aertsen, A., Birbaumer, N., Braun, C., Brunner, C., ...& Nolte, G. (2012). Review of the BCI competition IV. Frontiers in neuroscience, 6, 55.
[19]. Tangermann, M., Müller, K. R., Aertsen, A., Birbaumer, N., Braun, C., Brunner, C., ...& Nolte, G. (2012). Review of the BCI competition IV. Frontiers in neuroscience, 6, 55.
[20]. Wang, Y., Zhang, Z., Li, Y., Gao, X., Gao, S., & Yang, F. (2004). BCI competition 2003-data set IV: an algorithm based on CSSD and FDA for classifying single-trial EEG. IEEE Transactions on Biomedical Engineering, 51(6), 1081-1086.
[21]. Fiedler, P., Pedrosa, P., Griebel, S., Fonseca, C., Vaz, F., Supriyanto, E., ... & Haueisen, J. (2015). Novel multipin electrode cap system for dry electroencephalography. Brain topography, 28(5), 647-656.
[22]. Oostenveld, R., & Praamstra, P. (2001). The five percent electrode system for high-resolution EEG and ERP measurements. Clinical neurophysiology, 112(4), 713-719.
[23]. Qaisar, S. M. (2015, June). An event driven technique for filtering computational complexity reduction. In Event-based Control, Communication, and Signal Processing (EBCCSP), 2015 International Conference on (pp. 1-4). IEEE.
[24]. Qaisar, S.M., 2011. Electronic management system for rechargeable battery has measuring circuit measuring parameter determining variation of parameter transmitting data to electronic processing unit if variation is higher than predetermined threshold. [25]. Qaisar, S. M., Yahiaoui, R., & Dominique, D. (2015, December). A smart power management system monitoring and measurement approach based on a signal driven data acquisition. In Smart Grid (SASG), 2015 Saudi Arabia (pp. 1-4). IEEE.
[26]. Qaisar, S. M. Event Driven Filtering an Intelligent Technique for Activity and Power Consumption Reduction, International Journal of Circuits Systems and Signal Processing, Vol.8, 2014.