Lineage-Specific RNA Processing
Graphical Abstract
Highlights
d
Multivalent binding sites in young LINEs mainly recruit
repressive RBPs
d
PTBP1 and MATR3 co-bind and repress RNA processing
within and around young LINEs
d
1-kb exclusion zone of LINEs from vicinity of exons reflects
their repressive effects
d
Sequence-driven RBP remodeling on old LINEs drives
evolution of tissue-specific exons
Authors
Jan Attig, Federico Agostini,
Clare Gooding, ...,
Christopher W.J. Smith,
Nicholas M. Luscombe, Jernej Ule
Correspondence
[email protected] (J.A.),
[email protected] (J.U.)
In Brief
LINE elements recruit RNA-binding
proteins to mammalian introns,
influencing splicing and playing a key role
in the evolution of tissue-specific exons.
Attig et al., 2018, Cell174, 1–15
Heteromeric RNP Assembly at LINEs
Controls Lineage-Specific RNA Processing
Jan Attig,1,2,7,*Federico Agostini,1,7Clare Gooding,3Anob M. Chakrabarti,1,5Aarti Singh,2,4Nejc Haberman,1,2 Julian A. Zagalak,1,2Warren Emmett,1,2,5Christopher W.J. Smith,3Nicholas M. Luscombe,1,5,6and Jernej Ule1,2,8,*
1The Francis Crick Institute, Midland Road 1, Kings Cross, London NW1 1AT, UK
2Department of Molecular Neuroscience, UCL Institute of Neurology, Queen Square, London WC1N 3BG, UK
3Department of Biochemistry, University of Cambridge, Tennis Court Road, Cambridge CB2 1QW, UK
4Department of Comparative Biomedical Sciences, The Royal Veterinary College, Royal College Street, London NW1 0TU, UK
5Department of Genetics, Environment and Evolution, UCL Genetics Institute, Gower Street, London WC1E 6BT, UK
6Okinawa Institute of Science and Technology Graduate University, 1919-1 Tancha, Onna-son, Kunigami-gun, Okinawa 904-0495, Japan
7These authors contributed equally
8Lead Contact
*Correspondence:[email protected](J.A.),[email protected](J.U.) https://doi.org/10.1016/j.cell.2018.07.001
SUMMARY
Long mammalian introns make it challenging for the
RNA processing machinery to identify exons
accu-rately. We find that LINE-derived sequences (LINEs)
contribute to this selection by recruiting dozens of
RNA-binding proteins (RBPs) to introns. This
in-cludes MATR3, which promotes binding of PTBP1
to multivalent binding sites within LINEs. Both
RBPs repress splicing and 3
0end processing within
and around LINEs. Notably, repressive RBPs
prefer-entially bind to evolutionarily young LINEs, which are
located far from exons. These RBPs insulate the
LINEs and the surrounding intronic regions from
RNA processing. Upon evolutionary divergence,
changes in RNA motifs within LINEs lead to gradual
loss of their insulation. Hence, older LINEs are
located closer to exons, are a common source of
tis-sue-specific exons, and increasingly bind to RBPs
that enhance RNA processing. Thus, LINEs are
hubs for the assembly of repressive RBPs and also
contribute to the evolution of new, lineage-specific
transcripts in mammals.
INTRODUCTION
Human introns are replete with sequences that resemble splice sites and poly(A) sites, creating a demand for mecha-nisms to help the RNA processing machinery distinguish true from so-called cryptic RNA processing sites. Inappro-priate recognition of such sites initiates inclusion of cryptic exons, which can disrupt gene expression by changing the reading frame, introducing premature stop codons, and decreasing transcript stability. Several RNA-binding proteins (RBPs) are known to contribute to splicing fidelity by repres-sing cryptic splice sites (Sibley et al., 2016), but identification of RBPs that repress cryptic RNA processing sites remains anecdotal.
The human genome contains more than 1.4 million fragments of LINE repeats, many of which are located in introns (Smit, 1999). The two most common LINE repeat families in mammals are L1 and L2. Active L1 contains its own promoter in the 50UTR and encodes for two open reading frames, ORF1p and ORF2p (Feng et al., 1996; Burns and Boeke, 2012), as a bicistronic mRNA. Active L1s are6 kb long (such as L1HS) (Smit et al., 1995) although individual families differ largely in their 50and 30 UTRs and can be substantially longer, such as the L1MA2 family with a size of7.6 kb. In the human genome, only250 L1 inser-tions encode a functional ORF2p (Penzkofer et al., 2017) and only 60–80 account for allde novoLINE insertions observed in human populations orin vitro(Beck et al., 2010; Brouha et al., 2003). The remaining L1 and all L2 elements are mostly degener-ated and truncdegener-ated compared to the families’ consensus sequences, and mutations have disrupted their ability to retro-transpose. In spite of their prevalence, the effects of intragenic LINEs on splicing have been studied mainly in individuals with hereditary diseases, where an intronic LINE insertion disrupts expression of an individual gene, such as CYBB (Meischl et al., 2000), DMD (Yoshida et al., 1998), and XRP2 (Schwahn et al., 1998). Several RBPs, such as UPF1, ELAVL1, and ZCCHC3, are known to bind active LINEs and thereby interfere with their retrotransposition (Goodier et al., 2013; Taylor et al., 2013). How-ever, the regulatory potential of intronic LINEs, and the RBPs binding them, are poorly characterized.
Here, we surveyed iCLIP and eCLIP data to identify 28 RBPs with enriched binding to LINEs, including MATR3 and PTBP1. MATR3 promotes binding of PTBP1 to LINEs at ‘‘multivalent binding sites,’’ composed of multiple short binding motifs that are clustered together. The two RBPs jointly block the recogni-tion of cryptic poly(A)-sites and splice sites within LINEs. We demonstrate that evolutionarily recent L1 elements recruit repressive RBPs to introns, while many evolutionarily older LINEs have partially escaped from this repression and contribute to the emergence of exons specific to the mammalian lineage. Thus, we link the functional relevance of LINEs to dozens of inter-acting RBPs and demonstrate the importance of combinatorial binding of RBPs to repetitive elements, exemplified by MATR3 and PTBP1.
C D B
RESULTS
LINE-Derived Sequences Recruit Dozens of RBPs to Deep Intronic Regions
According to RepeatMasker annotation, the human genome contains 1.4 million fragments of LINE repeats, 650,000 located in introns (Figure 1A) (Smit, 1999). These intronic LINEs often contain splice site sequences, but rarely give rise to exons according to public exon annotation. We therefore wished to study if repressive RBPs prevent the use of cryptic processing sites at LINEs. The abundance of LINE-derived sequences in pre-mRNA is reflected in bulk sequencing of nuclear, but not cytoplasmic RNA, in HeLa, K562, and HepG2 cell lines ( Fig-ure 1B). To identify RBPs that bind to L1-derived sequences, we examined iCLIP data for 17 RBPs and eCLIP data from K562 and HepG2 cells for 112 RBPs available from ENCODE (Table S1) (Sloan et al., 2016; Van Nostrand et al., 2017). We ranked these RBPs by the proportion of crosslink events mapping to sense or antisense L1 elements (Figure 1B).
CELF2, MATR3, and PTBP1 ranked highest in our iCLIP data and SUGP2, HNRNPM, and KHSRP in the eCLIP data ( Fig-ure 1C;Table S2). For PTBP1, enrichment on antisense L1s is confirmed by the eCLIP data (that is not available for CELF2 and MATR3) and by a previous study that compared PTBP1 iCLIP reads in LINEs to a genomic null model (Kelley et al., 2014). Dozens of additional RBPs had enriched binding on L1 elements in i/eCLIP data, with antisense orientation being most commonly bound. We also examined RBP binding to L2 elements, which are approximately three times less common in the human genome than L1s. Over a dozen RBPs were en-riched on L2s in a strand-specific manner, with SUGP2, MATR3, PTBP1, and HNRNPK showing strongest enrichment in sense L2s, and HNRNPA1, TAF15, HNRNPU, and SAFB2 in antisense L2s (Table S2). Genomic mapping of sequencing reads partially discards highly repetitive sequences, so we also examined eCLIP RBP binding to sub-families of LINEs by using the TEtranscripts method (Jin et al., 2015), which recapit-ulated our ranking (Figure S1). Thus, in spite of the repetitive na-ture of LINE sequences, most are divergent enough to enable unique genomic mapping of CLIP reads. In total, 25 RBPs had more than 2-fold enrichment on L1 or L2 elements accord-ing to TEtranscripts, which together with MATR3, CELF2, and
ELAVL1 that are more than 2-fold enriched by iCLIP, identifies 28 LINE-binding RBPs.
Finally, we assessed the distribution of intronic binding sites of LINE-binding RBPs relative to exons (Figure 1D). Interestingly, we find that positional preferences of most RBPs are either skewed toward the first 500 nt next to exons, or ‘‘deep intronic’’ regions, those more than 500 bp away from any annotated exon. We ranked the RBPs according to the binding pattern, which shows that LINE-binding RBPs often preferentially bind to deep intronic regions. This is most apparent for MATR3 and PTBP1, which ranked highest as deep intronic binders.
MATR3 Stabilizes Multivalent PTBP1-RNA Binding, Especially on L1s
MATR3 directly interacts with PTBP1 (Coelho et al., 2015), but it is not known if this affects their RNA binding specificity. Unsupervised clustering of LINEs bound by MATR3, PTBP1, TARDBP, ELAVL1, and CELF2 showed the strongest correlation between MATR3 and PTBP1 (Pearson coefficient = 0.83, Fig-ure S2A). Moreover, MATR3 binding was enriched in the prox-imity of PTBP1 binding peaks, with a further increase within LINEs (p value < 2.2e16,Figure S2B). Therefore, we examined if MATR3 and PTBP1 are dependent on each other for binding to LINEs by performing iCLIP with PTBP1 in HEK293 cells depleted of MATR3, and iCLIP with MATR3 in HEK293 cells depleted of PTBP1 and PTBP2 (PTBP1/2), as well as cells transfected with control small interfering RNA (siRNA) (Figures 2A, S2C, and S2D). Notably, we immunoprecipitated a decreased amount of RNA crosslinked to PTBP1 upon MATR3 depletion, as measured by32P labeling, which was not fully explained by a change in the abundance of PTBP1 protein (Figure 2A; replicates in Fig-ure S2C). Conversely, the amount of RNA crosslinked to MATR3 did not change upon depletion of PTBP1/2 (Figure S2D). Next, we classified the peaks of PTBP1 crosslinking into MATR3-dependent, MATR3-independent, and remaining peaks (Figure 2C). As expected, all crosslinking peaks were highly en-riched for CT-rich motifs, most prominently at the peak center (Figure 2E). Importantly, MATR3-dependent PTBP1 peaks better overlapped with MATR3 crosslinking than MATR3-independent peaks (Figure 2D) and had a higher overall density of CT-rich motifs over a 200-nt region around the peak (Figure 2E). We also examined the overlap of PTBP1 peaks with genomic
Figure 1. LINEs Are Binding Platforms for Diverse RBPs
(A) Number of LINE fragments within introns of human genes based on UCSC annotation (hg19 assembly), the number of LINEs with a 30or 50splice sites and the
number of LINEs forming an exon. The total number of exonized elements is given, which includes elements contributing a poly(A) termination site to a terminal
exon in addition to those contributing a 30or 50splice site.
(B) Estimate of abundance of L1-sequences in subcellular RNA fractions from HeLa, K562, and HepG2 cells. Strand-specific RNA-seq was used to quantify
abundance of L1 in sense and antisense (orange and blue), relative to the number of mapped reads. Data is split for libraries made from polyA, polyA+, or rRNA
RNA. Data for K562 and HepG2 is from the ENCODE consortium. Data for HeLa is from triplicates and is shown as mean±SD. cyt, cytoplasmic RNA; nuc, nuclear
RNA; chrom, chromatin-associated RNA.
(C) Frequency of L1 repeat sequences among the bound RNA sequences of a panel of RBPs. Because e/iCLIP is strand-specific, binding to LINEs transcribed in sense or in antisense was quantified separately (orange and blue). Orange and blue lines indicate median binding across all RBPs. The inlet indicates the section
of the full dataset shown, the full dataset including sources is available inTable S2. For visualization, replicates were averaged and only data from one cell line
is shown.
(D) Binding to introns of at least 7 kb size was analyzed in 100-nt bins up to 5 kb upstream and downstream of the exon and quantified in percent relative to the total number of mapped reads. Data is shown for the first 100-nt bin and as an average of the 100-nt windows within 101–500 nt, 501–2,000 nt, and 2,001–5,000 nt distance. A rank for deep intronic binding is given based on the average of the first 100 nt of either splice site and average binding in the 2,001- to 5,000-nt window.
A
E
F
C
G B
D
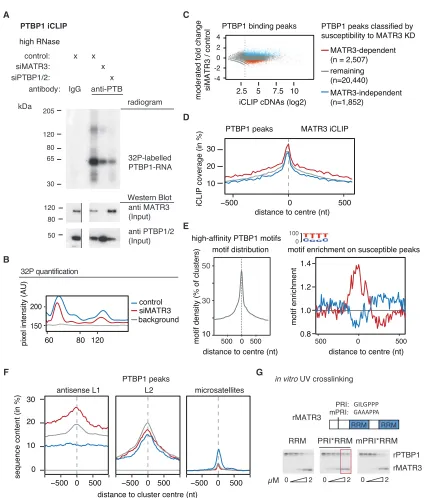
Figure 2. Binding of PTBP1 to Antisense L1 Elements Is MATR3-Dependent
PTBP1 iCLIP was performed from HEK293T cells depleted of MATR3 as well as controls. MATR3-dependent PTBP1 binding clusters are shown in red and MATR3-independent PTBP1 binding clusters in blue (C–F).
(A) RNA crosslinked to and co-precipitated with PTBP1 under high RNase conditions was labeled with32
P-ATP; the size of the PTBP1-RNA is marked next to the radiogram gel image. The input lysate for the iCLIP experiment was probed for MATR3 and PTBP1 antibodies in a western blot. The gel image was cut to align it
with the radiogram. Replicates are shown inFigure S2A, andFigure S3C shows another western blot assessing MATR3 and PTBP1 protein levels in the relevant
conditions.
(B) To quantify the signal, gray pixel intensity measured across the center of each lane is shown, analyzed with ImageJ software.
(C) PTBP1 binding peaks were identified from all iCLIP experiments and classified according to their susceptibility to MATR3 depletion. Binding peaks with a normalized count of <8 were ignored, indicated by the dotted line.
(D) Coverage of MATR3 iCLIP around MATR3-dependent PTBP1 binding peaks.
(E) Enrichment for high-affinity PTBP1 binding motifs around PTBP1 binding peaks. Left: all PTBP1 binding peaks show strong enrichment for PTBP binding motifs. Right: MATR3-dependent PTBP1 binding peaks show enrichment in a 200-nt region for high-affinity motifs above other PTBP1 binding peaks.
repeats. MATR3-dependent PTBP1 peaks were more strongly enriched in antisense L1 elements compared to the remaining peaks (Figure 2F). Conversely, PTBP1 is not required for MATR3 binding to LINEs (Figures S2D–S2F). PTBP1 also binds CT- and T-rich microsatellite repeats (Ling et al., 2016), but this accounts for only 0.2% of all PTBP1 peaks in unperturbed HEK293 cells, and they are only found within MATR3-indepen-dent peaks. This suggests that MATR3 supports the binding of PTBP1 to the most multivalent binding sites (i.e., sites that contain multiple CT-rich motifs that are highly clustered over a region that can span up to 200 nt around the binding peak). Such sites are particularly frequent within antisense L1 elements. To further examine how MATR3 affects binding of PTBP1 to RNA, we usedin vitrobinding assays. We previously found a PTBP1 RRM2 interacting (PRI) motif within the disordered region of MATR3, which is essential for interaction with PTBP1 RRM2 (Coelho et al., 2015). We purified recombinant MATR3 fragments (rMATR3) comprising its two RRMs, with (‘‘PRI-RRMs’’) or without the PRI motif (‘‘RRMs’’), or with mutations within the PRI that abolishes PTBP1 binding (‘‘mPRI-RRMs’’). We designed anin vitrosynthesized RNA with two MATR3 RNAcompete mo-tifs (ATCTT) (Ray et al., 2013) as well as small CT-stretches, which allowed binding of either MATR3 or PTBP1 (Figure 2G). Notably, the non-interacting rMATR3 (RRMs or mPRI-RRMs) competed with PTBP1 for RNA binding at equimolar concentra-tions (Figure 2G), but the interacting PRI-RRM rMATR3 enabled PTBP1 crosslinking even when rMATR3 was present at excess molarity. We also added rMATR3 to HeLa nuclear extracts with endogenous PTBP1 and assayed binding to an RNA probe containing two ATCTT motifs (as before), or a probe with a multivalent binding site containing six CTCTT motifs (the RNAcompete motif for PTBP1) (Figure S2G). Again, addition of an excess of the non-interacting rMATR3 (RRMs or mPRI-RRMs) prevented PTBP1 crosslinking to both RNAs, while addi-tion of the interacting PRI-RRM rMATR3 increased crosslinking to ATCTT2, and preserved crosslinking to CTCTT6 RNA. It is likely that the PRI-motif allows the formation of a MATR3/ PTBP1/RNA complex, and this promotes thein vitrobinding of PTBP1 to multivalent binding sites.
MATR3 and PTBP1 Co-repress LINE-Derived Exons and Poly(A) Sites
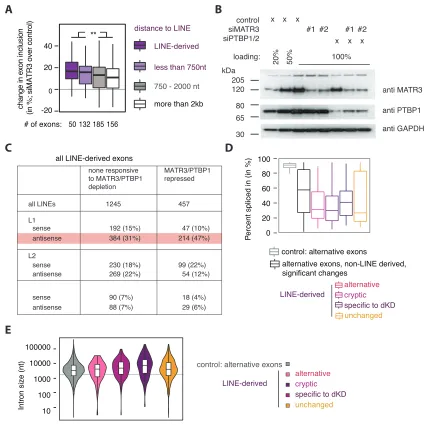
Given the coordinated binding of MATR3 and PTBP1 to LINEs, we wished to understand the functional importance of this bind-ing. First, we re-analyzed our previous splice junction microarray data (Coelho et al., 2015) and found2-fold enrichment of anti-sense L1 sequence overlapping exons repressed by MATR3 or PTBP1 and enrichment extended for up to 2 kb around the exons (Figure 3A). We also observed that the distance of MATR3-repressed exons from antisense L1s anti-correlates with the strength of repression (Figure S3A). Next, we performed RNA sequencing (RNA-seq) from HeLa cells depleted of MATR3
and PTBP1/2, individually or in combination and usedde novo transcriptome assembly to identify cryptic exonization events. We detected 1,702 LINE-derived exons in total; 1,180 of which are not identical with UCSC exon annotation and can therefore be considered as cryptic exons (Table S3). Depletion of both MATR3 and PTBP1/2 led to the differential use of 457 (27%) of all detected LINE-derived exons, the great majority of which are de-repressed (Figure 3B). Repression of LINE-derived exons by MATR3 and PTBP1 was additive, as evident by the strongly increased inclusion upon their co-depletion. We found an enrich-ment for antisense L1 eleenrich-ments among MATR3/PTBP1/2 repressed LINE-derived exons (Figure S3C), and they were pref-erentially located within long introns (Figure S3E). Thus, MATR3 and PTBP1 are primarily repressing exons emerging from deep intronic L1 elements. Metaprofiles of iCLIP data showed increased binding of MATR3 and PTBP1 around the significantly repressed LINE-derived exons, confirming their direct regulation (Figure 3C).
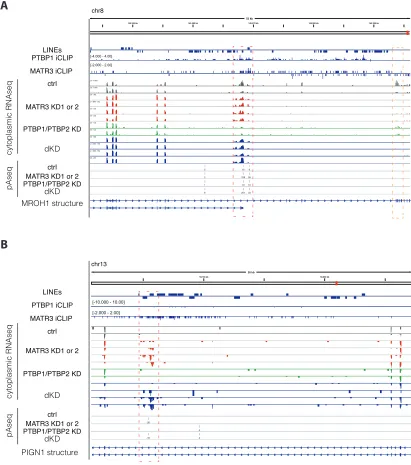
We also produced 30end sequencing data to investigate the regulation of poly(A) sites, because antisense L1 elements are rich in cryptic poly(A)-signals (Han et al., 2004; Lee et al., 2008). We used the expressRNA platform (Rot et al., 2017) to find 5,189 genes with two poly(A) sites, each containing at least 5% of the sequencing reads within the gene (referred to as pA1 and pA2). Of these, 240 poly(A) sites originated from a LINE (Table S4). LINEs were enriched at proximal poly(A) sites repressed by MATR3/PTBP1 and up to2 kb away from the sites (Figure 3A). The changes in poly(A) site use suggest a pri-marily repressive function of MATR3/PTBP1 binding (Figure 3D). In the most extreme cases, recognition of poly(A) sites within LINEs results in complete loss of all downstream exons upon combined depletion of MATR3 and PTBP1 (i.e., inMROH1and PIGN1) (Figures S4A and S4B). Metaprofiles of iCLIP data confirmed the direct binding of MATR3 and PTBP1 to repressed poly(A) sites (Figure 3E). Thus, we conclude that MATR3 and PTBP1 are potent repressors of RNA processing at LINEs, pre-venting the use both of poly(A) sites and splice sites.
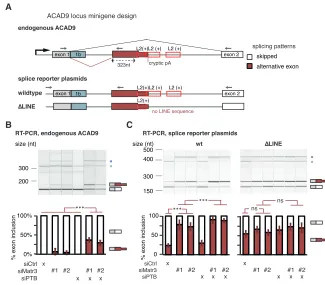
Deletion of an Intronic LINE Disrupts MATR3-Dependent Repression of a Cryptic Exon inACAD9
We chose to examine in detail repression of a cryptic exon in intron1 of ACAD9 by MATR3 and PTBP1. Intron1 of ACAD9 contains three fragments of L2 elements in sense orientation ( Fig-ure 4A) with multivalent PTBP1 binding sites, which are strongly bound by MATR3 and PTBP1 in cultured human cells as well as in mouse brain (Figures S5A and S5D). We confirmed by RT-PCR and Sanger sequencing that depletion of MATR3 led to the inclusion of an alternative exon with a 30 splice site that is located 323 nt upstream of the nearest L2 repeat. Even though depletion of PTBP1/2 on its own did not affect the exon, its inclu-sion was more pronounced after co-depletion of MATR3 and PTBP1/2 compared to depletion of MATR3 alone (Figure 4B).
(F) The overlap between the center of PTBP1 binding peaks and different repeat classes was tested for antisense L1 elements, sense L2 elements, and sense CT-/T-rich microsatellite repeats. Metaprofiles show the percentage of each class of clusters overlapping with each genomic element.
(G) Protein-protein interactions between MATR3 and PTBP1 allow the formation of a heteromeric complex on a substrate RNA with two ATGTT motifsin vitro.
A
E D
C B
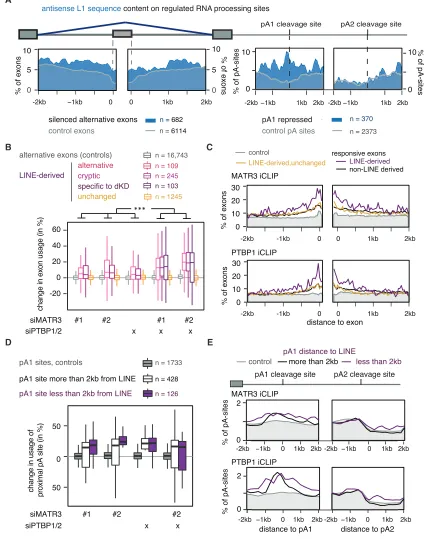
Figure 3. MATR3 and PTBP1 Repress Splice and Poly(A) Sites in LINEs
(A) The metadata profile shows the coverage of antisense L1 sequences in a±2 kb window flanking the splice sites and the proximal and distal poly(A) sites of
MATR3/PTBP1/2 repressed events or control. Metadata profile was smoothed using 40-nt bins.
(B) LINE-derived exons were identifiedde novofrom RNA-seq data of HeLa cells depleted of MATR3 and PTBP1. Differences in exon inclusion across groups
were tested by Kruskal-Wallis rank-sum test (p value < 2.2e16
) and pairwise comparisons by Dunn’s test corrected according to Holm-Sida´k. ***Adjusted
p value < 0.001 in all indicated comparisons. LINE-derived exons specific to the MATR3/PTBP1 depleted condition were of too low read count for quantification in the other conditions.
30 end sequencing data showed the emergence of a cryptic poly(A)-site within the L2 sequences that is only used in MATR3 and PTBP1/2 depleted cells, suggesting the exon is an alternative terminal exon. Moreover, expression ofACAD9gene was 2-fold decreased upon depletion of MATR3 and 3-fold decreased upon combined depletion of MATR3 and PTBP1/2 (Figures S5B and S5C). To confirm that MATR3 and PTPB1 repress the exon by binding to the downstream L2 elements, we designed aACAD9 splicing reporter plasmid comprising exon1, the complete in-tronic sequence including all three L2 repeats (wild-type) and exon2, and a mutant reporter that lacked two L2 repeats and the multivalent PTBP1 binding sites within them (DLINE). The wild-type reporter reproduced the splicing pattern of the endog-enous sequence before and after depletion of MATR3 and PTBP1 (Figure 4C), albeit with a generally more prominent inclusion of the LINE-proximal exon. Importantly, inclusion of the LINE-proximal exon strongly increased in theDLINE reporter, with loss of regu-lation by MATR3/PTBP1 (Figure 4C). Hence, the L2 sequence downstream of the exon appears essential for the capacity of MATR3/PTBP1 to repress the exon. We conclude that MATR3 and PTBP1 directly bind LINEs to synergistically repress the use of splice and poly(A) sites within and close to the intronic LINEs inACAD9.
Evolutionarily Old LINEs Are a Major Source of Mammalian Alternative Exons
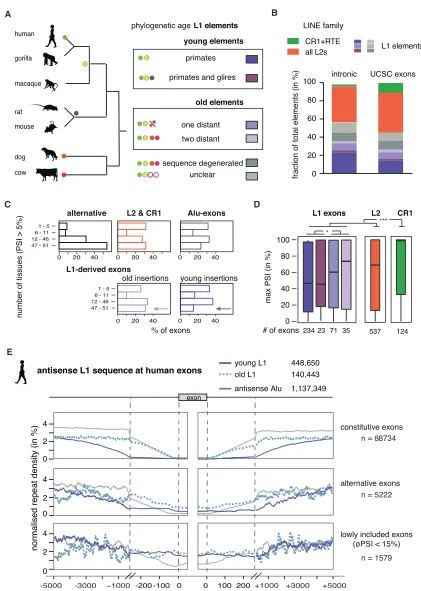
To assess the impact of LINE-derived exons on transcriptomes of human tissues, we used the RNA-seq data available from the GTEx Consortium (2015) (V6p data). We monitored inclusion of 45,940 exons of 4,566 genes in RNA-seq data across 51 tis-sues, including all known derived exons. 1,154 LINE-derived exons had 5% inclusion in at least one tissue; in contrast to other alternative exons, LINE-derived exons are rarely switch-like events (Figure S6A) but are generally more highly included than the primate-specific Alu-derived exons (Figure S6B), which suggests a correlation between evolu-tionary age and formation of new exons at repetitive elements. To study this further, we estimated the evolutionary age of individual L1 elements. We performed cross-species compari-son of all human L1 elements with two primate genomes, two rodents, and one each of the carnivore and laurasiatherian line-ages (Figure 5A) and annotated the age of all L1 elements according to their most likely time of insertion as primate-spe-cific (459,702), euarchontoglires-speprimate-spe-cific (38,642), or as more ancient elements that inserted before the mammalian radiation (142,739). We further categorized mammal-wide insertions by assigning if they were present in dog and cow (two distant spe-cies) or only in one of them (one distant), which might indicate differences in selective pressure for their retention. The diver-gence from the consensus of the corresponding L1 family confirmed our age estimates determined by cross-species comparison (Figure S6C).
Notably, the exons derived from primate-specific L1 elements were highly tissue-specific, because they were rarely present in all of the 51 tissues and had the highest difference in inclusion between any pair of tissues (Figures 5C andS6D). Conversely, the highest inclusion in any tissue of exons from primate-specific L1 elements was lower than for exons derived from evolutionarily older L1 elements and lower than for exons derived from L2 and CR1 elements (Figure 5D). Between tissues, we found highest inclusion of LINE-derived exons was often in tissues of the repro-ductive system and the brain (Figure S6E).
CR1 and L2 elements are less prevalent in human, but are substantially older than L1 elements, because most inserted before the mammalian radiation (Deininger and Batzer, 2002). We identified 594 L2- and 150 CR1-derived exons with >5% inclusion in at least one tissue. Exons derived from L2 elements have similar inclusion levels to the well-preserved mammal-wide L1 insertions, and CR1-derived exons have the highest inclusion levels (Figure 5D). Taken together, we show that the use and inclusion level across tissues of LINE-derived exons increases with the evolutionary age of the LINE.
Evolutionarily Young LINEs Are Generally Confined to Deep Intronic Regions
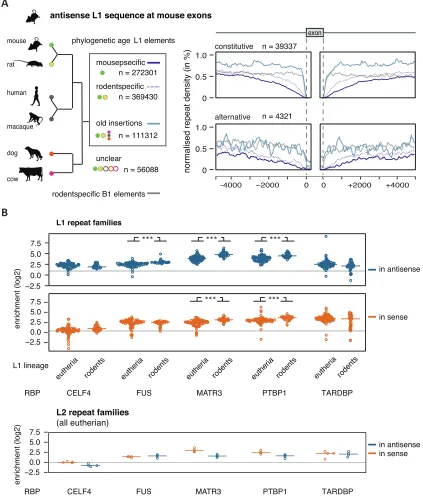
MATR3 and PTBP1/2 preferentially repress LINE-derived exons that are located within long introns (Figure S3G). Notably, among all LINE-derived exons, only exons from L1 elements were located within particularly long introns (Figure S6F). To better understand how phylogenetic classes of L1s are positioned in pre-mRNAs, we examined their distribution around different types of exons. Strikingly, we found that young, antisense L1 elements were almost completely depleted from the 500-nt regions around constitutive exons and less frequent up to 3 kb away from exons compared to old LINEs (Figure 5E). Older L1s were well tolerated up to 250 nt at all exons, and their depletion is apparent only in close vicinity of constitutive exons. A milder exclusion of young L1s was seen around alternative exons, with no exclusion around exons with low inclusion across human tissues (average percent spliced index [PSI] <15%), indicating that the L1 might contribute to the repression of these exons. In contrast to the primate-specific antisense L1s, the primate-specific Alu repeats were only excluded from the immediate vicinity of exons, but not from the flanking intronic regions. To assess if selection pressure against young L1s takes place also in other species, we classi-fied the evolutionary age of mouse L1 elements and repeated the analysis on mouse L1-derived exons. Consistently, mouse-and rodent-specific L1 were excluded from the vicinity of constitutive exons in a similar pattern as the primate-specific L1s in human (Figure S7A). Just like Alu repeats in human, the rodent-specific B1 elements were only excluded from the im-mediate vicinity of exons. Overall, this indicates that evolution-arily young, antisense L1 elements are under particularly strong
(C) Metadata profiles of MATR3 and PTBP1 iCLIP binding across±2 kb of the splice site of LINE-derived exons shown in (B). iCLIP binding is presented as a
percentage of occupancy, and was smoothed using 40-nt bins. Occupancy on non-regulated sites is shown in gray as control.
(D) Percent change in the use of the proximal poly(A) sites. poly(A) sites are split into those within 2 kb vicinity of a LINE and those that are not.
(E) Metadata profiles of MATR3 and PTBP1 iCLIP binding as in (C) across±2 kb of the poly(A) sites shown in (D).
negative selection in the vicinity of established exons, both in primates and in rodents.
Phylogenetic Groups of LINEs Differ in Their RBP Interactome
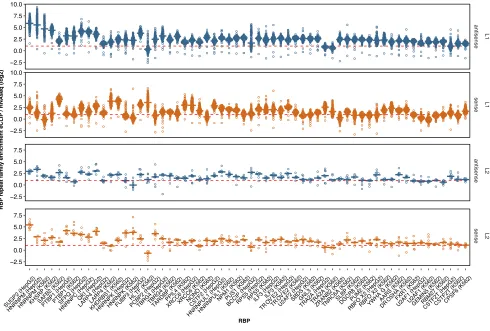
In spite of their distinct inclusion levels, we did not find any marked differences in the splice site strengths of LINE-derived exons derived from elements of different of the phylogenetic age (Figure S6G). Therefore, we reasoned that differential bind-ing of regulatory RBPs might determine the exonization of LINEs. To test this hypothesis, we exploited the available iCLIP and eCLIP data to analyze RBP binding profiles. In total, 126,628 LINEs contained one cDNA per million read for at least one of the 49 LINE-binding RBPs in at least one human cell line, including 93,420 L1 elements. We calculated a relative binding score for each RBP relative to the average binding of all 49 RBPs on each L1 and visualized binding preferences across the phylogenetic groups of L1 elements. Strikingly, MATR3 was the RBP with strongest iCLIP enrichment on primate-spe-cific L1s, and PTBP1 was enriched on these both in iCLIP and eCLIP (Figure 6A). Similarly, we find that MATR3 and PTBP1 preferentially bind to L1 families that are evolutionarily young in the mouse (Figure S7A). Given our finding that MATR3 and PTBP1 can inhibit splicing and 30end processing in the vicinity of LINEs (Figure 3A), their preferential binding to evolutionarily young LINEs could contribute to the negative selection against presence of these LINEs close to exons (Figure 5E).
Notably, most RBPs enriched on primate-specific L1s are known splicing repressors (underlined in red in Figure 6A) (Coelho et al., 2015; Ling et al., 2015; Xu et al., 2014; Lebedeva
et al., 2011; Damianov et al., 2016). In contrast, RBPs enriched on evolutionarily older L1s include many factors known to enhance splicing or 30 processing, including SR proteins, U2AF2, CSTF2, and CPSF6 (underlined in green inFigure 6A). Thus, decreased binding of repressive RBPs, accompanied by binding of splice-promoting RBPs, could explain why the evolu-tionarily younger L1s are mainly restricted to deep intronic re-gions, while older L1s are the more common source of exons.
High Density of RBP Binding Motifs within L1 Recruits RBPs to Repress Cryptic Splice Sites
Given the selection against antisense L1 sequences proximal to exons, and their RBP interactome, we predicted that antisense L1 sequence contain splice-repressive sequences. As a first step, we examined the presence of exonic splice enhancer (ESEs) and intronic splice silencer sequences (ISSs), as defined by previous studies (Fairbrother et al., 2002; Wang et al., 2013). This showed that the ratio of ESEs to ISS increases with the age of L1 elements (Figure 6B). Next, we searched for motifs recog-nized by the RBP preferentially binding to antisense L1 elements (Table S7, motifs and references inTable S1). Among the pen-tamers that change most in frequency from evolutionarily young to old insertions, we found several binding motifs recognized by the LINE-binding RBPs, particularly, evolutionarily older L1s contained fewer binding motifs of ELAVL1, PTBP1, HNRNPC, and HNRNPM, but increased incidence of multiple binding motifs for KHDRBS1 (false discovery rate [FDR] <0.05). We noticed that often L1 elements contained many copies of a particular splice-repressive motif, while other L1 elements would be entirely devoid of it. Therefore, we also counted the highest A
B C
Figure 4. Partial Deletion of L2 Sequences Disrupts Splicing Repression ofACAD9by MATR3/PTBP1
(A) Schematic illustrating the endogenous ACAD9 locus and the ACAD9 splice reporter. The first two exons and the complete intron1 were cloned into a
CMV-driven reporter plasmid. In theDLINE splice
reporter, 499 bp of L2 sequence were replaced by non-repetitive sequence of intron2 of ACAD9. Arrows indicate positions of primers used for isoform detection in RT-PCR.
(B) The inclusion level of the LINE-proximal alter-native exon in endogenous ACAD9 was measured in total RNA of cells depleted of MATR3 and PTBP1/2 individually or in combination. (C) The inclusion level of the LINE-derived exon
was measured as in (B) in the wild-type andDLINE
ACAD9 splice reporter.
(B and C) To test for significance, one-way ANOVA was used coupled with multiple comparison correction according to Tukey’s HSD. ***p value below 0.001. Semiquantitative RT-PCR analysis is averaged across three independent replicates, error bars indicate SD. Additional splice products are indicated by asterisks; these include a longer
form of exon1 with an alternative 50 splice site
(exon 1b). For simplicity, only the relevant isoforms are quantified.
B
C A
D
E
Figure 5. Evolutionarily Old LINEs Are a Source of Lineage-Specific Alternative Exons
(A) The phylogenetic age of each LINE fragment in the human genome was mapped by comparison to the gorilla, rhesus macaque, mouse, rat, dog, and cow genome assemblies using UCSC liftover genome alignments overlaid with RepeatMasker annotation. Elements specific to the primate or euarchontoglires
density of individual motifs within 100 nucleotides. Particularly common were repeats of binding motifs for HNRNPC, PTBP1, ELAVL1, TIA1, TADRBP, and HNRNPM. The L1 elements with such repeats were more often primate-specific and deep-in-tronic than expected by chance (Figure 6C).
Putative splice sites are common across the L1 sequence (Belancio et al., 2006). To understand better their positions at LINE-derived exons, we plotted splice sites of these exons along the consensus sequence model of L1 and L2. Notably, most splice sites are derived from a hotspot at the boundary between ORF2 and the 30UTR region of L1 and L2 (Figure 6D). In the consensus sequence, binding motifs of a number of splice repressors were common across the region encoding for L1 ORF2p and often repeated within a few 100 nt (Figure 6D). In contrast, binding motifs of repressive RBPs such as PTBP1 are common across the body of a full-length L1 element, partic-ularly in the region encoding the L1 ORF2p, where they can form multivalent binding sites, some of which span over 100 nt (Figure 6E). To understand how such motifs influence RBP binding patterns, we mapped the e/iCLIP data of the most relevant RBPs onto the consensus sequence of the pri-mate-specific L1 family, L1PA. We found that many repressive RBPs primarily bind within the region encoding ORF1p and ORF2p, including ELAVL1, MATR3, PTBP1, TARDBP, and HNRNPM, while the region close to the 30UTR commonly gives rise to exons.
Finally, we asked if the binding sites for repressive RBPs are part of the regions that are selected against within exon-proximal L1 elements. We aligned groups of exon-proximal and deep-in-tronic antisense L1s against the consensus sequences of the most common L1 families (Figure 6F). All three families showed strong 50 truncation, leading to loss of ORF1p and a major portion of ORF2p sequence, but the extent of deletion of the ORF2p region was stronger at exon-proximal elements in all families. The difference between deep intronic and exon-prox-imal L1s was clearest for the mammal-wide families, L1MA and L1ME, which are old enough to have undergone significant divergence upon selective pressure. We conclude large parts of the ORF2p region are widely selected against in exon-prox-imal insertions, which coincides with the regions containing the largest density of binding motifs for repressive RBPs. The binding sites for repressive RBPs are a likely reason for negative selection of young L1 elements from the proximity to exons. We hypothesize that removal of these repressive sites upon
evolu-tionary divergence of antisense L1s decreases the negative selection, allowing them to be located closer to exons, and to seed L1-derived exons.
DISCUSSION
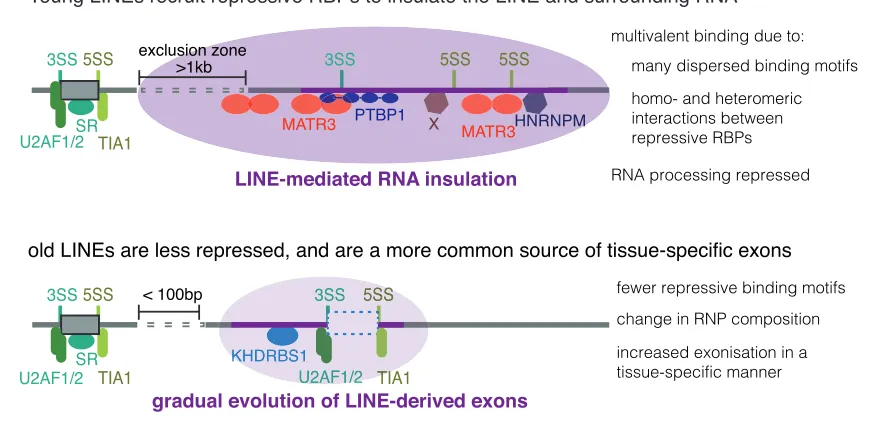
We analyzed the binding patterns of dozens of RBPs across multiple cell lines to find that the RBPs assemble on over 100,000 LINEs in transcripts of human genes. The most com-mon of these are the antisense L1 elements. The evolutionarily young L1s primarily recruit RBPs that repress RNA processing, and thereby they insulate the deep intronic RNA from the splicing and polyadenylation machineries (Figure 7). These young L1 elements are depleted from exon proximal regions, indicating that they are under negative selection due to their repressive effects on adjacent exons. We found a high density of binding motifs for repressive RBPs and of intronic splice silencer sequences in young antisense L1s, providing the potential for multivalent RBP:RNA binding. Accumulation of mutations in evolutionarily older LINEs decreases the number and multivalency of these splice-repressive motifs. This leads to decreased binding of repressive RBPs, allows older LINEs to be positioned closer to exons, and makes them accessible to the splicing machinery. As a result, older LINEs more often give rise to alternative exons that are highly included in tran-scripts expressed across many human tissues.
The Potential for Oligomeric RNP Assembly on LINEs by Multivalent Binding Sites
We describe more than 20 RBPs with enriched binding to LINEs, and we show that antisense L1 elements, in particular, tend to contain a high density of binding motifs for many of these RBPs. It is likely some of these RBPs bind LINEs co-operatively and as part of larger RBP complexes. We directly demonstrate that MATR3 is required for efficient crosslinking of PTBP1 to anti-sense L1 elements, which contain multivalent binding sites. This can be modeled inin vitroexperiments, and we show that a linear peptide motif in MATR3 is strictly required for the two proteins to simultaneously bind to RNAin vitro. We expect that many more RBP:RBP interactions contribute to efficient recruitment of splicing repressors to LINEs. MATR3 has been reported as part of several nuclear multimeric complexes (Damianov et al., 2016; Zhang and Carmichael, 2001; Iradi et al., 2018) that include HNRNPM, RBFOX1 and ILF3, all three of which we found to be
lineage are considered evolutionarily young elements, while elements present in cow and dog are considered old elements. Phylogenetic groups are color-coded and used in analysis (B–E).
(B) Percentage of UCSC annotated exons derived from phylogenetic groups as defined in (A). Exons are generally not derived from the youngest L1 elements. (C) Exons derived from evolutionarily young L1 elements are rarely used across many tissue subtypes in human. Percent spliced index (PSI) was calculated in the GTEx panel of human tissue samples for LINE-derived exons annotated in UCSC. We determined the number of tissues in which each exon was detectable at PSI >5% and compared repeat-derived exons to non-repeat derived alternative exons.
(D) Maximum inclusion in any tissue correlates with the genomic age of L1-derived exons. Significance was tested across groups by Kruskal-Wallis’ rank-sum test. The number of exons in each group is indicated at the bottom; *adjusted p values below 0.05, ***adjusted p values below 0.001.
(E) Density profiles showing L1 antisense sequence 5 kb upstream and downstream of human exons. L1s were split for evolutionary young and old insertions and repeat density is normalized to the total number of repeats in the two groups. For comparison, the primate-specific Alu insertions are shown. Exons were grouped by inclusion in human tissues into those that are >5% but on average <15% included in any tissue, those which are alternative, and those which are constitutively included. To better present the repeat density around the splice sites, the x axis is cut at 250 nt to show a zoom-in of the 250 nt flanking the exons. øPSI, average PSI across 51 tissues.
A
B D
C
F
E
also enriched at antisense L1 elements. It remains to be seen if MATR3 contributes to the enriched binding of these RBPs to the young antisense L1s.
In light of the recent observations that multivalent interac-tions are required for phase-transitioning of several RBPs (Lin et al., 2015; Banani et al., 2017), the high density of binding sites within antisense L1s is striking. Clustered RNA binding motifs can enable RBPs to achieve high-affinity binding by cooperative interactions with multiple RNA binding domains, as for instance shown for PTBP1 (Cereda et al., 2014). PTBP1 and other RBPs can form oligomers and undergo liquid phase separation when bound to RNA (Banani et al., 2017). Antisense L1 elements might be a suitable scaffold for
forma-tion of heteromeric complexes through multivalent binding. In case of MATR3 and PTBP1, binding of both proteins is clearly necessary for and more effective in repression of LINE-derived exons. It will be of prime interest to understand further if inter-action surfaces that promote phase separation are necessary to effectively insulate repetitive elements from the processing machineries.
Mutations in the intrinsically disordered regions of a number of RBPs, including MATR3, can lead to neuronal death in amyotrophic lateral sclerosis (Bakkar et al., 2018), and these mutations often change the dynamics of RNP assembly. Deregulation of retrotransposons, including LINEs, has been observed in a Drosophila model of ALS (Krug et al., 2017),
Figure 6. Young L1 Elements Are Rich in Splice Repressor Binding Motifs that Are Lost in Evolutionarily Older Element
(A) RBPs show preferences for binding to L1 elements of different evolutionary ages. The L1 elements with 10% highest coverage across any i/eCLIP data were used to calculate a relative binding estimate for each RBP ranging from 0 to 1, and for visualization of binding preference, the enrichment of each RBP was normalized to its mean. The number of L1 elements considered in each cell line is given at the bottom. RBPs considered splice-repressive are underlined in red, and components of the RNA processing machineries in green.
(B) Cumulative distribution function of gain or loss of exonic splice enhancer (ESS) and intronic splice silencers sequences (ISS). All hexamer sequences were ranked by their enrichment in evolutionarily young compared to old LINEs.
(C) Antisense L1 sequences with known binding motifs for relevant RBPs, and the percentage of evolutionarily young versus old elements among them and the percent of deep intronic versus exon-proximal elements. The dotted line indicates the expected proportion. RBPs with multivalent binding sites are marked with one or two red dots, if 10% and 20% of the 100-nt window were part of the motif, respectively. We used the top 10% of L1 sequences with the highest density of binding motifs within a 100-nt window.
(D) The position of splice sites of L1-derived exons across the L1 sequence. For reference, the structure of the L1PA family of L1s is given on top. Only splice sites in antisense L1 elements are shown.
(E) The position of RBP binding motifs within the antisense L1PA family consensus sequence in green. On top of the track with each RBP’s binding motifs, coverage in e/iCLIP binding data is shown.
(F) Alignment of antisense L1 insertions against L1 consensus sequences. We selected deep intronic insertions (shown in blue) and exon-proximal insertions (in orange) and aligned them against three consensus families, only keeping the best alignment for each genomic insertion.
See alsoFigure S7andTable S7.
Figure 7. Evolution of LINEs from RNA Insulation to a Template for New Exons
Consensus L1 elements contain strong putative splice sites, but exonization is rare. Evolutionarily young L1s recruit a number of splice repressive proteins,
including MATR3, PTBP1, and HNRNPM, as well as RBPs of yet unknown function (indicated by X; including BCCIP and SUGP2, seeFigure 6A). These proteins
therefore we speculate that mutation-driven changes in the RNP assembly on LINEs could also contribute to neuronal dis-eases in humans.
Could the Repressive Effects of Young LINEs Explain Their Exclusion Zone around Exons?
The decreased abundance of LINEs in the immediate vicinity of splice sites has been previously observed (Zhang et al., 2011; Corvelo and Eyras, 2008), and we now find that this depletion is dependent on their evolutionary age, with a strongest deple-tion seen for evoludeple-tionarily young LINEs. Multiple scenarios could result in purifying selection against exon-proximal young LINEs in a species, and they are not mutually exclusive: (1) pur-ifying selection against LINEs when inserted close to exons, due to their inherent capacity to repress splicing of nearby exons; (2) de novoformation of exons only outside the repressive environ-ment created by LINEs; and (3) the accumulation of sequence truncations and mutations in LINEs that decrease their repres-sive capacity. The prevalence of antisense L1 elements in deep intronic regions is likely a major factor for the accumulation of splice silencer sequences in human introns. LINEs also allow accumulation of cryptic splice sites within large introns, as a consequence of the insulation by repressive RBPs. It is possible that additional pathways contribute to this insulation, such as the low number of splice enhancer sequences, DNA methylation and repressive chromatin.
LINEs are the most prevalent repetitive elements in the human genome thus greatly contributing to the increase of intron size in mammals. It is striking that the consensus sequences of antisense young L1 families are rich in intronic splice silencer sequences and binding motifs of splice-repressive RBPs, and the antisense orientation is twice as common in introns. This sug-gests that new insertions are immediately repressed when in antisense orientation, which likely allows them to persist and contribute to the expansion of mammalian introns throughout evolution.
LINEs Facilitate the Evolution of RNA Processing
The highly multivalent sites bound by repressive RBPs are often lost in the older L1s due to their more diverse sequences. Removal of those repressive binding sites is paralleled by a rela-tive increase in binding of splice-promoting RBPs and facilitates evolution of new exons. The relationship between repressive RBPs and LINEs is in many ways similar to the evolutionary dynamics of KAP1/KRAB transcription factors, which repress transcription preferentially at young retrotransposons, and confer robustness to transcriptional networks while facilitating evolutionary innovation (Castro-Diaz et al., 2014; Thomas and Schneider, 2011; Imbeault et al., 2017).
We observe that L1-derived exons are highly tissue-specific, and the highest number of them is found in the testis and the brain (Figure S6E). The testis is known to be promiscuous in its transcriptional output, which has been suggested to facilitate gene birth (Kaessmann, 2010). Similarly, varying activity of repressive RBPs across tissues might facilitate the creation of new LINE-derived exons in specific cell types. Moreover, muta-tions in RBPs or in LINEs themselves could cause disease through aberrant splicing of LINE-derived exons.
STAR+METHODS
Detailed methods are provided in the online version of this paper and include the following:
d KEY RESOURCES TABLE
d CONTACT FOR REAGENT AND RESOURCE SHARING d EXPERIMENTAL MODEL AND SUBJECT DETAILS
B Cell lines B Mice
d METHOD DETAILS B siRNA transfection B Generation of iCLIP data
B Mapping of iCLIP and eCLIP data
B TEtranscript estimates of LINE family enrichments B Analysis of PTBP1 binding peaks
B Nucleo-cytoplasmic fractionation for RNA isolation B Generation of RNaseq libraries
B Mapping of RNaseq with TopHat2
B Generation of pAseq libraries and mapping B Semiquantitative RT-PCRs
B UV crosslinking assay on recombinant proteins B Sequence motif analysis
B RNA maps
B De novo identification of cryptic exons and analysis of differential exon inclusion
B Analysis of LINE-derived exon inclusion in human tissues
B Annotation of ‘established’ alternative exons in mouse and human
B Classification of repeat element age by divergence or phylogenetic tracing
B Calculation of a normalized binding score for RBPs on LINE fragments
B Comparison of exon-proximal and deep intronic anti-sense L1 elements
d QUANTIFICATION AND STATISTICAL ANALYSIS B Sample size and replicates
B Software and Statistics
d DATA AND SOFTWARE AVAILABILITY B Data
SUPPLEMENTAL INFORMATION
Supplemental Information includes seven figures and seven tables and can be
found with this article online athttps://doi.org/10.1016/j.cell.2018.07.001.
ACKNOWLEDGMENTS
The authors are grateful to M. Briese, L. Easton, I. Huppertz, and J. Tollervey for sharing unpublished iCLIP data; R. Faraway, I. Huppertz, I. Ruiz de los Mozos, and G. Kelly for valuable assistance; and S. Jurmeister and C. Pederiva for comments on this manuscript and for valuable advice. We thank the Geno-mics Facility Teams of the CRUK Cambridge Institute and the UCL Institute of Neurology for processing libraries for high-throughput sequencing, and G. Rot
for mRNA 30end sequencing mapping on the expressRNA platform. This work
(110292/Z/15/Z to A.M.C.). N.M.L. is a Winton Group Leader in recognition of the Winton Charitable Foundation’s support towards the Francis Crick Insti-tute, and is additionally funded by the MRC eMedLab Medical Bioinformatics Infrastructure Award (MR/L016311/1) and core funding from the Okinawa Insti-tute of Science & Technology Graduate University. The Francis Crick InstiInsti-tute receives its core funding from Cancer Research UK (FC001110), the UK Medical Research Council (FC001110), and the Wellcome Trust (FC001110)
(to N.M.L., J.A., F.A., and A.M.C.). Animal shapes inFigure 5were obtained
from PhyloPic and are used under the Creative Commons Attribution-NonCommercial-ShareAlike 3.0 Unported license. Images created by M. Kes-sey, D. Liao, and M. Karala.
AUTHOR CONTRIBUTIONS
J.A., C.G., C.W.J.S., and J.U. conceived the project and designed the exper-iments. F.A. supervised computational analysis. J.A., C.G., J.A.Z., and A.S. performed experiments. J.A., F.A., A.M.C., N.H., and W.E. performed compu-tational analysis. J.A., F.A., C.W.J.S., N.M.L., and J.U. interpreted and conceptualized primary data.
DECLARATION OF INTERESTS
The authors declare no competing interests.
Received: December 2, 2017 Revised: April 23, 2018 Accepted: July 1, 2018 Published: August 2, 2018
REFERENCES
Attig, J., Ruiz de Los Mozos, I., Haberman, N., Wang, Z., Emmett, W., Zarnack, K., Ko¨nig, J., and Ule, J. (2016). Splicing repression allows the gradual emer-gence of new Alu-exons in primate evolution. eLife5, e19545.
Bakkar, N., Kovalik, T., Lorenzini, I., Spangler, S., Lacoste, A., Sponaugle, K., Ferrante, P., Argentinis, E., Sattler, R., and Bowser, R. (2018). Artificial intelli-gence in neurodegenerative disease research: use of IBM Watson to identify additional RNA-binding proteins altered in amyotrophic lateral sclerosis. Acta Neuropathol.135, 227–247.
Banani, S.F., Lee, H.O., Hyman, A.A., and Rosen, M.K. (2017). Biomolecular condensates: organizers of cellular biochemistry. Nat. Rev. Mol. Cell Biol.
18, 285–298.
Beck, C.R., Collier, P., Macfarlane, C., Malig, M., Kidd, J.M., Eichler, E.E., Badge, R.M., and Moran, J.V. (2010). LINE-1 retrotransposition activity in hu-man genomes. Cell141, 1159–1170.
Belancio, V.P., Hedges, D.J., and Deininger, P. (2006). LINE-1 RNA splicing and influences on mammalian gene expression. Nucleic Acids Res. 34, 1512–1521.
Brouha, B., Schustak, J., Badge, R.M., Lutz-Prigge, S., Farley, A.H., Moran, J.V., and Kazazian, H.H., Jr. (2003). Hot L1s account for the bulk of retrotrans-position in the human population. Proc. Natl. Acad. Sci. USA100, 5280–5285.
Burns, K.H., and Boeke, J.D. (2012). Human transposon tectonics. Cell149, 740–752.
Camacho, C., Coulouris, G., Avagyan, V., Ma, N., Papadopoulos, J., Bealer, K., and Madden, T.L. (2009). BLAST+: architecture and applications. BMC Bioinformatics10, 421.
Castro-Diaz, N., Ecco, G., Coluccio, A., Kapopoulou, A., Yazdanpanah, B., Friedli, M., Duc, J., Jang, S.M., Turelli, P., and Trono, D. (2014). Evolutionally dynamic L1 regulation in embryonic stem cells. Genes Dev.28, 1397–1409.
Cereda, M., Pozzoli, U., Rot, G., Juvan, P., Schweitzer, A., Clark, T., and Ule, J. (2014). RNAmotifs: prediction of multivalent RNA motifs that control alternative splicing. Genome Biol.15, R20.
Coelho, M.B., Attig, J., Bellora, N., Ko¨nig, J., Hallegger, M., Kayikci, M., Eyras, E., Ule, J., and Smith, C.W. (2015). Nuclear matrix protein Matrin3 regulates
alternative splicing and forms overlapping regulatory networks with PTB. EMBO J.34, 653–668.
Corvelo, A., and Eyras, E. (2008). Exon creation and establishment in human genes. Genome Biol.9, R141.
Damianov, A., Ying, Y., Lin, C.H., Lee, J.A., Tran, D., Vashisht, A.A., Bahrami-Samani, E., Xing, Y., Martin, K.C., Wohlschlegel, J.A., and Black, D.L. (2016). Rbfox Proteins Regulate Splicing as Part of a Large Multiprotein Complex LASR. Cell165, 606–619.
Deininger, P.L., and Batzer, M.A. (2002). Mammalian retroelements. Genome Res.12, 1455–1465.
Dignam, J.D., Lebovitz, R.M., and Roeder, R.G. (1983). Accurate transcription initiation by RNA polymerase II in a soluble extract from isolated mammalian nuclei. Nucleic Acids Res.11, 1475–1489.
Dobin, A., Davis, C.A., Schlesinger, F., Drenkow, J., Zaleski, C., Jha, S., Batut, P., Chaisson, M., and Gingeras, T.R. (2013). STAR: ultrafast universal RNA-seq aligner. Bioinformatics29, 15–21.
Fairbrother, W.G., Yeh, R.F., Sharp, P.A., and Burge, C.B. (2002). Predictive identification of exonic splicing enhancers in human genes. Science 297, 1007–1013.
Feng, Q., Moran, J.V., Kazazian, H.H., Jr., and Boeke, J.D. (1996). Human L1 retrotransposon encodes a conserved endonuclease required for retrotrans-position. Cell87, 905–916.
Goodier, J.L., Cheung, L.E., and Kazazian, H.H., Jr. (2013). Mapping the LINE1 ORF1 protein interactome reveals associated inhibitors of human retrotrans-position. Nucleic Acids Res.41, 7401–7419.
Gooding, C., Roberts, G.C., and Smith, C.W. (1998). Role of an inhibitory pyrimidine element and polypyrimidine tract binding protein in repression of a regulated alpha-tropomyosin exon. RNA4, 85–100.
GTEx Consortium (2015). Human genomics. The Genotype-Tissue Expression (GTEx) pilot analysis: multitissue gene regulation in humans. Science348, 648–660.
Haberman, N., Huppertz, I., Attig, J., Ko¨nig, J., Wang, Z., Hauer, C., Hentze, M.W., Kulozik, A.E., Le Hir, H., Curk, T., et al. (2017). Insights into the design and interpretation of iCLIP experiments. Genome Biol.18, 7.
Han, J.S., Szak, S.T., and Boeke, J.D. (2004). Transcriptional disruption by the L1 retrotransposon and implications for mammalian transcriptomes. Nature
429, 268–274.
Hughes, A.L. (1997). Rapid evolution of immunoglobulin superfamily C2 domains expressed in immune system cells. Mol. Biol. Evol.14, 1–5.
Huppertz, I., Attig, J., D’Ambrogio, A., Easton, L.E., Sibley, C.R., Sugimoto, Y., Tajnik, M., Ko¨nig, J., and Ule, J. (2014). iCLIP: protein-RNA interactions at nucleotide resolution. Methods65, 274–287.
Imbeault, M., Helleboid, P.Y., and Trono, D. (2017). KRAB zinc-finger proteins contribute to the evolution of gene regulatory networks. Nature543, 550–554.
Iradi, M.C.G., Triplett, J.C., Thomas, J.D., Davila, R., Crown, A.M., Brown, H., Lewis, J., Swanson, M.S., Xu, G., Rodriguez-Lebron, E., and Borchelt, D.R. (2018). Characterization of gene regulation and protein interaction networks for Matrin 3 encoding mutations linked to amyotrophic lateral sclerosis and myopathy. Sci. Rep.8, 4049.
Jin, Y., Tam, O.H., Paniagua, E., and Hammell, M. (2015). TEtranscripts: a package for including transposable elements in differential expression anal-ysis of RNA-seq datasets. Bioinformatics31, 3593–3599.
Jurka, J. (1998). Repeats in genomic DNA: mining and meaning. Curr. Opin. Struct. Biol.8, 333–337.
Kaessmann, H. (2010). Origins, evolution, and phenotypic impact of new genes. Genome Res.20, 1313–1326.
Kelley, D.R., Hendrickson, D.G., Tenen, D., and Rinn, J.L. (2014). Transpos-able elements modulate human RNA abundance and splicing via specific RNA-protein interactions. Genome Biol.15, 537.
Krug, L., Chatterjee, N., Borges-Monroy, R., Hearn, S., Liao, W.W., Morrill, K., Prazak, L., Rozhkov, N., Theodorou, D., Hammell, M., and Dubnau, J. (2017). Retrotransposon activation contributes to neurodegeneration in a Drosophila TDP-43 model of ALS. PLoS Genet.13, e1006635.
Langmead, B., and Salzberg, S.L. (2012). Fast gapped-read alignment with Bowtie 2. Nat. Methods9, 357–359.
Lebedeva, S., Jens, M., Theil, K., Schwanha¨usser, B., Selbach, M., Landthaler, M., and Rajewsky, N. (2011). Transcriptome-wide analysis of regulatory inter-actions of the RNA-binding protein HuR. Mol. Cell43, 340–352.
Lee, J.Y., Ji, Z., and Tian, B. (2008). Phylogenetic analysis of mRNA polyade-nylation sites reveals a role of transposable elements in evolution of the 30-end of genes. Nucleic Acids Res.36, 5581–5590.
Lin, Y., Protter, D.S., Rosen, M.K., and Parker, R. (2015). Formation and matu-ration of phase-separated liquid droplets by RNA-binding proteins. Mol. Cell
60, 208–219.
Ling, J.P., Pletnikova, O., Troncoso, J.C., and Wong, P.C. (2015). TDP-43 repression of nonconserved cryptic exons is compromised in ALS-FTD. Science349, 650–655.
Ling, J.P., Chhabra, R., Merran, J.D., Schaughency, P.M., Wheelan, S.J., Cor-den, J.L., and Wong, P.C. (2016). PTBP1 and PTBP2 repress nonconserved cryptic exons. Cell Rep.17, 104–113.
Meischl, C., Boer, M., Ahlin, A., and Roos, D. (2000). A new exon created by intronic insertion of a rearranged LINE-1 element as the cause of chronic gran-ulomatous disease. Eur. J. Hum. Genet.8, 697–703.
Merkin, J.J., Chen, P., Alexis, M.S., Hautaniemi, S.K., and Burge, C.B. (2015). Origins and impacts of new mammalian exons. Cell Rep.10, 1992–2005.
Penzkofer, T., Ja¨ger, M., Figlerowicz, M., Badge, R., Mundlos, S., Robinson, P.N., and Zemojtel, T. (2017). L1Base 2: more retrotransposition-active LINE-1s, more mammalian genomes. Nucleic Acids Res.45(D1), D68–D73.
Ray, D., Kazan, H., Cook, K.B., Weirauch, M.T., Najafabadi, H.S., Li, X., Guer-oussov, S., Albu, M., Zheng, H., Yang, A., et al. (2013). A compendium of RNA-binding motifs for decoding gene regulation. Nature499, 172–177.
Rot, G., Wang, Z., Huppertz, I., Modic, M., Lence, T., Hallegger, M., Haberman, N., Curk, T., von Mering, C., and Ule, J. (2017). High-resolution RNA maps sug-gest common principles of splicing and polyadenylation regulation by TDP-43. Cell Rep.19, 1056–1067.
Schwahn, U., Lenzner, S., Dong, J., Feil, S., Hinzmann, B., van Duijnhoven, G., Kirschner, R., Hemberger, M., Bergen, A.A., Rosenberg, T., et al. (1998). Posi-tional cloning of the gene for X-linked retinitis pigmentosa 2. Nat. Genet.19, 327–332.
Sepulveda, M.A., Garrett, F.E., Price-Whelan, A., and Birshtein, B.K. (2005). Comparative analysis of human and mouse 30Igh regulatory regions identifies distinctive structural features. Mol. Immunol.42, 605–615.
Sibley, C.R., Blazquez, L., and Ule, J. (2016). Lessons from non-canonical splicing. Nat. Rev. Genet.17, 407–421.
Sloan, C.A., Chan, E.T., Davidson, J.M., Malladi, V.S., Strattan, J.S., Hitz, B.C., Gabdank, I., Narayanan, A.K., Ho, M., Lee, B.T., et al. (2016). ENCODE data at the ENCODE portal. Nucleic Acids Res.44(D1), D726–D732.
Smit, A.F. (1999). Interspersed repeats and other mementos of transposable elements in mammalian genomes. Curr. Opin. Genet. Dev.9, 657–663.
Smit, A.F., To´th, G., Riggs, A.D., and Jurka, J. (1995). Ancestral, mammalian-wide subfamilies of LINE-1 repetitive sequences. J. Mol. Biol.246, 401–417.
Smit, A., Hubley, R., and Green, P. (1996–2004). RepeatMasker Open-3.0.
http://wwwrepeatmasker.org.
Spellman, R., Llorian, M., and Smith, C.W. (2007). Crossregulation and func-tional redundancy between the splicing regulator PTB and its paralogs nPTB and ROD1. Mol. Cell27, 420–434.
Sterne-Weiler, T., Weatheritt, R.J., Best, A., Ha, K.C.H., and Blencowe, B.J. (2017). Whippet: an efficient method for the detection and quantification of alternative splicing reveals extensive transcriptomic complexity. bioRxiv.
https://doi.org/10.1101/158519.
Taylor, M.S., LaCava, J., Mita, P., Molloy, K.R., Huang, C.R., Li, D., Adney, E.M., Jiang, H., Burns, K.H., Chait, B.T., et al. (2013). Affinity proteomics reveals human host factors implicated in discrete stages of LINE-1 retrotrans-position. Cell155, 1034–1048.
Thomas, J.H., and Schneider, S. (2011). Coevolution of retroelements and tan-dem zinc finger genes. Genome Res.21, 1800–1812.
Trapnell, C., Roberts, A., Goff, L., Pertea, G., Kim, D., Kelley, D.R., Pimentel, H., Salzberg, S.L., Rinn, J.L., and Pachter, L. (2012). Differential gene and tran-script expression analysis of RNA-seq experiments with TopHat and Cufflinks. Nat. Protoc.7, 562–578.
Van Nostrand, E.L., Freese, P., Pratt, G.A., Wang, X., Wei, X., Blue, S.M., Dom-inguez, D., Cody, N.A.L., Olson, S., Sundararaman, B., et al. (2017). A large-scale binding and functional map of human RNA binding proteins. bioRxiv.
https://doi.org/10.1101/179648.
Wang, Y., Xiao, X., Zhang, J., Choudhury, R., Robertson, A., Li, K., Ma, M., Burge, C.B., and Wang, Z. (2013). A complex network of factors with overlap-ping affinities represses splicing through intronic elements. Nat. Struct. Mol. Biol.20, 36–45.
Xu, Y., Gao, X.D., Lee, J.H., Huang, H., Tan, H., Ahn, J., Reinke, L.M., Peter, M.E., Feng, Y., Gius, D., et al. (2014). Cell type-restricted activity of hnRNPM promotes breast cancer metastasis via regulating alternative splicing. Genes Dev.28, 1191–1203.
Yeo, G., and Burge, C.B. (2004). Maximum entropy modeling of short sequence motifs with applications to RNA splicing signals. J. Comput. Biol.
11, 377–394.
Yoshida, K., Nakamura, A., Yazaki, M., Ikeda, S., and Takeda, S. (1998). Inser-tional mutation by transposable element, L1, in the DMD gene results in X-linked dilated cardiomyopathy. Hum. Mol. Genet.7, 1129–1132.
Zhang, Z., and Carmichael, G.G. (2001). The fate of dsRNA in the nucleus: a p54(nrb)-containing complex mediates the nuclear retention of promiscuously A-to-I edited RNAs. Cell106, 465–475.
STAR
+
METHODS
KEY RESOURCES TABLE
REAGENT or RESOURCE SOURCE IDENTIFIER
Antibodies
Rabbit anti PTBP1/2, serum C. Smith;
Spellman et al., 2007
N/A
Rabbit polyclonal anti MATR3 Insight GTX47279; RRID: AB_11170111
Biotechnology
Rabbit anti GAPDH Cell Signaling 14C10; RRID: AB_10693448
Chemicals, Peptides, and Recombinant Proteins
4-thiouridine Sigma Cat# T4509-100MG
Blue Sepharose 6 Fast Flow/ HisTrap HP columns
GE LifeSciences Cat# 17-0412-01
RevertAid enzyme Fermentas Cat# 10387979
Trizol LS Life Technologies Cat# 10296028
Zymo Direct-zol Zymogen Cat# R2052
RNA MiniPrep columns
Critical Commercial Assays
RiboZero Epicenter Cat# MRZG12324
TruSeq stranded total RNA Sample Prep Kit Illumina Cat# 20020599
QuantSeq mRNA 30end sequencing kit Lexogen Cat# SKU 015.96 and SKU 016.96
Deposited Data
30end profiling of HeLa cells depleted of MATR3, PTBP1/2
This paper E-MTAB-6287. Accessible viahttps://www.ebi.ac.uk/ arrayexpress/
RNA-seq of HeLa cells depleted of MATR3, PTBP1/2
This paper E-MTAB-6204. Accessible viahttps://www.ebi.ac.uk/ arrayexpress/
iCLIP of MATR3 from C57BL/6J wildtype mice This paper E-MTAB-6283. Accessible viahttps://www.ebi.ac.uk/ arrayexpress/
4SU-iCLIP of MATR3 from HEK293 cells with or without PTBP1 depletion
This paper E-MTAB-6267. Accessible viahttps://www.ebi.ac.uk/ arrayexpress/
4SU-iCLIP of PTBP1 from HEK293 cells with or without MATR3 depletion
This paper E-MTAB-6286. Accessible viahttps://www.ebi.ac.uk/ arrayexpress/
22 further iCLIP datasets for different RBPs This paper Datasets used are listed inTable S1. Accessible via https://imaps.genialis.com/
All eCLIP data ENCODE Consortium Datasets used are listed inTable S1. Accessible via https://www.encodeproject.org/search/
?type=Experiment&assay_title=eCLIP
RNaseq data of HepG2 and K562 cells ENCODE Consortium ENCSR885DVH; ENCSR181ZG; GSE90238; GSE90256; GSE90249; GSE90230; GSE90220; GSE90248;
GSE90250; GSE90228; GSE90236; also listed inTable S1.
Analyzed data,Table S5. Phylogenetic age of L1 elements
This paper https://data.mendeley.com/datasets/56sxpgs4d9/1
Analyzed data,Table S6. Inclusion of 43583 human exons in GTEx V6p consortium data.
This paper https://data.mendeley.com/datasets/s9d9nsysjz/1
Human reference genome UCSC assembly hg19 (GRCh37)
Genome Reference Consortium
http://hgdownload.cse.ucsc.edu/goldenPath/hg19/
Repeat Masker genome annotation Smit et al., 1996–2004 RRID: SCR_012954
RepBase Jurka, 1998 N/A
CONTACT FOR REAGENT AND RESOURCE SHARING
Further information and requests for resources and reagents should be directed to and will be fulfilled by the Lead Contact, Jernej Ule ([email protected]).
EXPERIMENTAL MODEL AND SUBJECT DETAILS Cell lines
HEK293T and HeLa cells were purchased from ATCC (CRL-3216 and CCL-2; both of female origin). Both cell lines were maintained in DMEM with 10% FBS at 37C with 5% CO2 injection, and routinely passaged twice a week. Cell lines were confirmed to be myco-plasma-free with repeated testing, using either the LookOut Mycoplasma PCR Detection Kit or the MycoAlert mycoplasma detection kit (Lonza). Cells were not authenticated by us, but retrieved from trusted sources as listed in theKey Resources Table.
Mice
Mouse brain tissue used for MATR3 iCLIP was from surplus female C57BL/6 pups sacrificed after birth (P0) and supplied deep-frozen by the animal research facility of the Laboratory for Molecular Biology, Cambridge.
METHOD DETAILS siRNA transfection
To deliver siRNAs, Lipofectamin RNAiMax (Life Technologies) was used according to manufacturer’s recommendations. siRNAs are listed in theKey Resources Table.
Continued
REAGENT or RESOURCE SOURCE IDENTIFIER
Experimental Models: Cell Lines
HEK293T ATCC: CRL-3216 RRID: CVCL_0063
HeLa ATCC: CCL-2 RRID: CVCL_0045
Experimental Models: Organisms/Strains
Mouse: C57BL/6J Laboratory for Molecular
Biology, Cambridge
N/A
Oligonucleotides
MATR3 siRNA (#1) Invitrogen HSS114732
MATR3 siRNA (#2) Invitrogen HSS114730
PTBP1 siRNA, AACUUCCAUCAUUCCAGAGAA Dharmacon Customized product
PTBP2 siRNA, AAGAGAGGAUCUGACGAACUA Dharmacon Customized product
control siRNA Invitrogen Cat. #12935-300
RNA oligonucleotides with AUCUU and CTCTT binding motifs; see Methods for full sequences
SIGMA DNA oligonucleotides cloned into pGEM4Z
Customized product
Recombinant DNA
pGEM4Z Promega pGEM4Z
Software and Algorithms
Bowtie2 Langmead and Salzberg, 2012 http://bowtie-bio.sourceforge.net/bowtie2/index.shtml
TopHat2 Kim et al., 2013 RRID: SCR_013035;http://tophat.cbcb.umd.edu/
STAR Dobin et al., 2013 RRID: SCR_015899;https://github.com/alexdobin/STAR
Cufflinks Trapnell et al., 2012 RRID: SCR_014597;http://cole-trapnell-lab.github.io/ cufflinks
expressRNA Rot et al., 2017 http://www.expressrna.org/
Whippet Sterne-Weiler et al., 2017 https://github.com/timbitz/Whippet.jl
BLAST+/2.3.0 Camacho et al., 2009 RRID: SCR_001598;https://blast.ncbi.nlm.nih.gov/ Blast.cgi
R R Project for Statistical
Computing
Generation of iCLIP data
iCLIP data for MATR3 and PTBP1 was derived from HEK293T cells, incubated for 8 h with 100mM 4SU and crosslinked with 2x 400mJ/cm2365nm UV light. Protein A Dynabeads were used for immunoprecipitations (IP). 80ml of beads were washed in iCLIP lysis buffer (50 mM Tris-HCl pH 7.4, 100 mM NaCl, 1% NP-40, 0.1% SDS, 0.5% sodium deoxycholate). For the preparation of the cell lysate, 2 million cells were lysed in 1 mL of iCLIP lysis buffer (50 mM Tris-HCl pH 7.4, 100 mM NaCl, 1% NP-40, 0.1% SDS, 0.5% sodium deoxycholate), and the remaining cell pellet was dissolved in 50mL MSB lysis buffer (50mM Tris-HCl pH 7.4, 100mM NaH2PO4, 7M UREA, 1mM DTT). The mixture was diluted with CLIP lysis buffer to 1000ml and an additional centrifugation was performed. We found by Western Blotting that up to 50% of MATR3 protein is insoluble by detergent without urea. Lysates were pooled (2ml total volume) and incubated with 4 U/ml of RNase I and 2ml antiRNase (1/1000, AM2690, Thermo Fisher) at 37C for 3 min, and centrifuged. We took care to prepare the initial dilution of RNase in water, since we found that RNase I gradually loses its activity when diluted in the lysis buffer. 1.5 mL of the supernatant was then added to the beads and incubated at 4C for 4 h. The rest of the iCLIP protocol was identical to the published protocol (Huppertz et al., 2014). MATR3 and PTBP1 iCLIP libraries were sequenced on Illumina HiSeq2 machines in a single-end manner with a read length of 50nt.
Mapping of iCLIP and eCLIP data
Before mapping the reads, we removed adaptor sequences using the FASTX toolkit version 0.7 and we discarded reads shorter than 24 nucleotides. Reads were then mapped with the iCount suite to UCSC hg19/GRCh37 or mm9/NCBI37 genome assembly using Bowtie v2.0.5 allowing up to two mismatches and up to 20 multiple hits. Unique and multiple mappers were separately analyzed, and to quantify binding to individual loci, only uniquely mapping reads were used.Table S1lists the source and details including accession numbers of all published iCLIP and HITS-CLIP data used within this study.
The eCLIP libraries were downloaded from ENCODE (Van Nostrand et al., 2017; Sloan et al., 2016). Before mapping the reads, adaptor sequences were removed using Cutadapt v1.9.dev1 and reads shorter than 18 nucleotides were dropped from the analysis. Reads were mapped with STAR v2.4.0i (Dobin et al., 2013) to UCSC hg19/GRCh37 genome assembly. To quantify binding to individual loci, only uniquely mapping reads were used.
To map iCLIP and eCLIP data to the consensus LINE family sequences, adaptor sequences were first removed using custom scripts (for iCLIP) and Cutadapt v1.16 using parameters from the ENCODE eCLIP standard operating procedure (for eCLIP). Reads were then aligned to a custom index generated from L1PA2, L1MA2 and L1ME consensus sequences using Bowtie v1.1.2 with end-to-end mapping, allowing 2 mismatches and unique alignments only. PCR duplicates were collapsed using custom scripts (for iCLIP) and a script from ENCODE (for eCLIP). Alignments in the antisense direction were identified from the SAM flags.
TEtranscript estimates of LINE family enrichments
To consider both uniquely mapping and multimapping reads in estimating binding to repeat (sub)families, we used the approach described in TEtranscripts (Jin et al., 2015). In short, for eCLIP FASTQ files, adapters were removed according to the ENCODE eCLIP standard operating procedure. For iCLIP FASTQ files, barcodes were removed using the FASTX-Toolkit (v 0.0.14). For all files, reads aligning to rRNA or tRNA were removed by aligning to custom rRNA and tRNA indices (human or mouse as appropriate) using Bowtie2 (v. 2.2.9,Langmead and Salzberg, 2012). The remaining reads were aligned to the appropriate genome (GRCh38 for human, and GRCm38 for mouse) using STARv2.5.2) with the addition of the parameters ‘‘–winAnchorMultimapNmax 100–outFilterMultimapNmax 100’’ as recommended by TEtranscripts. For each CLIP dataset, TEtranscripts was run using both stranded options (–stranded reverse and–stranded yes) to obtain results for sense and antisense LINE binding.
RNaseq data from ENCODE was used as control, for eCLIP RNaseq of K562 and HEPG2 cells lines (ENCSR885DVH and ENCSR181ZG). For iCLIP samples from mouse brain, we used P2 mouse brain from ENCODE. The iCLIP data in mouse brain was produced from total mouse brain, so we pooled the RNaseq of forebrain, midbrain and hindbrain, accession numbers ENCSR723SZV, ENCSR255SDF and ENCSR749BAG (Sloan et al., 2016).
Analysis of PTBP1 binding peaks
PTBP1 iCLIP libraries were pooled, and binding peaks were identified with the iCount suite using randomization based FDR estimates at peak sizes of 3, 15 and 75 nt. cDNA counts in each cluster were normalized and transformed to moderated log2 fold changes with DESeq2, comparing the cDNA count in MATR3-depleted against control samples. We excluded peaks with less than 8 cDNA counts based on inspection of the variability in log2 fold changes of such binding peaks (seeFigure 2B).
Nucleo-cytoplasmic fractionation for RNA isolation
at 5x 30 s pulses in a BioRuptor waterbath device. RNA was isolated using Trizol LS (Invitrogen) and Zymo RNA isolation columns (Zymogen) according to manufacturer’s recommendations. For preparation of RNA for RNaseq, an additional wash step with 180ml NP40E-CSK was done before nuclei rupture.
Generation of RNaseq libraries
Before library preparation, purified RNA was DNase I treated for a second time and purified with the DNA-free kit (Ambion). To generate stranded RNaseq libraries, we used the TruSeq stranded RNaseq library kit (Illumina) according to manufacturer’s recom-mendations; RNA was depleted of rRNA using the RiboZero kit (Epicenter). All libraries were sequenced on Illumina HiSeq2 machines in a single-end manner with a read length of 100 nt.
Mapping of RNaseq with TopHat2
Before mapping the reads, adaptor sequences were removed using the FASTX toolkit version 0.7 and we discarded reads shorter than 24 nucleotides. Reads were then mapped with TopHat v2.0.5 (Kim et al., 2013) to UCSC hg19/GRCh37 genome assembly using ENSEMBL version 72 gene annotation as reference, allowing up to two mismatches and only using uniquely mapping hits. RNaseq data files of rRNA depleted cytoplasmic and nuclear RNA from cells depleted of MATR3 and PTBP1 are deposited on EBI ArrayExpress under the accession number E-MTAB-6204.
Generation of pAseq libraries