R E S E A R C H
Open Access
An inference method from multi-layered
structure of biomedical data
Myungjun Kim, Yonghyun Nam and Hyunjung Shin
*FromThe 6th Translational Bioinformatics Conference Je Ju Island, Korea. 15-17 October 2016
Abstract
Background:Biological system is a multi-layered structure of omics with genome, epigenome, transcriptome, metabolome, proteome, etc., and can be further stretched to clinical/medical layers such as diseasome, drugs, and symptoms. One advantage of omics is that we can figure out an unknown component or its trait by inferring from known omics components. The component can be inferred by the ones in the same level of omics or the ones in different levels.
Methods:To implement the inference process, an algorithm that can be applied to the multi-layered complex system is required. In this study, we develop a semi-supervised learning algorithm that can be applied to the multi-layered complex system. In order to verify the validity of the inference, it was applied to the prediction problem of disease co-occurrence with a two-layered network composed of symptom-layer and disease-layer. Results:The symptom-disease layered network obtained a fairly high value of AUC, 0.74, which is regarded as noticeable improvement when comparing 0.59 AUC of single-layered disease network. If further stretched to whole layered structure of omics, the proposed method is expected to produce more promising results.
Conclusion:This research has novelty in that it is a new integrative algorithm that incorporates the vertical structure of omics data, on contrary to other existing methods that integrate the data in parallel fashion. The results can provide enhanced guideline for disease co-occurrence prediction, thereby serve as a valuable tool for inference process of multi-layered biological system.
Keywords:Integrative inference on biomedical data, Semi-supervised learning, Semi-supervised learning for multiple networks, Symptom-disease multi-layered network, Disease co-occurrence prediction
Background
Omics is a comprehensive study of a specific layer in a cellular system [1] and the molecular components in each layer constitute the biological system. These layers include genome, epigenome, transcriptome, metabo-lome, proteome, etc., and can further be extended to clinical/medical layers such as diseasome, drugs, and symptoms. There exist complex interactions between each layers, such as translation, transcription, and reac-tions, and such interactions allow us to view biological system as a multi-layered structure of omics. In recent
years, there has been great advances in high throughput experimental techniques and brought influx of omics data including DNA sequence data, mRNA, miRNA, methylation patterns, etc [2]. While there had been many works concerning single layer of omics data, complex interactions between different layers hinder one from capturing comprehensive information on total system. Therefore, comprehensive analysis of multiple omics is required for more profound understanding of the total biological system [3]. One integrative approach for multiple levels of information that is receiving much attention is network-based or graph-based approach. A network or a graph concerning omics data consists of nodes and edges, where nodes represent biological com-ponents, such as genes or diseases, and edges represent
* Correspondence:[email protected]
Department of Industrial Engineering, Ajou University, 206 Worldcup-ro, Yeongtong-gu, Suwon 16499, South Korea
relationships or interactions among them [4]. The main reason for the popularity of network-based analysis of biological system lies on the fact that the network struc-ture can capstruc-tures associations of biological components while managing large amount of data [5]. The network can vary from gene co-expression networks [6–9], pro-tein networks [10–13], metabolic networks [14, 15], disease networks [16, 17], and many more, for single layered networks while multi-layered networks can be created by connecting the layers using data that reflects interactions between different layers [18].
Given a multi-layered network, one can extend the usage of such networks by implementing prediction process for finding traits (or labels) of interest with ma-chine learning algorithms. While many traits have been discovered in numerous studies, there still remain a large room for finding more unknown traits of biological com-ponents. Instead of leaving unknown components in dark space, one can utilize both known and unknown compo-nents with semi-supervised learning. Semi-supervised learning (SSL), in general, deals with both labeled and unlabeled data where labeled data are given scarcely com-pared to vast amount of unlabeled data, and obtaining labels for unknown traits is costly. In this sense, SSL can serve as a cost-effective tool for prediction process [19]. For SSL in network setting [20–24], the key idea is the
‘label propagation’ [25] where known labels propagate to neighboring unlabeled data points through edges. Through label propagation and basic kernel of graphs using graph Laplacian [26], we obtain predictive values for unlabeled data, which we can utilize for prediction process for networks of biological systems.
In past works, there have been extensive studies in-corporating SSL for various omics data. In [27–29] graph integration method, consisting of finding convex combination of graph Laplacians, is applied to four dif-ferent types of yeast protein networks along with SSL to predict protein functions and also extends to protein function prediction by incorporating deletion process of noisy connections [30]. For more practical purpose on clinical data, [31–33] applies graph integration methods on multiple graphs from CNA, methylation, miRNA, and gene expression along with SSL to predict clinical outcomes of cancer. In [34], SSL schemes are applied to predict disease genes from protein-protein interaction network, constructed with multiple proteomics and genomic data. In [35], SSL was applied to predict syn-thetic genetic interactions from integrated network of protein-protein interaction, protein complex, and gene expression data. For inter-layer relationships, [36] pro-vides algorithms for reconstructing intra-layer relations by utilizing SSL and inter-layer relations between differ-ent levels of genomic data. In [37], the authors provides miRNA-disease associations by utilizing SSL algorithm.
In [38], SSL was applied to for disease comorbidity scoring for complemented disease network of metabolic disease group.
Most of the above works, however, only consider inte-grating multiple sources of data in parallel fashion, ig-noring hierarchical, or vertical structure of multi-omics data. Furthermore, only few machine learning algo-rithms, including SSL, deals with networks of vertical structure. The purpose of the paper is to develop a semi-supervised learning algorithm for multiple layered networks that utilize matrix separation and graph inte-gration method in vertical fashion. For biological sys-tems, however, vast number of components in each layers and countless unknown relations between differ-ent layers cause issues of computational complexity and sparseness for analyzing with multi-layered networks. To alleviate the problems, we propose an efficient matrix inversion algorithm composed with Nyström method [39] and Woodbury formula [40]. The remainder of the paper is organized as the following. In Methods, we discuss graph based semi-supervised learning for multiple-layered networks. In Experiments and Results and Discussion, we present experimental results of the proposed algorithm that was applied to disease co-occurrence prediction problem on two layered net-work of symptom and disease.
Methods
Graph based semi-supervised learning
In graph based semi-supervised learning, a set of data can be represented by a graphG(V, E) which consists of nodes (V) and edges (E). Given a graphG(V, E) forndata points, nodes represent data points withV= {x1,x2,…,xn_tween dats
epre-setn}. and edges represent similarities between data points. The similarities are given by the weight matrixW, where ele-ments,Wij, ofWrepresent strength of connection between
nodesxiandxj. The problem of semi-supervised learning on
graphG(V, E) deals with labeled and unlabeled nodes where labeling is given byY= {Yl,Yu} withYl∈{−1, 1} for labeled
nodes and Yu= 0 for unlabeled nodes. Through learning
process, we determine the output vector f= (f1,f2, …, fn) T
using available information and minimizing the following quadratic cost functional [41]:
minimize f
Xn
i
fi−Yi
ð Þ2þμXn i;j
Wij fi−fj
2
: ð1Þ
By the symmetry of the weight matrix, problem (1) can be translated into
minimize f ðf−YÞ
T
f−Y
ð Þ þμfTLf; ð2Þ
loss term for consistency with initial labeling, the second term is the smoothness term for consistency with geom-etry of the data, and μ is a parameter for trade-off between the loss term and the smoothness term [41]. The solution to minimization problem (2) is given by:
f ¼ðIþμLÞ−1Y; ð3Þ
where I is the identity matrix.
Semi-supervised learning for multi-layered biomedical data
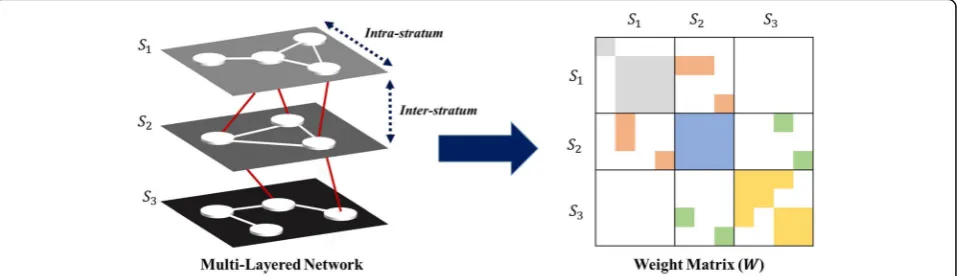
For multi-layered biomedical data, it can be represented by multi-layered graph, G(V, E, S), which consists of nodes (V), edges (E), and strata (S). In addition to nodes and edges, strata in G(V, E, S) denote K distinct layers with S= {S1, S2, …, SK}. Each G(V, E, S) contains
intra-and inter-layer relations, where the former characterize relations between two nodes in same layer and the latter characterize relations between two nodes each of which belongs to different adjacent layer. Given a graphG(V, E, S) with K number of layers andnk data points for each
layerk, the weight matrixWis aN×N, where N=n1+ n2+…+nK, block tri-diagonal matrix with 3K−2
non-zero blocks. K symmetric diagonal blocks represent intra-layer relations and 2K−2 rectangular banded diag-onal blocks represent inter-layer relations. Figure 1 de-picts a multi-layered graph for three layers with structure of its corresponding weight matrix. An exemplary network would be a multi-layered network with S1, S2, and S3as symptoms, diseases, and proteins, respectively, in the context of disease co-occurrence prediction. To incorpor-ate graph based semi-supervised learning into multi-layered omics systems, we first apply matrix separation on the weight matrix, W, then implement graph integration method [28].
First, matrix separation is a representation of a block matrix with summation of its sub-matrices of same di-mension with associated blocks. For the weight matrix
W in a multi-layered graph, let WfSp;Sqg be a matrix
that only contains a sub-block of W associated with stratum SpandSq, masking other blocks to zeros. Then,
we have
W¼ X
K
Sp;Sq
WfSp;Sqg; ð4Þ
where Sp=Sq denotes a sub-matrix for intra-layer
rela-tion of Sp (or Sq) and Sp≠Sq denotes a sub-matrix for
inter-stratum relation of two different strata, Spand Sq.
Since effects of label propagation can be different for intra-layer and inter-layer connections, we want to look at them separately. Using (4), we have
W¼ X
K
Sp;Sq
WfSp;Sqg
¼ XK
Sp¼Sq
WfSp;Sqg þ X
K
Sp≠Sq
WfSp;Sqg≡Wfintrag
þWfinterg;
ð5Þ
where W{intra} consists of K diagonal blocks of intra-layer relations and W{inter} consists of 2K−2 banded diagonal blocks of inter-layer relations. By accounting for different parameters μa(≥0) and μb(≥0) for W{intra} andW{inter}, respectively, the formalization (1) becomes
minimize f
Xn
i
fi−Yi
ð Þ2þμ a
Xn
i;j
Wfijintrag fi−fj
2
þμb Xn
i;j
Wfijinterg fi−fj
2
:
ð6Þ
Since W{intra} and W{inter} themselves are weight matrices, each has graph Laplacian denoted as L{intra}
and L{inter}, respectively. This implies that we can translate problem (5) into
minimize
f ðf−YÞ
T
f−Y
ð Þ þfTμaLfintragþμbLfintergf: ð7Þ
As sum of positive semidefinite matrices is still posi-tive semidefinite, μaL{intra}+μbL{inter}sis positive
semide-finite. This means that the optimization problem (6) is a convex problem, where the solution is given as
f ¼IþμaLfintragþμbLfinterg−1Y: ð8Þ
Note that whenμb= 0, (7) reduces to (3).
Revised matrix inversion method for multi-layered biomedical data
In eq. (7), the matrix inversion requiresO(N3) computa-tional complexity for N number of data. For multi-layered structure of omics, the size of data can be tremendous which implies expensive computation for (7). To overcome such difficulty, various inversion algo-rithms for block tri-diagonal matrices, such in [42–45], can be considered. These algorithms, however, require square banded diagonal blocks which is not applicable since non-zero blocks in WfSp;Sqg can be rectangular
because of difference in sizes of different omics (np≠nq).
In addition, sparseness of multi-layered structure of omics and the block tri-diagonal matrix can lead to inef-ficiency in matrix inversion involved in (7).
Revised matrix inversion method involves combination of Nyström method [39] and Woodbury formula [40]. The idea is to apply low rank approximation to L{inter}
with Nyström method and utilize Woodbury formula to obtain the solution to problem (6). First, let us look at Nyström method and Woodbury formula.
[Nyström method] Nyström method is a low rank approximation of a positive semidefinite matrix from a subset of its columns. Given a positive semidefinite matrix
H of sizen, randomly sample r≪n columns, namely C. By definingQas the intersection ofCand its correspond-ing rows inH, Nyström approximationĤ, is given by
H≈H^ ¼CQþCT; ð9Þ
where Q+ is the pseudo-inverse of Q with rank of Ĥ equal tor.
[Woodbury formula] Woodbury formula matrix is in-version identity for sum of two matrices. Suppose A is an n×n invertible matrix,B is ar×r (r not necessarily equal to n) invertible matrix, U is a n×r matrix. Sup-pose furthermore that B−1+UTA−1Uis invertible. Then,
AþUBUT
−1¼
A−1−A−1U B −1þUTA−1U−1UTA−1: ð10Þ
Woodbury formula is useful when computational cost of obtainingA−1is cheap and the total matrix has sparse structure [43].
In eq. (7), L{inter} is a positive semidefinite matrix by the property of graph Laplacian [26], and thus applicable for Nyström method. By applying Nyström method to
L{inter}, we obtain
LðinterÞ≈CQþCT; ð11Þ
whereCis an×r(r≪n) matrix andQ+is ar×rmatrix. Substituting the result to eq. (7) yields
f ¼IþμaLfintragþμbCQþCT−1Y: ð12Þ
To use Woodbury formula, let A= I+μaL{intra}, and
B=μbQ+, By Woodbury formula, we have the final
solution to problem (6) in the form
f ¼A−1Y−A−1C B −1þCTA−1C−1CTA−1Y−1: ð13Þ
Overview of the proposed method
The justification for using the proposed method starts with observing Woodbury formula used for matrix inversion in (11). From (11), we see that the matrix A, defined as I+μaL{intra}, is a block diagonal matrix and
that the total matrix has sparse structure arising from the property of block tri-diagonal matrix. Since obtain-ing the inverse of block diagonal matrix is cheap and the total matrix is sparse, we can infer from [43] that Woodbury formula is an effective approach for obtaining the inverse in eq. (11). The complexity for Woodbury formula (in fact the overall complexity) is given by
O ðmax fn1; n2;…;nKgÞ3þrN2
; ð14Þ
wherenkdenotes size of stratumSkandr≪N.
In regards to Nyström method, a natural question could be brought upon selection of L{inter} for low-rank approximation. It is true that we could apply Nyström method on μaL{intra}+μbL{inter} as the sum of positive
semi-definite matrices is still positive semidefinite. This approach, however, could lead to loss of structure and properties of each layer since we are approximating the graph Laplacian with randomly sampled columns. By selecting only L{inter} for Nyström method, we prevent from such loss. In addition, in contrast to various inver-sion algorithms for block tri-diagonal matrices, Nyström method is utilization of rectangular banded diagonal blocks combined with property of the graph Laplacian.
Finally, with respect to integrative analysis of multi-omics data, the overall complexity (13) is reduced from
Experiments
Data
To validate the performance of the proposed method, we compared the performance of the multi-layered network with the proposed method to that of the non-hierarchical single layered network with ordinary semi-supervised learning scheme. For problem setting, we applied it to disease co-occurrence prediction problem on two-layered network consisting of symptom-layer and disease-layer. Disease co-occurrence prediction has importance for treatment and prevention, in practice [46]. For example, examining disease co-occurrence of cancer, which has high disease co-occurrence rate, can serve as a crucial prognostic factor for patients with cancer [47] and has direct influence on treatment of patients [48]. Therefore, disease co-occurrence had been studied but only on single layer of omics [38]. In our study, we employ the fact that knowing common symp-toms of two diseases can aid disease co-occurrence prediction. For instance, knowing that a patient has coughing can lead to a diagnosis of both flu and pneu-monia, which are co-occurring diseases.
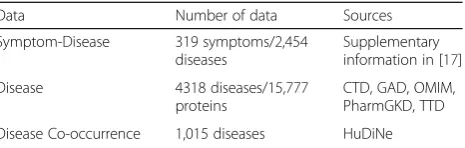
To construct the multi-layered network of symptoms and diseases, a list of disease and symptoms was obtained from Medical Subject Headings (MeSH) of the National Library of Medicine [49], yielding 4,318 diseases and 322 symptoms. For disease co-occurrence information, we collected the data from HuDiNe [50], which contained information for 1,015 diseases, out of 4,318 diseases. The obtained diseases were selected as nodes for disease-layer and 319 symptoms, out of 322 symptoms, with symptom-disease information from [17] were selected as nodes for symptom-layer. For intra-layer relations of diseases,W{Disease}, we utilized similar-ity between diseases in terms of shared proteins (out of 15,777 proteins). For similarity measurement, we used Tanimoto kernel [51] which is given as
Wij¼
xi⋅xj
xi
k k2þ
xj 2
−xi⋅xj
; ð15Þ
wherexiandxjare given as bit vectors. For intra-stratum
relations of symptoms, W{Symptom}, we utilized similarity between symptoms in terms of disease accompanying the symptoms. Tanimoto kernel was also used as similarity measurement for symptom relations. For inter-layer relations of symptom and disease, we used the symptom-disease data and binary weight where Wij{inter}= 1, if
co-occurrence is present, and Wij{inter}= 0, otherwise, for i∈
Disease, andj∈Symptom. Table1summarizes the data.
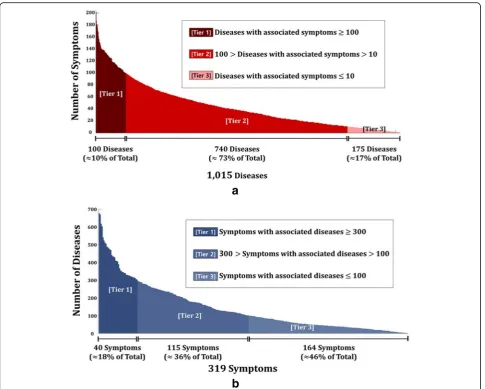
Figure 2a shows the number of associated symptoms for a particular disease. Out of 1,015 diseases, brain neo-plasm has the most number of associated symptoms with 202 records, followed by HIV infections, Lewy body
disease, and cerebral hemorrhage. About 10% of diseases have 100 or more associated symptoms, about 73% have associated symptoms in between 100 and 10, and about 17% have less than or equal to 10 associated symptoms. Similarly, Fig. 2b show the number of associated diseases for a particular symptom. Out of 319 symptoms, pain is the most common symptom among diseases (677 dis-eases), followed by fever, change in body weight, and edema. About 18% of symptoms have 300 or more asso-ciated diseases, about 36% have assoasso-ciated diseases in between 300 and 100, and about 46% have less than or equal to 100 associated diseases.
Experimental setting
For disease co-occurrence prediction problem, we em-ploy the disease scoring setting, as in [38], where the semi-supervised learning algorithm provides the scores for disease. With the two-layered network of symptom and diseases, we first selected a target disease and gave label ‘1’to target disease, indicating the presence of dis-eases. For other unlabeled diseases, we gave label ‘0’s. Then, we randomly gave label ‘1’s to 0 ~ 100% on 20% interval to related symptoms and gave ‘0’s to unrelated symptoms. The 0% of labeled symptoms represent the reference network, or the single disease network. We as-sume that we know 20% of co-occurring diseases in a priori, and therefore we randomly set and assign 20% of co-occurring diseases with label ‘1’s. Note that we can change the percentages but the effect is similar for both single-layered network and multi-layered network. The parameters, μa and μb were determined in the range
{0.01,…, 100} and the performance of two-layered net-work of symptoms and diseases was compared to that of the reference network. The performance was measured by Area Under ROC Curve (AUC) [52], which compared prediction output f= (f1,f2, …, fn)T with true labels. For
validation, Leave-One-Out method [53] was used and the experiment was repeated 10 times.
Results and Discussion
Results on validity of the proposed algorithm
The results are summarized in Fig. 3. Figure 3a illustrates AUC performance comparison in predicting disease co-occurrence for symptom-disease layered network and Table 1Data source for symptom-disease stratified network and disease co-occurrence information
Data Number of data Sources
Symptom-Disease 319 symptoms/2,454 diseases
Supplementary information in [17]
Disease 4318 diseases/15,777
proteins
Fig. 2aBar graph of the number of associated symptoms for a particular disease.bBar graph of the number of associated disease for a particular symptom
single disease network. It shows that for every increase in % of labels in symptom-layer achieves higher AUC than 0.59 of the reference network. Furthermore, it shows that increase in the number of labels for related symptoms leads to higher AUC performance. In the view of practitioner, this result suggests that knowing more symptoms disclose more information regarding characteristics of disease and its co-occurrence. Figure 3b depicts AUC for multi-layered network with 100% labeled symptoms against the reference network. If a point in scatter plot is above the diagonal line, then the multi-layered network performs better for a particular target dis-ease. From the figure, we can see that most of the points are above the diagonal line, indicating better performance of the multi-layered network over the reference network. Such results consolidate the fact that labels in symptom-layer can benefit predictions for disease co-occurrence.
Enrichment analysis: relevance of use of symptom data for disease co-occurrence
To examine relevance of use of symptoms for disease co-occurrence, we compared the difference between the average number of shared symptoms with co-occurring diseases and non-co-occurring diseases for each target disease. The main reason for such inspection is that the number of shared symptoms affect inter-layer label propa-gation in semi-supervised learning setting. If there exists a
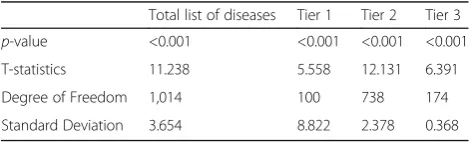
significant difference between the average number of shared symptoms with co-occurring diseases and non-co-occurring diseases for a target disease, then symptoms, in-deed, have relevance with disease co-occurrence. Figure 4 illustrates the average number of shared symptoms with co-occurring and non-co-occurring diseases, respectively, for total list of diseases and the tiers that correspond to those in Fig. 2a. For statistical evaluation, we carried out one sided t-test of difference in means for each group, where the null hypothesis is that the difference in means is zero and alternative is that the average of shared symptoms with co-occurring diseases is higher than that with non-co-occurring diseases. The results are shown in Table 2.
In Fig. 4, it shows that the average number of share symptoms is higher with co-occurring disease than that with non-co-occurring diseases for each group. It is also noticeable to see that in Table 2, the results of t-tests allow us to reject the null hypothesis for each case withp-value <0.001 and conclude the alternative. Thus, we can deduce that there exists a definite relevance be-tween shared symptoms bebe-tween diseases and disease co-occurrence.
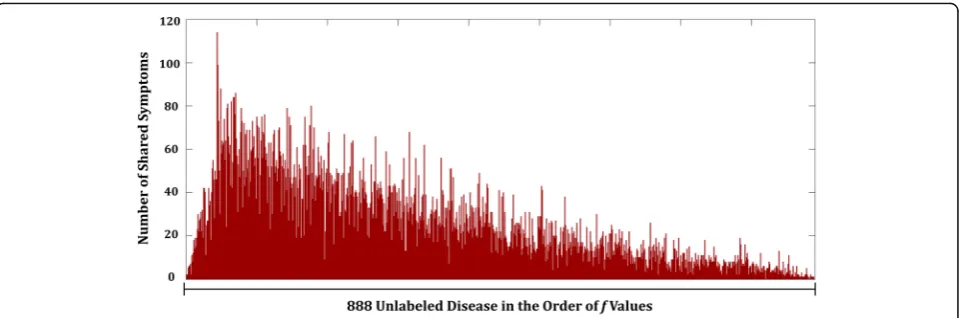
To elucidate more understanding of effects in use of symptom-layer, we selected thrombocytopenia as the tar-get disease and analyzed the distribution of the number of shared symptoms. Thrombocytopenia refers to any disorders in which there is an abnormally low amount of platelets that help blood to clot [54, 55]. Figure 5 shows the number of shared symptoms with other diseases, in the order of value of predicative output, f, in eq. (12). These values represent relative closeness to being la-beled as co-occurring disease with the target disease compared to one another. In Fig. 5, it shows that higher number of shared symptoms yields relatively higher value of predicative output of predicting disease
co-Fig. 4Comparison of the average number of shared symptoms with co-occurring diseases and with non-co-occurring diseases for total list of diseases, tier 1, tier 2, and tier 3
Table 2Results for statistical evaluation with one-sided t-test for difference in means
Total list of diseases Tier 1 Tier 2 Tier 3 p-value <0.001 <0.001 <0.001 <0.001
T-statistics 11.238 5.558 12.131 6.391
Degree of Freedom 1,014 100 738 174
occurrence. This solidifies the relevance of use of symp-toms for prediction of disease co-occurrence.
Conclusion
In this paper, we develop a graph based semi-supervised learning for prediction process in multi-layered biomedical systems. The algorithm involves matrix separation and graph integration methods but issues with computational complexity and sparseness must be solved. To resolve the issues, we devise a revised matrix inversion scheme con-sisting of Nyström method and Woodbury formula. The-oretically, the proposed method can reduce computational complexity by coping with sparseness, while preserving in-nate structure and properties of each layer.
To test the proposed algorithm, it was applied to two-layered system of symptoms and diseases to predict disease co-occurrence. The results showed improvement in prediction in terms of AUC where the performance increased from 0.59 of single disease network to 0.74 of symptom-disease network. Furthermore, it also showed relevance of use of symptoms on disease co-occurrence prediction with statistical evidence for higher average of shared symptoms with co-occurring diseases than that of non-co-occurring diseases. In theoretical perspective, although the proposed algorithm was applied on two-layered network for our experiments, it has scalability power as it is applicable to multi-layered structure with large number of biomedical data, and achieves faster in-version than normal matrix inin-version.
As an extension of the research, since disease co-occurrence prediction problem has been studied for many years, it is possible to consider comparing the proposed method with other works such as [56]. In addition, we can consider extending additional layers where the extra layers convey relevant information. In case of disease co-occurrence prediction, inclusion of additional layers of phenotype/clinical data would be beneficial as they serve as important information to
construct comorbidity map. In different perspective, we can also consider cases outside the box of the central dogma of biology, where multi-layered net-work can exist in a non-hierarchical structure.
On the other hand, the research has novelty in that it is a new integrative algorithm that incorporates vertical structure of omics data, on contrary to other existing methods that integrate the data in parallel fashion. More-over, the experiment results not only reflect the view-points of practitioners where they observe or seek for symptoms as primary diagnosis but also provide enhanced guideline for disease co-occurrence prediction, where it has importance for treatment and prevention in practice. Thus, the proposed algorithm can serve as a valuable tool for inference process of multi-layered biological system.
Acknowledgments
The authors would like to gratefully acknowledge support from the National Research Foundation of Korea (NRF) grant funded by the Korea government (MSIP) (No. 2012-0000994/2015R1A5A7037630) and the Ajou University Research Fund.
Funding
Publication of this article was funded by the National Research Foundation of Korea (NRF) grant funded by the Korea government (MSIP) (No. 2012-0000994).
Availability of data and materials
The datasets used and/or analyzed during the current study available from the corresponding author on reasonable request.
Authors’contributions
HJS designed the idea and supervised the study process. MJK and YHN analyzed the data, implemented the results and wrote the manuscript. SJS provided implications and interpretations of the results. All of the authors read and approved the final manuscript.
Competing interests
The authors declare that they have no competing interests.
Consent for publication
Not Applicable.
Ethics approval and consent to participate
About this supplement
This article has been published as part of BMC Medical Informatics and Decision Making Volume 17 Supplement 1, 2017: Selected articles from the 6th Translational Bioinformatics Conference (TBC 2016): medical informatics and decision making. The full contents of the supplement are available online at <https://bmcmedinformdecismak.biomedcentral.com/articles/ supplements/volume-17-supplement-1>.
Publisher’s Note
Springer Nature remains neutral with regard to jurisdictional claims in published maps and institutional affiliations.
Published: 18 May 2017
References
1. Ishii N, Tomita M. Multi-omics data-driven systems biology of E. coli. In: Systems biology and biotechnology of Escherichia coli. Springer Netherlands; 2009. p. 41–57.
2. Ritchie MD, Holzinger ER, Li R, Pendergrass SA, Kim D. Methods of integrating data to uncover genotype-phenotype interactions. Nat Rev Genet. 2015;16(2):85–97.
3. Bersanelli M, Mosca E, Remondini D, Giampieri E, Sala C, Castellani G, Milanesi L. Methods for the integration of multi-omics data: mathematical aspects. BMC bioinformatics. 2016;17(2):167.
4. Berger B, Peng J, Singh M. Computational solutions for omics data. Nat Rev Genet. 2013;14(5):333–46.
5. Kim S. Network based approaches to the analysis of omics data. Methods (San Diego, Calif). 2015;83:1–2.
6. Presson AP, Sobel EM, Papp JC, Suarez CJ, Whistler T, Rajeevan MS, Vernon SD, Horvath S. Integrated weighted gene co-expression network analysis with an application to chronic fatigue syndrome. BMC Syst Biol. 2008;2(1):1. 7. Stuart JM, Segal E, Koller D, Kim SK. A gene-coexpression network for global
discovery of conserved genetic modules. Science. 2003;302(5643):249–55. 8. Weirauch MT. Gene coexpression networks for the analysis of DNA
microarray data. Appl Stat Netw Biol. 2011:215–250.
9. Butte AJ, Kohane IS. Mutual information relevance networks: functional genomic clustering using pairwise entropy measurements. In: Pacific Symposium on Biocomputing. 2000;5:418-429.
10. Dreze M, Monachello D, Lurin C, Cusick ME, Hill DE, Vidal M, Braun P. High-quality binary interactome mapping. Methods Enzymol. 2010;470:281–315. 11. Rual J-F, Venkatesan K, Hao T, Hirozane-Kishikawa T, Dricot A, Li N, Berriz GF,
Gibbons FD, Dreze M, Ayivi-Guedehoussou N. Towards a proteome-scale map of the human protein–protein interaction network. Nature. 2005; 437(7062):1173–8.
12. Venkatesan K, Rual J-F, Vazquez A, Stelzl U, Lemmens I, Hirozane-Kishikawa T, Hao T, Zenkner M, Xin X, Goh K-I. An empirical framework for binary interactome mapping. Nat Methods. 2009;6(1):83–90.
13. Stelzl U, Worm U, Lalowski M, Haenig C, Brembeck FH, Goehler H, Stroedicke M, Zenkner M, Schoenherr A, Koeppen S. A human protein-protein interaction network: a resource for annotating the proteome. Cell. 2005;122(6):957–68.
14. Duarte NC, Becker SA, Jamshidi N, Thiele I, Mo ML, Vo TD, Srivas R, Palsson BØ. Global reconstruction of the human metabolic network based on genomic and bibliomic data. Proc Natl Acad Sci. 2007;104(6):1777–82. 15. Ma H, Sorokin A, Mazein A, Selkov A, Selkov E, Demin O, Goryanin I. The
Edinburgh human metabolic network reconstruction and its functional analysis. Mol Syst Biol. 2007;3(1):135.
16. Goh K-I, Cusick ME, Valle D, Childs B, Vidal M, Barabási A-L. The human disease network. Proc Natl Acad Sci. 2007;104(21):8685–90.
17. Zhou X, Menche J, Barabási A-L, Sharma A. Human symptoms–disease network. Nat Commun. 2014;5.
18. Yugi K, Kubota H, Hatano A, Kuroda S. Trans-Omics: How To Reconstruct Biochemical Networks Across Multiple‘Omic’Layers. Trends Biotechnol. 2016; 34(4):276–90.
19. Stanescu A, Caragea D. An empirical study of ensemble-based semi-supervised learning approaches for imbalanced splice site datasets. BMC Syst Biol. 2015;9(5):1.
20. Belkin M, Matveeva I, Niyogi P. Regularization and semi-supervised learning on large graphs. In: International Conference on Computational Learning Theory: 2004. Springer. p. 624–638.
21. Belkin M, Niyogi P, Sindhwani V. Manifold regularization: A geometric framework for learning from labeled and unlabeled examples. J Mach Learn Res. 2006;7(Nov):2399–434.
22. Zhou D, Bousquet O, Lal TN, Weston J, Schölkopf B. Learning with local and global consistency. Adv Neural Inf Proces Syst. 2004;16(16):321–8. 23. Zhu X, Ghahramani Z, Lafferty J. Semi-supervised learning using gaussian
fields and harmonic functions. In: Proceedings of the Twenty-first International Conference on Machine Learning (ICML). 2003;3:912–919. 24. Chapelle O, Weston J, Schölkopf B. Cluster kernels for semi-supervised
learning. In: Proceedings of the Advances in Neural Information Processing Systems 15 (NIPS). 2002;585–592.
25. Zhu X, Ghahramani Z. Learning from labeled and unlabeled data with label propagation. In: Citeseer; 2002
26. Chung FR. Spectral graph theory. Issue 92 in Regional Conference Series in Mathematics. Providence RI. American Mathematical Soc. 1997.
27. Shin H, Tsuda K, Schölkopf B. Protein functional class prediction with a combined graph. Expert Syst Appl. 2009;36(2):3284–92.
28. Shin H, Tsuda K, Schölkopf B, Zien A. Prediction of protein function from networks. In: Semi-supervised learning. MIT press; 2006. p. 361–76. 29. Tsuda K, Shin H, Schölkopf B. Fast protein classification with multiple
networks. Bioinformatics. 2005;21 suppl 2:ii59–65.
30. Shin H, Lisewski AM, Lichtarge O. Graph sharpening plus graph integration: a synergy that improves protein functional classification. Bioinformatics. 2007;23(23):3217–24.
31. Kim D, Shin H, Song YS, Kim JH. Synergistic effect of different levels of genomic data for cancer clinical outcome prediction. J Biomed Inform. 2012;45(6):1191–8.
32. Kim D, Joung J-G, Sohn K-A, Shin H, Park YR, Ritchie MD, Kim JH. Knowledge boosting: a graph-based integration approach with multi-omics data and genomic knowledge for cancer clinical outcome prediction. J Am Med Inform Assoc. 2015;22(1):109–20.
33. Kim D, Shin H, Sohn K-A, Verma A, Ritchie MD, Kim JH. Incorporating inter-relationships between different levels of genomic data into cancer clinical outcome prediction. Methods. 2014;67(3):344–53.
34. Nguyen T-P, Ho T-B. Detecting disease genes based on semi-supervised learning and protein–protein interaction networks. Artif Intell Med. 2012;54(1):63–71. 35. You Z-H, Yin Z, Han K, Huang D-S, Zhou X. A semi-supervised learning
approach to predict synthetic genetic interactions by combining functional and topological properties of functional gene network. Bmc Bioinformatics. 2010;11(1):1.
36. Kim D, Shin H, Joung J-G, Lee S-Y, Kim JH. Intra-relation reconstruction from inter-relation: miRNA to gene expression. BMC Syst Biol. 2013;7(3):1. 37. Chen X, Yan G-Y. Semi-supervised learning for potential human
microRNA-disease associations inference. Sci Rep. 2014;4:5501.
38. Nam Y, Kim M, Lee K, Shin H. CLASH: Complementary Linkage with Anchoring and Scoring for Heterogeneous biomolecular and clinical data. BMC Med Inform Decis Mak. 2016;16(3):72.
39. Williams C, Seeger M. Using the Nyström method to speed up kernel machines. In: Proceedings of the 14th annual conference on neural information processing systems: 2001. p. 682–688.
40. Woodbury MA. Inverting modified matrices. Memorandum Rep. 1950;42:106. 41. Bengio Y, Delalleau O, Le Roux N. Label propagation and quadratic criterion.
Semi-supervised Learn. 2006;10.
42. Boffi NM, Hill JC, Reuter MG. Characterizing the inverses of block tridiagonal, block Toeplitz matrices. Comput Sci Discov. 2014;8(1):015001.
43. Hager WW. Updating the inverse of a matrix. SIAM Rev. 1989;31(2):221–39. 44. Meurant G. A review on the inverse of symmetric tridiagonal and block
tridiagonal matrices. SIAM J Matrix Anal Appl. 1992;13(3):707–28. 45. Terekhov AV. A fast parallel algorithm for solving block-tridiagonal systems
of linear equations including the domain decomposition method. Parallel Comput. 2013;39(6):245–58.
46. Degenhardt L, Hall W, Lynskey M. What is comorbidity and why does it occur? Comorbid Mental disorders and substance use disorders: Epidemiology, prevention and treatment. 2003;10–25.
47. Piccirillo JF, Tierney RM, Costas I, Grove L, Spitznagel Jr EL. Prognostic importance of comorbidity in a hospital-based cancer registry. Jama. 2004; 291(20):2441–7.
48. Piccirillo JF. Importance of comorbidity in head and neck cancer. Laryngoscope. 2000;110(4):593–602.
50. HuDiNe (www.hudine.neu.edu, Acessed 17 Jan 2016)
51. Tanimoto TT. elementary mathematical theory of classification and prediction. New York; 1958.
52. Swets JA. Signal detection theory and ROC analysis in psychology and diagnostics: Collected papers. New York. Psychology Press; 2014. 53. Fukunaga K, Hummels DM. Leave-one-out procedures for nonparametric
error estimates. IEEE Trans Pattern Anal Mach Intell. 1989;11(4):421–3. 54. McDonald V, Scully M. Causes of thrombocytopenia. Medicine. 2009;3(37):
149–54.
55. Warkentin TE, Levine MN, Hirsh J, Horsewood P, Roberts RS, Gent M, Kelton JG. Heparin-induced thrombocytopenia in patients treated with low-molecular-weight heparin or unfractionated heparin. N Engl J Med. 1995; 332(20):1330–6.
56. Sun K, Gonçalves JP, Larminie C, Pržulj N. Predicting disease associations via biological network analysis. BMC bioinformatics. 2014;15(1):1.
• We accept pre-submission inquiries
• Our selector tool helps you to find the most relevant journal
• We provide round the clock customer support
• Convenient online submission
• Thorough peer review
• Inclusion in PubMed and all major indexing services • Maximum visibility for your research
Submit your manuscript at www.biomedcentral.com/submit