R E S E A R C H A R T I C L E
Open Access
Cardiac performance, biomarkers and gene
expression studies in previously sedentary men
participating in half-marathon training
Danica D Vance
1,3†, Gordon L Chen
3†, Mark Stoutenberg
2,6, Robert J Myerburg
3,4, Kevin Jacobs
2,
Lubov Nathanson
1, Arlette Perry
2, David Seo
1,5, Pascal J Goldschmidt-Clermont
1,3and Evadnie Rampersaud
1,5*Abstract
Background:The mechanisms through which exercise reduces cardiovascular disease are not fully understood. We used echocardiograms, cardiac biomarkers and gene expression to investigate cardiovascular effects associated with exercise training.
Methods:Nineteen sedentary men (22–37 years) completed a 17-week half-marathon training program. Serial measurements of resting heart rate, blood pressure, maximum oxygen consumption, lipids, C-reactive protein, cardiac troponin T, echocardiograms and blood for gene expression were obtained from baseline to peak training. Controls included 22 sedentary men who did not exercise.
Results:Among the training group, VO2max increased from 37.1 to 42.0 ml/kg/min (p < 0.001). Significant changes
were seen in left ventricular wall thickness and mass, stroke volume, resting heart rate and blood pressure (p < 0.001). The control group demonstrated no significant changes. Expression profiling in the training group identified 10 significantly over-expressed and 53 significantly under-expressed loci involved in inflammatory pathways. Dividing the training group into high and low responders based on percent change in VO2max identified loci that
differentiated these two groups at baseline and after training.
Conclusion:Intensive exercise training leads to significant increase in cardiac and hemodynamic performance, and significant changes in expression of genes involved in immune and inflammatory response.
Keywords:Gene expression, Exercise, Cardiovascular, Response
Background
Long-term exercise training has been associated with weight loss, improvements in lipid profile and blood pressure, and cardiac remodeling [1-3]. Despite this, the cardiovascular response to high-intensity training in previ-ously untrained individuals is not well characterized. Im-portantly, even with extreme marathon and half-marathon (HM) exercise training, individuals may experience vary-ing levels of cardiovascular and physiological changes, and these differences may have a biological basis. For example,
HM and marathon training have been associated with increases in oxidative stress and myocardial damage [4-9]. HM and marathon training also induces the re-lease of troponin I and T, markers of myocardial injury; elevations in cardiac troponin T (cTnT) are reported in up to 39-56% of athletes immediately after performance [10]. Although the mechanism and implications are not well defined, these biomarkers usually return to normal within 24 to 48 hours, and the magnitude of biomarker peak is inversely related to the level of training prior to the event [10]. The purpose of our study was to assess time-related cardiovascular performance and function and corresponding gene expression changes in partici-pants undergoing HM training. Our goal is to begin to identify a genomic basis for response to exercise by
* Correspondence:[email protected]
†Equal contributors 1
John P. Hussman Institute for Human Genomics, University of Miami, Miami, FL, USA
5
Dr. John T. Macdonald Foundation Department of Human Genetics, University of Miami, Miami, FL, USA
Full list of author information is available at the end of the article
correlating specific changes in gene expression with the physiologic changes following HM training.
Methods
Apparently healthy, untrained and sedentary males (n = 47), between 18 and 45 years of age, participated in the study. Candidates were required to have engaged in less than 2 hours of aerobic training per week prior to enrollment, have an average maximum oxygen consumption (VO2max) less than 50 ml/kg/min, and not previously completed a HM. Twenty-four of the subjects, who were enrolled in a local HM Training Program, were recruited into the training group (TRAIN), and twenty-three male subjects of similar age were recruited into the control group (CON). The CON group did not participate in the training program or undergo any lifestyle modification over the 16 week duration of the study. All subjects volunteered for the study and signed informed consents. TRAIN subjects were compensated for meals, travel time, and training program fees. Exclusion criteria included smoking, known metabolic or cardiovascular conditions (diabetes or dyslipidemia), chronic inflammatory diseases, or chronic use of non-steroidal anti-inflammatory drugs. The protocol was approved by the University of Miami Institutional Review Board for human subjects research. Initial screening and evaluation included a complete medical and training history, baseline VO2 max test, resting heart rate, blood pressure, height, weight, body composition assessment, serum biomarkers, and complete echocardiographic evaluation. Body composition was as-sessed through dual-energy X-ray absorptiometry scan-ning. Blood for the lipid panels and serum biomarkers was drawn via the antecubital vein using the LeukoLock Pro-tection system and stored at −80°C for analyses with the post-training RNA samples. Lipid panels were done on fasted blood samples. TRAIN and CON subjects had heart rate, blood pressure, height, weight, and serum biomarkers repeated at 6, 11, and 16 weeks after the baseline evalu-ation. Echocardiograms, VO2max, and body fat evaluation
were recorded at baseline and 16 weeks after the baseline evaluation.
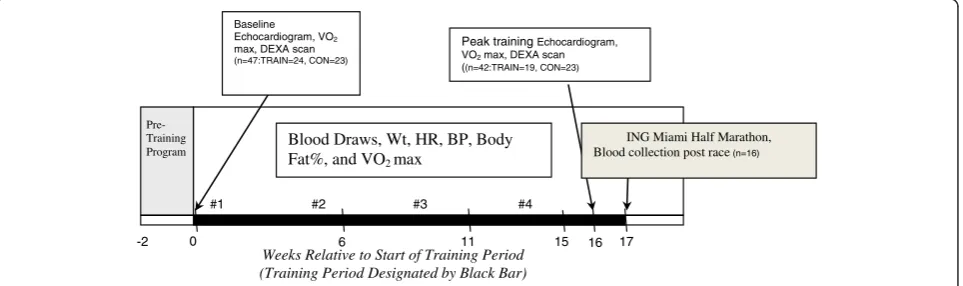
Of the 24 subjects enrolled in the TRAIN group, 5 subjects were unable to complete the training due to in-jury or time constraints and withdrew prior to the peak training data (week 16) collection. Three subjects were able to complete the peak training data collection, but were unable to complete the HM due to injury. Thus, a total of 19 subjects completed the program with peak training data collected. Of these 19 subjects, 16 subjects completed the 2007 Miami HM and had blood drawn within 30 minutes after the race (see Figure 1). Of the CON group, one individual was unable to continue the study as a result of scheduling difficulty, leaving a total of 22 controls that completed all data collection.
Two-dimensional echocardiograms with pulsed-Doppler imaging were acquired on each subject using a commer-cial system (Philips HD11). Standard measurements were performed according to the American Society of Echo-cardiography guidelines [11]. Interventricular septal wall thickness, LV internal diameter, and LV posterior wall thickness were measured in systole and diastole in the parasternal long axis view. The LV end-diastolic volume, LV end-systolic volume, stroke volume, and ejection frac-tion were calculated via modified bi-planer calculafrac-tion based on the apical 2 and 4 chamber view. LV mass was calculated using the area length method. With the pulsed-Doppler trans-mitral filling velocities (peak early [E’] and late [atrial-A’]), diastolic function was assessed and an E/A ratio was determined. One certified echocardiogram tech-nician was responsible for acquiring all images for each participant. The measurements and calculations were in-dependently confirmed by an experienced echocardiog-rapher. Both were blinded to each subject’s group status.
Blood was collected in EDTA and standard red top tubes (serum) and processed immediately. Tubes were immediately centrifuged, and the serum was separated and stored in a -80° freezer. Serum was analyzed for cTnT [12], CRP [12], and lipids (HDL, LDL, and TG) [12]. Blood
Peak training Echocardiogram, VO2max, DEXA scan
((n=42:TRAIN=19, CON=23)
Pre-Training Program
0 6 11 16 17
#1 #2 #3 #4 Blood Draws, Wt, HR, BP, Body
Fat%, and VO2max
-2
Weeks Relative to Start of Training Period (Training Period Designated by Black Bar)
Baseline Echocardiogram, VO2
max, DEXA scan
(n=47:TRAIN=24, CON=23)
ING Miami Half Marathon, Blood collection post race(n=16)
15
for RNA extraction was collected at both baseline and peak training (week 16) using the Ambion LeukoLOCK system that captured and preserved the blood mono-nuclear cell layer.
Clinical and biomarker data were analyzed using SPSS for Windows 15.0 software (SPSS, Inc, Chicago, IL). Fre-quency and descriptive statistics were calculated to check all relevant characteristics of the data. Independent samples t-tests were used to compare baseline variable differences between the TRAIN and CON groups. Paired samplest-tests were used to compare changes from base-line to peak training or basebase-line to post-HM.
Microarray analysis was performed on blood collected from each subject at baseline and at 16 weeks. Total RNA was extracted and analyzed using the Affymetrix GeneChip Human Gene ST array, which has 28,869 unique genes (or transcripts) which are captured by ~26 probes per gene. Data were normalized using Robust Multi-Array (RMA) Normalization. Significance Analysis of Microarray (SAM) Software [13] was used to deter-mine statistically significant genes that met predeter-mined False Discovery Rate (FDR) thresholds. SAM uses non-parametric statistics and gene specific t-tests to identify statistically significant genes and to measure the strength of relationships between gene expression and a specific response variable. SAM also uses permutation tests to estimate the FDR after accounting for multiple testing corrections [14]. Genes with FDRp-values < 0.15 and fold-change greater than 1.5 or less than −1.5 were considered significant. Pathway analysis was conducted using MetaCore™(GeneGo, Inc) software.
Two separate gene expression analyses were performed. The first compared differences in gene expression profiles between the CON and TRAIN subjects before and after the HM training. The second analysis focused only on the TRAIN subjects, by dividing them into high and low
responders based on the percent change of their relative
VO2 max (rVO2max) over the course of the training
program. Relative VO2max takes into account and in-dividual’s body weight and is defined as milliliters of oxygen per kilogram of bodyweight per minute. The
mean percent change in rVO2max was calculated and
individuals who fell in the upper quartile (upper 25%)
of percent change in rVO2 max were labeled as
high-responders (10 individuals) and those who fell below the upper quartile were considered low-responders (9 individuals). Gene expression differences between the two groups were studied at baseline and after the 16 weeks of training.
Results
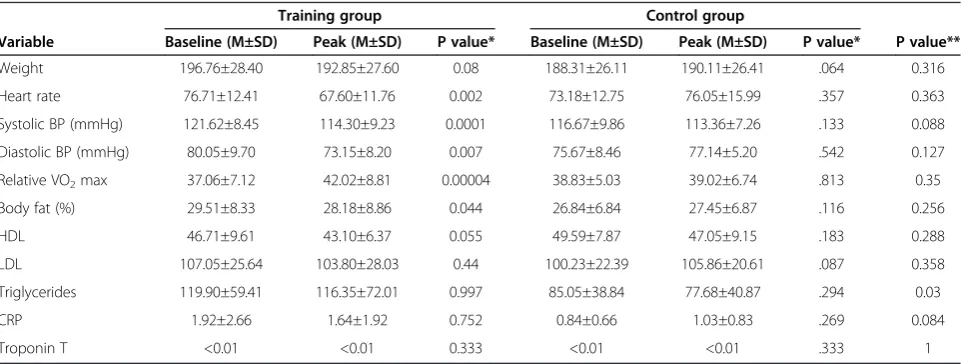
Of the 16 subjects who completed the HM, the average time to completion was 2:22:21 (H:Min:Sec), SD = 26:33. The fastest time was 1:39:00 and the slowest time was 3:11:58. No runner required medical attention after the race. There were no significant differences between the TRAIN and CON groups on any baseline characteristics other than triglycerides, which were significantly higher (p = 0.03) in the TRAIN group (Table 1).
Comparisons of basic physiological variables were made from baseline to the peak training time-point (17 weeks) in both groups (Table 1). VO2 max increased signifi-cantly (p = 0.00004) among those in the TRAIN group during the course of the training program. In addition, the following were significantly decreased: (1) resting heart rate (p = 0.002), (2) percent body fat (p = 0.044), and (3) systolic (p = 0.0001) and diastolic (p = 0.007) blood pressure. Average body weight (p = 0.08) and HDL (p = 0.055) decreased slightly (p = 0.08), but no other mea-sured biomarkers (LDL, Tg, CRP, cTnT) showed signifi-cant improvements. There were no signifisignifi-cant changes for any variables among the CON subjects (Table 1). Table 2
Table 1 Training group and control changes at baseline versus 16 weeks (n=22)
Training group Control group
Variable Baseline (M±SD) Peak (M±SD) P value* Baseline (M±SD) Peak (M±SD) P value* P value**
Weight 196.76±28.40 192.85±27.60 0.08 188.31±26.11 190.11±26.41 .064 0.316
Heart rate 76.71±12.41 67.60±11.76 0.002 73.18±12.75 76.05±15.99 .357 0.363
Systolic BP (mmHg) 121.62±8.45 114.30±9.23 0.0001 116.67±9.86 113.36±7.26 .133 0.088
Diastolic BP (mmHg) 80.05±9.70 73.15±8.20 0.007 75.67±8.46 77.14±5.20 .542 0.127
Relative VO2max 37.06±7.12 42.02±8.81 0.00004 38.83±5.03 39.02±6.74 .813 0.35
Body fat (%) 29.51±8.33 28.18±8.86 0.044 26.84±6.84 27.45±6.87 .116 0.256
HDL 46.71±9.61 43.10±6.37 0.055 49.59±7.87 47.05±9.15 .183 0.288
LDL 107.05±25.64 103.80±28.03 0.44 100.23±22.39 105.86±20.61 .087 0.358
Triglycerides 119.90±59.41 116.35±72.01 0.997 85.05±38.84 77.68±40.87 .294 0.03
CRP 1.92±2.66 1.64±1.92 0.752 0.84±0.66 1.03±0.83 .269 0.084
Troponin T <0.01 <0.01 0.333 <0.01 <0.01 .333 1
shows comparison of echocardiographic changes between TRAIN and CON groups.
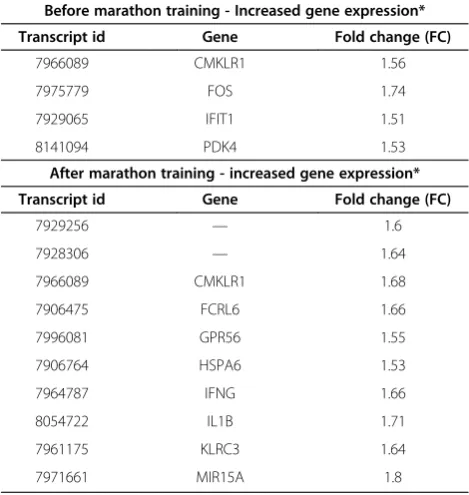
In comparing the gene expression profiles between TRAIN and CON individuals before training, only 4 genes
(CMKLR1, FOS, IFIT1, and PDK4) showed significant
changes (FC > 1.5, FDR <0.05) (See Table 3). All had
increased levels of gene expression in the TRAIN group compared to the CON group. No genes were sig-nificantly decreased.
When comparing profiles from blood collected in TRAIN and CON individuals after the HM training
pro-gram, ten genes(CMKLR1, FCRL6, GPR56, HSPA6, IFNG,
IL1B, KLRC3, MIR15A)showed significantly elevated
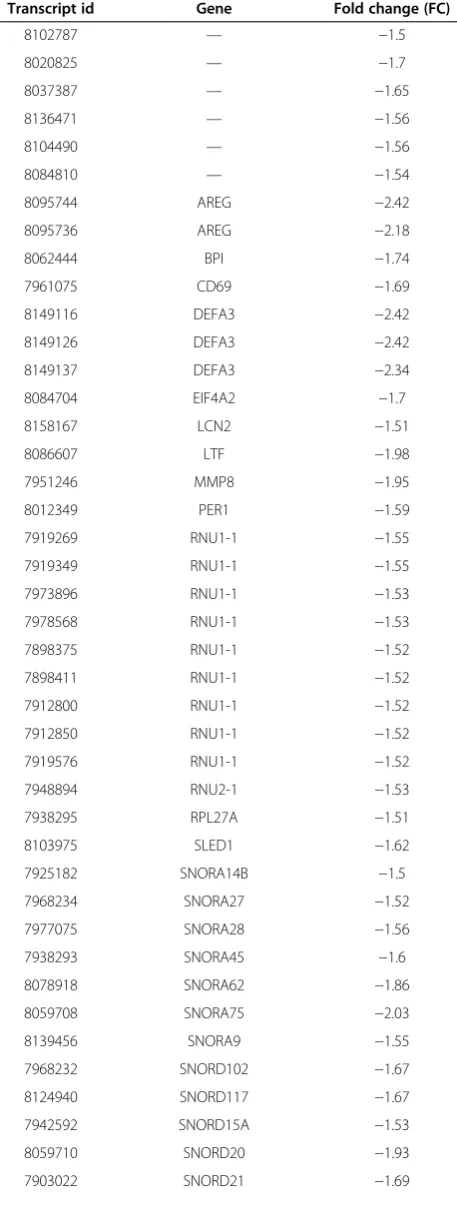
ex-pression (FC > 1.5, FDR < .05) (Table 3) and 53 genes (includingAREG,DEFA3) were found to be significantly decreased (FC <−1.5, FDR < .05) in the TRAIN group (Table 4). According to pathway analysis, the biological pathways that were significantly up-regulated in the TRAIN individuals after training (p <0.001) were those involved in inflammatory and immune response, includ-ing migration inhibitory factor (MIF) in innate immun-ity response (p = .00014), bacterial infections in normal airways (p = .0002), apoptosis and survival Nitric Oxide synthesis and signaling (p = .0002) and bacterial infec-tions in CF airways (p = .0002) (data not shown). One biological pathway, translation insulin regulation of translation (p = .00008), showed significantly decreased expression in TRAIN individuals after HM training (data not shown).
The TRAIN group was categorized into 10 high and 9 low responders based on percent change in their rVO2 max. Within the TRAIN group alone, 16 genes showed trending evidence of decreased expression (FC >−1.5, FDR < .06) in high vs. low responders, and one gene showed increased gene expression (FC > 1.5, FDR < .06) in the high compared to low responders group (Table 5). Biological processes that were highlighted included those involved in regulation of DNA transcription, translation and other metabolic processes.
Table 2 Echocardiographic changes over 16 weeks (n=19)
Training group Control group
Variable Baseline (M±SD) Peak (M±SD) P value Baseline (M±SD) Peak (M±SD) P value
Interventricular septum in diastole (cm) 0.925±0.102 1.003±0.128 0.028 0.925±0.115 0.982±0.138 0.074
Left ventricular internal diameter in diastole (cm) 4.803±0.490 4.818±0.490 0.864 4.726±0.409 4.876±0.451 0.067
Left ventricular posterior wall in diastole (cm) 0.961±0.092 1.075±0.123 0.003 0.930±0.134 0.963±0.133 0.439
Left ventricular mass (g) 186.6±37.4 209.2±30.0 0.009 183.0±31.1 192.1±32.2 0.114
Left ventricular mass index (g/m2) 91.4±16.8 102.8±12.8 0.008 90.4±15.1 94.2±14.1 0.194
Left ventricular end-diastolic volume (ml) 118.4±23.8 144.1±29.6 0.002 124.7±32.7 133.1±30.8 0.186
Left ventricular end-systolic volume (ml) 45.8±16.4 52.4±16.7 0.195 43.4±14.0 48.0±14.8 0.11
Ejection fraction (%) 61.9±7.9 63.8±7.8 0.461 65.2±6.5 64.2±6.5 0.47
Stroke volume (ml) 72.6±14.0 91.6±20.9 0.001 81.2±22.3 85.1±20.4 0.411
Peak early to late mitral annular velocities (E to A ratio) 1.59±0.37 1.38±0.40 0.03 1.67±0.43 1.70±0.48 0.766
Table1shows comparison of echocardiographic changes between TRAIN and CON groups. The following significant changes occurred in the TRAIN group: (1) interventricular septal thickness increased from 0.925±0.102 cm to 1.003±0.128 cm (p=0.028), (2) posterior wall thickness in diastole increased from
0.961±0.092 cm to 1.075±0.123 cm (p=0.003), (3) LV mass increased from 186.6±37.4 g to 209.2±30.0 g (p=0.009), (4) LV mass index increased from 91.4±16.8 g/m2 to 102.8±12.8 g/m2
(p=0.008), (5) LV end diastolic volume increased from 118.4±23.8 ml to 144.1±29.6 ml (p=0.002), (5) stroke volume increased from 72.6±14.0 ml to 91.6±20. 9ml (p=0.001), and (6) the E to A ratio decreased from 1.59±0.37 to 1.38±0.40 (p=0.03). No significant changes occurred within the control group from baseline to 16 week follow-up.
Table 3 Genes with significantly increased expression levels in active (TRAIN) vs. sedentary (CON) individuals (FDR <0.05)
Before marathon training - Increased gene expression*
Transcript id Gene Fold change (FC)
7966089 CMKLR1 1.56
7975779 FOS 1.74
7929065 IFIT1 1.51
8141094 PDK4 1.53
After marathon training - increased gene expression*
Transcript id Gene Fold change (FC)
7929256 — 1.6
7928306 — 1.64
7966089 CMKLR1 1.68
7906475 FCRL6 1.66
7996081 GPR56 1.55
7906764 HSPA6 1.53
7964787 IFNG 1.66
8054722 IL1B 1.71
7961175 KLRC3 1.64
7971661 MIR15A 1.8
Discussion
This is the first prospective study evaluating the combin-ation of changes in cardiac structure and function, periph-eral blood cell gene expression, inflammatory markers, and potential for myocardial injury associated with train-ing for, and performance of, a HM in previously sedentary Table 4 Genes with decreased expression levels in active
(TRAIN) vs. sedentary (CON) individuals
After marathon training - Decreased gene expression
Transcript id Gene Fold change (FC)
8102787 — −1.5
8020825 — −1.7
8037387 — −1.65
8136471 — −1.56
8104490 — −1.56
8084810 — −1.54
8095744 AREG −2.42
8095736 AREG −2.18
8062444 BPI −1.74
7961075 CD69 −1.69
8149116 DEFA3 −2.42
8149126 DEFA3 −2.42
8149137 DEFA3 −2.34
8084704 EIF4A2 −1.7
8158167 LCN2 −1.51
8086607 LTF −1.98
7951246 MMP8 −1.95
8012349 PER1 −1.59
7919269 RNU1-1 −1.55
7919349 RNU1-1 −1.55
7973896 RNU1-1 −1.53
7978568 RNU1-1 −1.53
7898375 RNU1-1 −1.52
7898411 RNU1-1 −1.52
7912800 RNU1-1 −1.52
7912850 RNU1-1 −1.52
7919576 RNU1-1 −1.52
7948894 RNU2-1 −1.53
7938295 RPL27A −1.51
8103975 SLED1 −1.62
7925182 SNORA14B −1.5
7968234 SNORA27 −1.52
7977075 SNORA28 −1.56
7938293 SNORA45 −1.6
8078918 SNORA62 −1.86
8059708 SNORA75 −2.03
8139456 SNORA9 −1.55
7968232 SNORD102 −1.67
8124940 SNORD117 −1.67
7942592 SNORD15A −1.53
8059710 SNORD20 −1.93
7903022 SNORD21 −1.69
Table 4 Genes with decreased expression levels in active (TRAIN) vs. sedentary (CON) individuals(Continued)
8159004 SNORD24 −1.83
7948906 SNORD27 −1.69
7948904 SNORD28 −1.51
7948900 SNORD30 −1.8
8030364 SNORD34 −1.64
8159006 SNORD36B −1.78
8005951 SNORD42B −1.63
8005957 SNORD4B −1.63
8023259 SNORD58A −1.64
7964246 SNORD59B −1.56
8122265 TNFAIP3 −1.61
Table 5 Genes with significant expression in high responders*(n=10) vs. low responders** (n=9)
After marathon training - Decreased gene expression
Transcript id Gene Fold change (FC)
7969794 LOC100132099 −1.58
8049530 LRRFIP1 −1.58
7919269 RNU1-1 −1.89
7919349 RNU1-1 −1.89
7898375 RNU1-1 −1.86
7898411 RNU1-1 −1.86
7912800 RNU1-1 −1.86
7912850 RNU1-1 −1.86
7919576 RNU1-1 −1.86
7973896 RNU1-1 −1.85
7978568 RNU1-1 −1.85
7897801 RNU5E −1.89
7920873 SNORA42 −3.49
8117018 — −1.86
7932635 — −1.63
7965150 — −1.62
After marathon training - increased gene expression
Transcript id Gene Fold change (FC)
8005225 LOC162632 2.35
No genes met FDR significance criteria for differential mRNA expression in blood collected at baseline.
*High Responders are defined as those individuals who fell in the upper quartile (upper 25%) of percent change in rVO2max.
subjects. The decreases in blood pressure, resting heart rate, and body fat percentage, and the increases in VO2 max, observed in our TRAIN group over the course of the program are consistent with previously well-documented responses to exercise training [15,16] and validate the training effect in our HM participants. More interesting is the effect of HM training on biomarkers related to myocardial injury, cardiovascular structural changes by echocardiogram, serum lipids, gene expression and serum inflammatory markers.
In our study, LV mass and wall thickness, and LV end-diastolic and stroke volumes increased significantly after 16 weeks of training. The E to A ratio also de-creased throughout training, consistent with a decrease in diastolic relaxation commonly seen in hypertrophied ventricles. These echocardiographic changes have been well-established and recently described to occur in en-durance athletes in as little as 90 days [17-19]. This phenomenon, known as the“athlete’s heart,”is thought to be due to a long-sustained high cardiac output resulting in a volume-loaded heart that can lead to an increase in LV cavity, LV mass, and wall thickness [20-22].
Both TRAIN and CON groups had the same inclusion criteria, which enabled us to maximize the comparison after training. When comparing gene expression profiles in blood collected before training in TRAIN versus CON men, 4 genes showed significant changes in gene expression (FC = (1.5-1.7) FDR < .05) suggesting that the two groups were fairly similar before training. Through pathway analysis, the biological pathways that were significantly up regulated in the TRAIN individuals after training were those primarily involved in the body’s inflammatory and immune response. In looking at the specific genes involved of the 53 genes that showed sig-nificantly decreased expression in TRAIN individuals after training, Amphiregulin (AREG) was most significantly decreased (FC =−2.42). The protein coded byAREGis a
member of the epidermal growth factor family. AREG
has both growth factor and inhibitory properties (NCBI,
PubMed Gene ID:374). Changes inAREGexpression in
human neutrophils have been related to exercise in pre-vious studies. For example, following 30 minutes of aer-obic exercise, AREGwas shown to increase by 3.4 fold [23]. Although the change is in the opposite direction of the change found in the current study this could be due to the fact that Radom-Aizik et al. [23] examined gene expression changes following acute exercise, whereas our focus is on gene expression changes due to long term, consistent exercise.
Another gene significantly down-regulated in the TRAIN individuals; defensin, alpha 3, neutrophil-specific (DEFA3) also has a role in both the immune and inflammatory response (NCBI, PubMed Gene ID: 1668). A previous study linked increased expression ofDEFA3at both the
mRNA and protein level to inflammatory diseases [24]. It is well established that regular exercise helps reduce the amount of total body inflammation and therefore helps prevent the induction of many chronic inflamma-tory diseases including atherosclerosis. A decrease in total body inflammation is usually associated with a de-crease in C-reactive protein, which was not observed in our study. This data suggests that perhaps gene expres-sion changes associated with a decrease in inflammation occur prior to changes in cardiac biomarkers or that subjects with normal CRP at baseline are less likely to show a measurable response to exercise associated with changes in gene expression. Perhaps with longer train-ing, or elevated baseline levels of CPR, similar changes in the cardiac biomarkers would also be seen.
When comparing the TRAIN high responders and low responders, several gene expression differences were noted. Two genes that showed increased expression in high re-sponders before training includedFGFBP2(FC = 1.76) and
CD160(FC = 1.55). Both are involved in immune response
(NCBI, PubMED Gene ID: 11126).
Of the genes that showed decreased expression in high responders after exercise of particular note is LRRFIP1 (FC =−1.57). LRRFIP1 has been identified as having a role as both a regulator of toll-like receptor pathway sig-naling and transcriptional repression. Its expression has been previously shown to be induced by nicotine and proinflammatory cytokines [25].
Conclusions
In summary, in previously sedentary individuals, intensive training for a HM over 17 weeks leads to increased cardiac and hemodynamic performance that is not associated with longitudinal changes in known cardiac biomarkers. Elevated cTnT occurred in only 1 of 16 subjects who completed the HM. Training is also associated with changes in blood gene expression that reflects the anabolic state of the body, as well as changes in the body’s immune and inflammatory response that could be more sensitive precursors to changes in serum biomarkers. Whereas some genes involved in the immune/inflammatory re-sponse showed increased expression, others showed de-creased expression implying that exercise brings about changes that both suppress aspects of the immune sys-tem while stimulating others. Genes with changes in gene expression as response to HM-training include
AREG, DEFA3, CD160, GPR56, KLRC3, and LRRFIP1.
responding to intensive exercise training, which bear examination in other data sets.
Competing interests
The authors declare that they have no competing interests.
Authors’contributions
DDV: study design, RNA extraction, gene expression and pathway analysis, manuscript preparation. GC: echocardiogram data collection, cardiac biomarker analysis, manuscript preparation. MS: ascertainment, data collection. RJM: study design, cardiac biomarker analysis, manuscript editing. KJ: ascertainment, data collection. LN: microarray and gene expression analysis. AP: data collection, study design, editing. DS: study design, gene expression analysis, manuscript editing. PJGC: study design, manuscript editing. ER statistical analysis, gene expression and pathway analysis, manuscript editing. All authors read and approved the final manuscript.
Acknowledgements
The authors wish to thank Dr. Martin Bilsker, Director of the
Echocardiography lab in Jackson Memorial Hospital, Miami, FL, for reading the echocardiograms in this study. Also special thanks to Diego Duque and Philips for the use of their Philips HD 11 Digital Ultrasound Machine. Thanks to the laboratory and analytical staff of the Hussman Institute for Human Genomics for their support in particular Dr. Demet Tekin. Dr. Myerburg is supported in part by a grant from the Fondation Leducq, Paris, France (Trans-Atlantic Network of Excellence“Alliance Against Sudden Cardiac Death”). Research conducted in this paper was funded in part by funds from Florida’s Office of Tourism, Trade, and Economic Development.
Author details
1John P. Hussman Institute for Human Genomics, University of Miami, Miami,
FL, USA.2Department of Kinesiology and Sports Science, University of Miami,
Miami, FL, USA.3Department of Medicine, Miller School of Medicine,
University of Miami, Miami, FL, USA.4Department of Physiology, Miller School of Medicine, University of Miami, Miami, FL, USA.5Dr. John T. Macdonald
Foundation Department of Human Genetics, University of Miami, Miami, FL, USA.6Department of Epidemiology & Public Health, Miller School of
Medicine, University of Miami, Miami, FL, USA.
Received: 1 April 2013 Accepted: 6 February 2014 Published: 19 February 2014
References
1. Bernadet P:Benefits of physical activity in the prevention of cardiovascular diseases.J Cardiovasc Pharmacol1995,25(Suppl 1):S3–S8. 2. Giannuzzi P, Mezzani A, Saner H, Bjornstad H, Fioretti P, Mendes M,
Cohen-Solal A, Dugmore L, Hambrecht R, Hellemans I, McGee H, Perk J, Vanhees L, Veress G, Working Group on Cardiac Rehabilitation and Exercise Physiology. European Society of Cardiology:Physical activity for primary and second-ary prevention. Position paper of the Working Group on Cardiac Re-habilitation and Exercise Physiology of the European Society of Cardiology.Eur J Cardiovasc Prev Rehabil2003,10:319–327.
3. Physical activity and cardiovascular health. NIH consensus development panel on physical activity and cardiovascular health.JAMA1996,
276:241–246. http://jama.jamanetwork.com/article.aspx?articleid=405583. 4. Siegel AJ, Lewandrowski EL, Chun KY, Sholar MB, Fischman AJ,
Lewandrowski KB:Changes in cardiac markers including B-natriuretic peptide in runners after the Boston marathon.Am J Cardiol2001,
88:920–923.
5. Briviba K, Watzl B, Nickel K, Kulling S, Bos K, Haertel S, Rechkemmer G, Bub A:A half-marathon and a marathon run induce oxidative DNA damage, reduce antioxidant capacity to protect DNA against damage and modify immune function in hobby runners.Redox Rep2005,10:325–331. 6. Neilan TG, Januzzi JL, Lee-Lewandrowski E, Ton-Nu TT, Yoerger DM, Jassal
DS, Lewandrowski KB, Siegel AJ, Marshall JE, Douglas PS, Lawlor D, Picard MH, Wood MJ:Myocardial injury and ventricular dysfunction related to training levels among nonelite participants in the Boston marathon.
Circulation2006,114:2325–2333.
7. Neilan TG, Yoerger DM, Douglas PS, Marshall JE, Halpern EF, Lawlor D, Picard MH, Wood MJ:Persistent and reversible cardiac dysfunction among amateur marathon runners.Eur Heart J2006,27:1079–1084.
8. Fortescue EB, Shin AY, Greenes DS, Mannix RC, Agarwal S, Feldman BJ, Shah MI, Rifai N, Landzberg MJ, Newburger JW, Almond CS:Cardiac troponin increases among runners in the Boston Marathon.Ann Emerg Med2007,
49:137–143. 143.e1.
9. Bouchard C, Sarzynski MA, Rice TK, Kraus WE, Church TS, Sung YJ, Rao DC, Rankinen T:Genomic predictors of the maximal O uptake response to standardized exercise training programs.J Appl Physiol2011,
110:1160–1170.
10. Shave R, George KP, Atkinson G, Hart E, Middleton N, Whyte G, Gaze D, Collinson PO:Exercise-induced cardiac troponin T release: a meta-analysis.Med Sci Sports Exerc2007,39:2099–2106.
11. Schiller NB, Shah PM, Crawford M, DeMaria A, Devereux R, Feigenbaum H, Gutgesell H, Reichek N, Sahn D, Schnittger I:Recommendations for quantitation of the left ventricle by two-dimensional echocardiography. American society of echocardiography committee on standards, subcommittee on quantitation of two-dimensional echocardiograms.
J Am Soc Echocardiogr1989,2:358–367.
12. Alpert JS, Thygesen K, Antman E, Bassand JP:Myocardial infarction redefined–a consensus document of the joint European society of cardiology/American college of cardiology committee for the redefinition of myocardial infarction.J Am Coll Cardiol2000,36:959–969. 13. Tusher VG, Tibshirani R, Chu G:Significance analysis of microarrays
applied to the ionizing radiation response.Proc Natl Acad Sci USA2001,
98:5116–5121.
14. Benjamini Y, Hochberg Y:Controlling the false discovery rate: a practical and powerful approach to multiple testing.Ann Stat1995,57:289–300. 15. Kelley GA, Kelley KS:Efficacy of aerobic exercise on coronary heart
disease risk factors.Prev Cardiol2008,11:71–75.
16. Kaplan NM:Non-drug treatment of hypertension.Ann Intern Med1985,
102:359–373.
17. Morganroth J, Maron BJ, Henry WL, Epstein SE:Comparative left ventricular dimensions in trained athletes.Ann Intern Med1975,82:521–524. 18. Baggish AL, Wang F, Weiner RB, Elinoff JM, Tournoux F, Boland A, Picard
MH, Hutter AM Jr, Wood MJ:Training-specific changes in cardiac structure and function: a prospective and longitudinal assessment of competitive athletes.J Appl Physiol2008,104:1121–1128.
19. Maron BJ:Structural features of the athlete heart as defined by echocardiography.J Am Coll Cardiol1986,7:190–203.
20. Khamis RY, Mayet J:Echocardiographic assessment of left ventricular hypertrophy in elite athletes.Heart2008,94:1254–1255.
21. Naylor LH, George K, O’Driscoll G, Green DJ:The athlete’s heart: a contemporary appraisal of the‘Morganroth hypothesis’.Sports Med2008,
38:69–90.
22. Mihl C, Dassen WR, Kuipers H:Cardiac remodelling: concentric versus eccentric hypertrophy in strength and endurance athletes.Neth Heart J
2008,16:129–133.
23. Radom-Aizik S, Kaminski N, Hayek S, Halkin H, Cooper DM, Ben-Dov I:Effects of exercise training on quadriceps muscle gene expression in chronic obstructive pulmonary disease.J Appl Physiol2007,102:1976–1984. 24. Froy O, Sthoeger ZM:Defensins in systemic lupus erythematosus.
Ann N Y Acad Sci2009,1173:365–369.
25. Arakawa R, Bagashev A, Song L, Maurer K, Sullivan KE:Characterization of LRRFIP1.Biochem Cell Biol2010,88:899–906.
doi:10.1186/2052-1847-6-6
Cite this article as:Vanceet al.:Cardiac performance, biomarkers and gene expression studies in previously sedentary men participating in half-marathon training.BMC Sports Science, Medicine, and Rehabilitation