Ch ang es in th e form of th e fac ial skeleto n during g r o w th:
A COMPARATIVE MORPHOMETRIC STUDY OF MODERN HUMANS AND Nean derth als
Una Strand Viôarsdôttir University College London Submitted for the degree of
ProQuest Number: U643017
All rights reserved
INFORMATION TO ALL USERS
The quality of this reproduction is dependent upon the quality of the copy submitted. In the unlikely event that the author did not send a complete manuscript and there are missing pages, these will be noted. Also, if material had to be removed,
a note will indicate the deletion.
uest.
ProQuest U643017
Published by ProQuest LLC(2016). Copyright of the Dissertation is held by the Author. All rights reserved.
This work is protected against unauthorized copying under Title 17, United States Code. Microform Edition © ProQuest LLC.
ProQuest LLC
789 East Eisenhower Parkway P.O. Box 1346
For my grandparents
Abstract
This thesis examines variation in the modern human facial skeleton from an ontogenetic perspective, to establish the extent to which different growth patterns contribute to distinct facial forms. It then compares these patterns with those of Neanderthals. The analyses are carried out using tools from Geometric Morphometries.
The thesis is divided into four sections. The first examines the nature of facial growth in one modern human population. A single allometric growth vector is found, which is stable in the absence of several commonly missing landmarks, and predictable from the morphology of limited skeletal units within the face.
The second section examines differences in facial shape between modern human populations. It finds that modern human populations can be separated based on facial shape alone, irrespective of age or sex. Additionally, some populations have distinct facial growth vectors. It concludes that population-specific facial morphologies develop through distinctions in facial shapes at birth that are further accentuated during growth, and differences in the allometric growth process.
relationship between size and shape in the growth component in the male, and/or an extension of this component in the male.
The final section examines differences between modern humans and Neanderthals. It finds Neanderthal growth to differ significantly from that of all modern human populations.
Table of Con ten ts
Ab s t r a c t 3
Ta b l e o f c o n t e n t s 5
L is t OF F ig u r e s 13
Lis t o f t a b l e s 20
Ac k n o w l e d g e m e n t s 24
Ch a p t e r 1 Ge n e r a l in t r o d u c t io n a n d l it e r a t u r e r e v ie w 26
1.1 Introduction 26
1.2 Growth of the modern human facial skeleton 27 1.2.1 The anatomy of the facial skeleton 27
1.2.11 The frontal bone 28
1.2.lia Large scale changes in the morphology of the frontal bone
during post-natal growth 29
1.2.lib Common variations in the
morphology of the frontal bone 29
1.2.lie Articulations 30
1.2.1 ii The zygomatic (malar) bones 30 1.2.1iia Large scale changes in the
morphology of the zygomatic bones
during post-natal growth 30
1.2.1 lib Common variations in the
morphology of the zygomatic bones 31
1.2.1ÜC Articulations 31
1.2.liiiThe maxillae 31
1.2.1iiia Large-scale changes in the morphology of the maxillae during
post-natal growth 32
1.2. liiib Articulations 33
1.2.1 ivThe palatine bones 33
1.2.1 iva Articulations 34
1.2.1 va Articulations 34
1.2.1viThe ethmoid bone 34
1.2.1 via Articulations 35
1.2.1 vii The lacrimal bones 35
1.2.1 Vila Articulations 35
1.2.2 Mechanisms of growth 36
1.2.21 In utero bone formation 36
1.2.2Ü Cells involved in bone formation and
resorption 38
1.2.2iii Modelling and remodelling 38 1.2.2ivMechanisms of post-natal facial growth 39 1.2.2iva Functional matrices 41 1.2.2ivb Bone deposition during growth 42 1.2.3 Post-embryonic growth of the facial skeleton 43
1.2.31 The frontal bone 43
1.2.3Ü The facial skeleton (excluding the
mandible) 45
1.3 Patterns of modern human variation 48
1.3.1 Introduction 48
1.3.2 The morphology 49
1.3.3 The molecules 53
1.4 Sexual dimorphism in the facial skeleton 54
1.4.1 Introduction 54
1.4.2 The ontogeny of sexual dimorphism in the facial
skeleton 55
1.4.21 Heterochrony 55
1.4.2ia The basic model of heterochrony 56 1.4.2ib Inherent constraints in the use of
heterochrony as a model of
ontogenetic relationships 58
1.4.2ic Further criticisms 61
adult facial forms in modern humans 63 1.4.2Ü Studies of the ontogeny of facial sexual
dimorphism 64
1.4.2iii Summary of theories on the ontogeny of
facial sexual dimorphism 68
1.5 Neanderthal morphology and development 69
1.5.1 Neanderthal morphology and theories of
morphological adaptations 69
1.5.2 The evolutionary relationship between Neanderthals
and anatomically modern humans 72
1.5.21 Introduction 72
1.5.2Ü The recent African origin model 73
1.5.2iiThe multiregional model 76
1.5.2ivThe African hybridisation and
replacement model 80
1.5.2v The assimilation model 80
1.5.3 Neanderthal facial growth and development 81
1.5.31 Introduction 81
1.5.3Ü Neanderthal pre-natal development 82 1.5.3iii Post-natal growth of the Neanderthal facial
skeleton 83
1.5.3iiia Neanderthal growth rates 83 1.5.3iiib Form changes in the Neanderthal
facial skeleton during growth 85 1.5.3iiic Possible mechanisms for the
development of Neanderthal facial
morphology 89
1.6 The structure of the present study 91
Ch a p t e r 2. Ma t e r ia l s a n d m e t h o d s 103
2.1 Materials 103
2.1.1 African Americans 103
2.1.4 Ankara Plains Indians 106
2.1.5 (West African) Ashanti 107
2.1.6 Australians 107
2.1.7 Caucasians 108
2.1.8 Egyptians 109
2.1.9 Papua New Guineans 109
2.1.10 Polynesians 110
2.1.11 Neanderthals 110
2.2 Methods 111
2.2.1 Ageing of the immature material 111 2.2.11 Biological age assessment methods 112 2.2.1 ii Dental “ageing” methods 112 2.2.1 iia Moorrees, Fanning and Hunt 113 2.2.1 iib Schour and Massler 114 2.2.1 iic The revised standard of Ubelaker 114 2.2.1iid Tooth height measurements 115 2.2.1iie Incremental lines/Perikymata counts 115 2.2.1 ill Estimating the age of the present sample 116 2.2.1 iv Comparative ageing analysis 117
2.2.1 iva Visual dental assessment vs.
radiographic dental assessment 117 2.2.1 ivb Visual dental assessment vs.
combined skeletal assessment 118 2.2.1 ivc Visual dental assessment vs.
chronological age 119
2.2.2 Mensuration 120
2.2.2i Landmarks used in this study: anatomical
descriptions and type 122
2.2.2Ü Visualisation of the landmark data 122 2.2.3 Gathering of the data: equipment specifications 126 2.2.3i Known limitations of the equipment 126 2.2.3Ü The general assembly of the equipment 127
2.2.4 Analysing the landmark data 129 2.2.5 2.2.41 What are Geometric Morphometries? 130
2.2.4Ü Procrustes registration 130
2.2.4iii Analysing Procrustes fitted data 132
2.2.6 Analytical methods 134
2.2.51 Generalised Procrustes analysis 134
2.2.5ii Procrustes distances 135
2.2.5iii Principal components analysis 135 2.2.5ivPermutation test of angles between PCI s 136 2.2.5V Cartesian transformation grids, using Thin
plate splines 137
2.2.5viStudent’s t-test 138
2.2.5vii Correlation analysis 138
2.2.5viii Discriminant analysis/Discriminant
functions analysis 139
2.2.5ixStepwise discriminant analysis 139
2.2.5X Crossvalidation analysis 140
2.2.5xiUPGMA clustering 141
2.2.5XÜ Significance of an individual Mahalanobis’
distance from a population mean 142
Ch a p t e r 3 . Th e o n t o g e n y o f f a c ia l s h a p e in o n e m o d e r n h u m a n
p o p u l a t io n: e s t im a t in g a g r o w t h m o d e l a n d t e s t in g it s
STABILITY 148
3.1 Introduction 148
3.2 The analysis of facial growth allometry in the Ankara, as assessed using the full set of landmarks 151
3.2.1 Materials and methods 151
3.2.2 Results 151
3.2.3 Discussion of the single population growth
analysis 154
3.3 Commonly excluded landmarks: their influence on the
3.4
3.3.2 Materials and methods 158
3.3.3 Results 158
3.3.4 Discussion of the analysis of a single growth series in the absence of commonly excluded landmarks 161
Summary and Conclusions 163
Ch a p t e r 4 . Gr o w t h o f in d iv id u a l f a c ia l u n it s
4 .1 Introduction
4 .2 Materials and Methods 4 .3 Results
4 .4 Discussion
4 .5 Summary and Conclusion
173 173 176 177 182 186
Ch a p t e r 5. Dif f e r e n c e s in f a c ia l f o r m b e t w e e n a d u l t s:
A STUDY OF 10 MODERN HUMAN POPULATIONS 192
5.1 Introduction 192
5.2 Materials and methods 194
5.3 Results 195
5.3.1 Population differences in facial shape 195 5.3.2 Population differences in facial size 207
5.4 Discussion 208
5.4.1 The relative relationships between population-
specific shapes 209
5.4.2 Overall trends in facial shape variation 211
5.4.3 General conclusions 216
5.5 Summary and Conclusions 217
Ch a p t e r 6 . Po p u l a t io n-s p e c if ic d if f e r e n c e s in t h e g r o w t h o f
THE FACIAL SKELETON IN MODERN HUMANS 223
6.1 Introduction 223
6.2 Materials and methods 226
6.3 Results 228
and age 230 6.3.1 ii Age changes represented by PC1 232 6.3.2 Comparisons of growth between populations 233 6.3.3 Overall population differences in facial shape 237
6.4 Discussion 242
6.4.1 PCI vs age and size 242
6.4.2 Differences in shape represented by PCI 244 6.4.3 Differences in the growth vector 246 6.4.4 Overall differences in facial shape 249
6.5 Summary and conclusions 252
Ch a p t e r 7. Th e o n t o g e n y o f s e x u a l d im o r p h is m in t h e f a c ia l
SKELETON OF FIVE MODERN HUMAN POPULATIONS 280
7.1 Introduction 280
7.2 Materials and Methods 283
7.3 Results 284
7.3.1 Adult sexual dimorphism 284
7.3.11 Sexual dimorphism in facial centroid size 284 7.3.1 ii Degree of sexual dimorphism in facial
shape 285
7.3.liiiThe nature of sexual dimorphism in facial
shape 289
7.3.2 The development of sexual dimorphism in the
facial skeleton 293
7.3.21 The African Americans: a fully sexed
sample 293
7.3.2Ü The partially sexed samples 297
7.4 Discussion 302
7.4.1 Variation in the degree of sexual dimorphism in
the size of the adult facial skeleton 302 7.4.2 Variation in the degree and nature of sexual
dimorphism in the shape of the adult facial
7.5 Summary and Conclusions 309
Ch a p t e r 8 . In t e r-s p e c if ic d if f e r e n c e s in t h e g r o w t h o f t h e
FACIAL s k e l e t o n : A COMPARISON OF MODERN HUMANS
AND N e a n d e r t h a l s 3 2 6
8.1 Introduction 326
8.2 Materials and methods 329
8.3 Results 330
8.3.1 The selection of landmarks 330
8.3.2 Variation in adult morphology 331
8.3.3 Modern variation in facial growth on the basis
of 19 landmarks 335
8.3.4 Growth in the Neanderthal facial skeleton 339
8.4 Discussion 346
8.4.1 Neanderthal growth and general facial
Morphology 347
8.4.2 The relationships between Neanderthal and
modern facial morphologies 350
8.5 Summary and conclusions 357
Ch a p t e r 9. Ov e r a l l s u m m a r y o f c o n c l u s io n s 378
9.1 Introduction 378
9.2 Growth of the modern human facial skeleton 378
9.3 Patterns of modern human variation 383
9.4 Sexual dimorphism in the facial skeleton 386 9.5 Neanderthal morphology and development 389 9.6 Processes of human facial growth: overall conclusions 393
Lis t OF f ig u r e s
Chapter 1
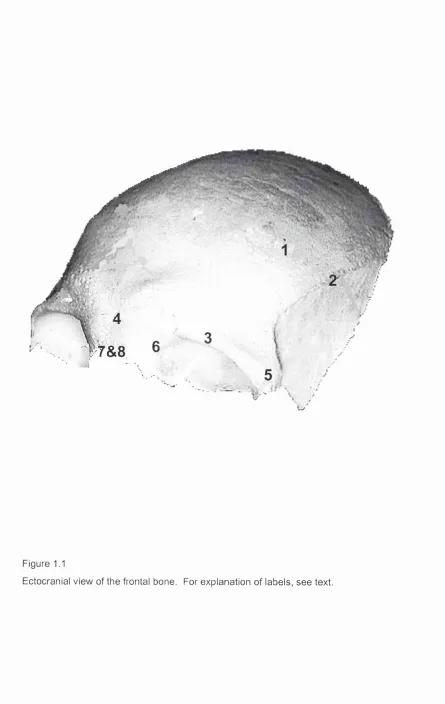
1.1 The frontal 93
1.2 The zygomatic 94
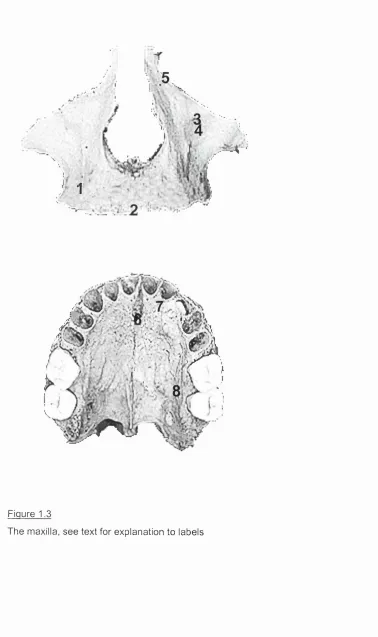
1.3 The maxilla 95
1.4 The palatine 96
1.5 The nasal 97
1.6 The ethmoid 98
1.7 The lacrimal 99
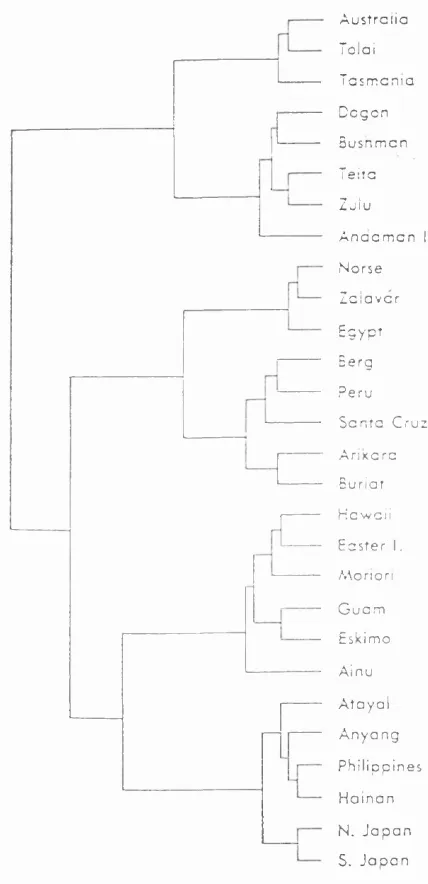
1.8 Relationships between modern human groups
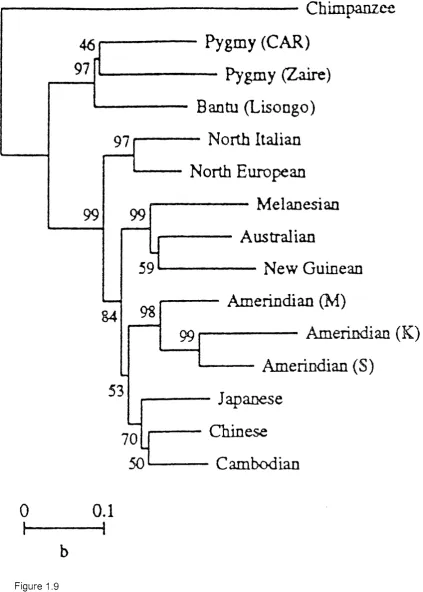
based on craniofacial morphology, Howells (1989) 100 1.9 Relationships between modern human groups
based on molecules, Nei and Takezaki (1996) 101 1.10 Possible heterochronic relationships (Alberch et al, 1979) 102 Chapter 2
2.1 The revised standard of Ubelaker (1989) 143
2.2 Original landmarks; landmarks joined up by triangles;
surface fitted to the triangles 144
2.3 Triangle configurations based on a full set of landmarks 145 2.4 Triangle configurations based on 26 landmarks 145 2.5 Triangle configurations based on landmarks on the
zygomatic 146
2.6 Triangle configurations based on landmarks on the
Frontal 146
2.7 Triangle configurations based on landmarks on the
Maxilla 147
2.8 Triangle configurations based on 19 landmarks. 147 Chapter 3
3.1 Arikara Indians, full set of landmarks PCI vs PC2 165 3.2 Ankara Indians, full set of landmarks. Morphological
along PC1. 166 3.3 Arikara Indians, full set of landmarks. Scores on PC1
plotted against dental age and scores on PCI plotted
against facial centroid size. 168
3.4 Arikara Indians, facial landmarks excluding rhinion (A) PCI vs PC2; (B) PCI vs facial centroid size;
(C) PCI vs dental age. 169
3.5 Arikara Indians, facial landmarks excluding bregma (A) PCI vs PC2; (B) PCI vs facial centroid size;
(C) PCI vs dental age. 170
3.6 Arikara Indians, facial landmarks excluding staphylion (A) PCI vs PC2; (B) PCI vs facial centroid size;
(C) PCI vs dental age. 171
3.7 Arikara Indians, facial landmarks excluding zygotemporale superior and inferior (A) PCI vs PC2; (B) PCI vs facial
centroid size; (C) PCI vs dental age. 172
Ch a p t e r 4
4.1 Arikara: frontal only, PCI scores vs PC2 scores. (B) A morphological representation and TPS of the shape differences of the frontal bone from the positive to the negative extreme of P C I, lateral view (C) A
morphological representation and TPS of the shape differences of the frontal bone from the positive to the
negative extreme of P C I, frontal view. 188 4.2 Arikara: maxillae and palatines only. (A) PCI vs PC2.
(B)A morphological representation and TPS of the shape differences of the maxillae and palatines from the positive to the negative extreme of P C I, frontal view. (C) A
morphological representation and TPS of the shape differences of the maxillae and palatines palatines from
the positive to the negative extreme of P C I, lateral view. 189 4.3 Arikara Indians, zygomatics only PCI vs PC2 and a
4.4
Ch a p t e r 5
5.1
5.2
5.3
5.4 5.5
lateral view; (B) from the negative to the positive extreme
of PC2 190
(A) Arikara Indians, frontal only, PCI vs PC2 (B) Arikara Indians, maxillae and palatines only PCI vs PC2 (C)
Arikara Indians, zygomatics only, PCI vs PC2 191
Results of the discriminant study with crossvalidation to assess optimum amount of variance to separate
between populations.
Dendrogram based on the Mahalanobis D distances between the populations, all individuals included.
Dendrogram based on the Procrustes distances between the population means
Adult population means. ( A) PCI vs PC2; (B) PCS vs PC4 221 Adult means. Representation of the shapes at the positive (Left) and negative (Right) extreme of (A) PCI ; (B) PC2; (B) PCS; (D) PC4; and a TPS illustrating the difference between each pair of shapes.
C h a p t e r 6
6.1 6.2 6.S 6.4 6.5 6.6 6.7 6.8 6.9 6.10 6.11 6.12
The difference between parallel growth vectors on the one hand (A) and divergent growth vectors on the other (B) Polynesians, (A) PCI vs age, (B) PCI vs size
Papua New Guineans, (A) PCI vs age, (B) PCI vs size Australians, (A) PCI vs age, (B) PCI vs size
Egyptians, (A) PCI vs age, (B) PCI vs size Alaskans, (A) PCI vs age, (B) PCI vs size Ashanti, (A) PCI vs age, (B) PCI vs size Aleutians, (A) PCI vs age, (B) PCI vs size
African Americans, (A) PCI vs age, (B) PCI vs size Arikara, (A) PCI vs age, (B) PCI vs size
Caucasians, (A) PCI vs age, (B) PCI vs size
Polynesians, plot of PCI vs PC2 and a morphological representation and TPS of the change in shape along
6.13 Papua New Guineans, plot of PCI vs PC2 and a morphological representation and TPS of the change
in shape along PC1 266
6.14 Australians, plot of PCI vs PC2 and a morphological representation and TPS of the change in shape
along PCI 267
6.15 Egyptians, plot of PCI vs PC2 and a morphological representation and TPS of the change in shape
along PCI 268
6.16 Alaskans, plot of PCI vs PC2 and a morphological representation and TPS of the change in shape
along PCI 269
6.17 Ashanti, plot of PCI vs PC2 and a morphological
representation and TPS of the change in shape along PCI 270 6.18 Aleutians, plot of PCI vs PC2 and a morphological
representation and TPS of the change in shape along PCI 271 6.19 African Americans, plot of PCI vs PC2 and a morphological
representation and TPS of the change in shape along PCI 272 6.20 Arikara, plot of PCI vs PC2 and a morphological
representation and TPS of the change in shape along PCI 273 6.21 Caucasians, plot of PCI vs PC2 and a morphological
representation and TPS of the change in shape along PCI 274 6.22 Summary of shape changes in the facial skeleton along PCI
in the different populations 275
6.23 Dendrogram based on the angles between PCIs 277 6.24 Results of the discriminant study with crossvalidation to
assess optimum amount of variance to separate between populations. The figure shows the percentage correctly assigned to each of the 10 populations studied, on the basis of ca. 50%, 60%, 70%, 80% 90% and 100% of
the total variance within the sample 278
6.25 Dendrogram based on the Mahalanobis D distances
Ch a p t e r 7
7.1 Adult means, males and females, PCI vs PC2,
PC3 vs PC4 311
7.2 TPS of the shape difference between the mean adult female (reference shape) and the mean adult male
(target shape) of 5 modern human populations 312 7.3 African American: PCI vs PC2 and morphological
representation of the shape at each extreme of P C I, with a TPS showing the difference in shape from the positive
to the negative extreme of PCI 313
7.4 African Americans, PCI vs facial centroid size 314 7.5 African Americans: PCA of correlation matrix between
PCI scores and facial centroid size 315
7.6 African Americans, facial centroid size vs. dental age 316
7.7 African Americans, PCI vs PC6 317
7.8 Caucasians, PCI vs PC2, Aleutians, PCI vs PC2 318 7.9 Arikara, PCI vs PC2, Ashanti, PCI vs PC2 319 7.10 Caucasians, PCI vs size, Aleutians, PCI vs size 320 7.11 Arikara, PCI vs size, Ashanti, PCI vs size 321 7.12 Caucasians, PCA based on correlation matrix of PCI
scores and facial centroid size 322
7.13 Aleutians, PCA based on correlation matrix from PCI
scores and facial centroid size 323
7.14 Arikara, PCA based on correlation matrix between PCI
scores and facial centroid size 324
7.15 Ashanti, results of PCA based on correlation matrix
between PCI scores and facial centroid size 325
Ch a p t e r 8
8.1 The adult Neanderthal and modern means (A) PCI vs
PC2; (B) PC3 vs PC4 359
8.2 Dendrogram based on the Procrustes distances between
a Cartesian transformation grid showing the difference
between them 361
8.4 Polynesians, 19 landmarks. Plot of PCI vs PC2, and in the first row of shapes a morphological representation of
mean shape warped to either extreme of PCI 362 8.5 Papua New Guineans, 19 landmarks. Plot of PCI vs PC2,
and in the first row of shapes a morphological representation of mean shape warped to either extreme of PCI 363 8.6 Australians, 19 landmarks. Plot of PCI vs PC2, and in the
first row of shapes a morphological representation of mean
shape warped to either extreme of PCI 364
8.7 Egyptians, 19 landmarks. Plot of PCI vs PC2, and in the first row of shapes a morphological representation of mean
shape warped to either extreme of PCI 365
8.8 Alaskans, 19 landmarks. Plot of PCI vs PC2, and in the first row of shapes a morphological representation of mean
shape warped to either extreme of PCI 366
8.9 Ashanti, 19 landmarks. Plot of PCI vs PC2, and in the first row of shapes a morphological representation of mean
shape warped to either extreme of PCI 367
8.10 Aleutians, 19 landmarks. Plot of PCI vs PC2, and in the first row of shapes a morphological representation of mean
shape warped to either extreme of PCI 368
8.11 African Americans, 19 landmarks. Plot of PCI vs PC2, and in the first row of shapes a morphological representation of mean shape warped to either extreme of PCI 369 8.12 Arikara, 19 landmarks. Plot of PCI vs PC2, and in the
first row of shapes a morphological representation of mean
shape warped to either extreme of PCI 370
8.13 Caucasians, 19 landmarks. Plot of PCI vs PC2, and in the first row of shapes a morphological representation of mean
shape warped to either extreme of PCI 372
8.15 Neanderthals. Plot of PCI vs PC2, and in the first row of shapes a morphological representation of mean shape warped to either extreme of P C I. The next two rows of Cartesian transformation grids show the difference between the two extremes, lateral and frontal view 374 8.16 Modern human and Neanderthal infants. A morphological
representation of mean shape warped to an Arikara infant with a biological age of 2.5 years and a Neanderthal infant with a biological age of 2.5 years, and a Cartesian
transformation grid showing the difference between them 375 8.17 Results of the discriminant study with crossvalidation to
assess optimum amount of variance to separate between
the groups 376
8.18 Dendrogram based on the Mahalanobis D distances between the modern human and Neanderthal groups,
Listof tables
C h a p t e r 2
2.1
2.2
Ch a p t e r 3
3.1 3.2 3 .3 3.4 3.5 3.6
Ch a p t e r 4
4.1 4.2 4.3 4.4 153 153 Descriptions of the data sets used in the study 104 Landmarks used in the present study, abbreviations, types
and anatomical descriptions 123
Arikara, all facial landmarks. Eigenvalues, proportion of variance and accumulated proportion of variance for PCI-10
Arikara, all facial landmarks. Pairwise correlations between PCI scores, estimated age, and facial centroid size
Arikara, reduced data sets. Eigenvalues, proportion of variance and accumulated proportion of variance for P C I-3
Arikara, reduced data sets. Pairwise correlations
between PCI scores, estimated age, and facial centroid size
Arikara, reduced data sets. Results of Student’s t-tests of male and female scores on PC2
Arikara. Results of matrix correlation analysis of Procrustes distance matrices
159
Landmarks used in the analysis of individual facial units Arikara, facial units. Proportional and accumulated variance for PCs which account for 80% of total variance
Arikara, facial units. Pairwise correlations between PCI scores, estimated age, and facial centroid size
Arikara, facial units. Results of matrix correlation analysis of Procrustes distance matrices
4 .5
Ch a p t e r 5
5.1 5 .2 5 .3 5.4 5 .5 5 .6 5 .7 5 .8 5 .9
C h a p t e r 6
6.1
6.2
6 .3
6.4
6 .5
Arikara, facial units. Results of Student’s t-tests of male
and female scores on PC2 182
The composition of the adult data sets, and the location
of collections from which they were gathered 195 Adults, all individuals. Proportional and accumulated
variance for PCI-72 196
Adults, all individuals. Results from the canonical discriminant analysis of the 10 populations, based on
the total variance (PCI-72) 197
Adults, all individuals. Results from the canonical
discriminant analysis of the 10 populations, on the basis of the PCI-16, which together account for ca. 80%
of the total variance 198
Adults, all individuals. Results of the crossvalidation test of the 10 populations, based on PCI-16 which account
for 80% of the total variance. 200
Procrustes distances between the population means 200 Adults, population means. Proportional and accumulated
variance represented by PC 1-9 201
Summary of those aspects of facial morphology
expressed by PC1-PC4 for each population 205 Mean facial centroid size of each population 208
The composition of the data set 227
The growth series. The proportional and accumulated variance for those PCs which account for 90% of the
total variance 229
The growth series. Pairwise correlations between PCI
scores, estimated age, and facial centroid size 230 The growth series. Pairwise comparisons of the
direction of PCI 235
in each comparison. 236 6.6 The growth series. The proportional and accumulated
variance on PC1-72 238
6.7 The growth series. Results of the discriminant analysis
between the age series, based on PC1-26 240 6.8 The growth series. Results of the crossvalidation test
based on PC1-26 which together account for 90% of
the total variance 241
Ch a p t e r 7
7.1 The composition of the data sets 283
7.2 Sexual dimorphism in facial centroid size 285 7.3 Procrustes distances between the mean male and
mean female from each population 286
7.4 The proportional and accumulated variance accounted
for by each PC 287
7.5 Results of the independent stepwise canonical
discriminant analyses 288
7.6 Results of the crossvalidation study 288
7.7 Collective analysis of adult male and female means. Eigenvalues, proportional and accumulated variance for P C I-9, which together account for the total variance in
the analysis. 290
7.8 Procrustes distances between the population-specific
male and female means 291
7.9 African Americans. Eigenvalues, proportional and accumulated variance for PCI-15, which together
account for ca. 90% of the variance in the analysis 294 7.10 African Americans. Pairwise correlations between PCI scores,
estimated age, and facial centroid size 294 7.11 The partially sexed samples. Proportional and
accumulated variance for those PCs which represent
size 298 7.13 The partially sexed samples. Results of the stepwise
discriminant canonical analyses for sex within each
Population 300
7.14 The partially sexed samples. Results of Student’s t-tests of male and female scores on PCI and PC2 from the PCA of the correlation matrix between the original PCI
and facial centroid size 301
Ch a p t e r 8
8.1 The Neanderthal sample 329
8.2 Landmarks shared by all Neanderthal specimens 330 8.3 Neanderthal and modern adults. Eigenvalue, proportional
and accumulate variance for PCI-10 332
8.4 Procrustes distances between adult Neanderthal and
modern human adult means 333
8.5 Individual analyses of modern human populations using 19 landmarks. Proportional and cumulative variance for those PCs which together account for ca. 90% of the
variance. 336
8.6 Individual analyses of modern human populations using 19 landmarks. Pairwise correlations between PCI scores, estimated age, and facial centroid size 337 8.7 Neanderthals. Eigenvalue, proportional and accumulated
variance for PC 1-3 339
8.8 Neanderthal and modern age series. Proportional and
accumulated variance on PC I-50 342
8.9 Neanderthal and modern age series. Results of the discriminant analysis between the modern and
Neanderthal growth series, based on the total variance 344 8.10 Neanderthal and modern age series. Results of the
List of Ta b l e s; c o r rig en du m
Ch a p t e r 5
5.10 Pairwise Student’s t-test of the difference
Ac kno w ledg em en ts
I would like to thank my supervisors, Paul O’Higgins and Chris Stringer, for their help, advice and inspiration, and for channelling my often random thoughts and ideas in more orderly directions.
I would also like to thank both the staff and my fellow postgraduates in the Evolutionary Anatomy Unit, UCL, for their support, thought-provoking discussions and for making it such a stimulating and enjoyable place to work. I would particularly like to thank Nicholas Jones, without whose computing skills this study, and a very large number of others, would never have been carried out; Sam Cobb, whose line drawings form the templates of figures 2.3-2.8; and Yvonne Deville who kept us all on the straight and narrow.
I would also like to thank the staff and curators at the following institutions, for allowing me access to their collections, and going out of their way to make my data collection run as smoothly as possible: The Department of Palaeontology, The Natural History Museum, London; The Odontological Museum, Royal College of Surgeons, London; The Musée de l'Homme, Paris, France; The Department of Anthropology, American Museum of Natural History, New York, USA; The Department of Anthropology, Cleveland Museum of Natural History, Ohio, USA; The Department of Anthropology, University of Tennessee, Knoxville, Tennessee, USA; The Department of Anthropology, The National Museum of Natural History, The Smithsonian Institution, Washington DC, USA.
their hospitality during some of my data collecting, as do Leslie Marcus, Isaac and the team at the Department of Anatomy in Vienna for doing everything in their power to help me out when my equipment died in far flung foreign lands.
My friends who have listened to me alternatively rave on or grumble about every aspect of this study, and never got bored enough to tell me to shut up, deserve a great deal of thanks for their patience and friendship.
I am grateful to my family, both in Iceland and Sweden, for supporting me, encouraging me, and most importantly for believing in me, and making sure I did too. In particular I am indebted to my grandparents, Amma Stina, afi Bragi, amma Margrét and afi Karl, to all of whom this study is dedicated. It has been my fortune to have grown up in a family that encouraged individual development and career satisfaction over the prospects of financial fortune, and I can never be too grateful for that.
Finally, I would like to thank my fiancé, Paul Jeffery, who stood by me and supported me in the 19 months it took me to write this thesis. Thanks for seeing me through to the end of the tunnel!
Ch a p t e r 1
Ge n e r a l in t r o d u c t io n a n d l it e r a t u r e r e v ie w
1.1 In t r o d u c t io n
This study will seek to explore the way in which facial growth might vary, both within and between modern populations, as well as between modern humans and Neanderthals. In particular it focuses on shape changes with ontogenetic change in size and with age. The results of these growth studies are used to unravel the ontogenetic basis of intra-specific, inter-population, and inter- sexual differences in facial morphology. The analyses are focused on the upper and mid facial skeleton, excluding the mandible.
In the last decade and a half the study of shape variation has taken a great leap forward as a result of two main developments. The first is the availability of sophisticated equipment for data requisition, in the form of digital equipment capable of recording co-ordinates in three-dimensional space. The second is the development of new statistical techniques to analyse and visualise such data. This study will explore processes of growth in the human facial skeleton using three-dimensional co-ordinates, analysed with tools from Geometric Morphometries. These tools are outlined in sections 2.2.4-2.2.5 of this thesis.
Neanderthals; as well as previous work on craniofacial growth in Neanderthals.
1 .2 Gr o w t h o f t h e m o d e r n h u m a n f a c ia l s k e l e t o n
This section will give an introduction to the anatomy of the human facial skeleton as well as discuss the processes thought to be involved in its growth. It is divided into three main sub sections. The first is a detailed anatomical account of the bones that make up the facial skeleton, how they relate to one another, and any large-scale changes in their morphology that take place during post-natal growth. The second gives an account of the mechanisms that have been postulated to drive and control facial growth, while the third discusses the facial growth process as a whole and relates it back to the various mechanisms discussed in the previous section.
1 .2 .1 Th ea n a t o m y o f t h e f a c ia l s k e l e t o n
(Pick and Howden,1905; Warwick and Williams, 1973; White, 1991; Sampson et al. 1991; Hall-Craggs et al., 1995)
reason, the morphology of each of these bones (or pairs of bones), is discussed in detail in the following sections. The numbers in parentheses refer to anatomical features in figures 1.1-1.7.
1.2.1i Th e FRONTAL b o n e:
On the endocranial surface of the squama, the sagittal sulcus runs the length of the squamal midline, and eventually joins the frontal crest. At the base of this crest is the foramen caecum. On both sides of the midline the meningeal grooves mark the location of the meningeal arteries.
The orbital plates form the horizontal portion of the frontal. Laterally the frontal sinuses open out on either side of the ethmoidal notch. These sinuses extend between the inner and outer bony tables of the squama, and contribute to the elevation of the superciliary arches.
1.2.1ia La r g e-s c a l e c h a n g e s in t h e m o r p h o l o g y o f t h e f r o n t a l b o n e
DURING POST-NATAL GROWTH:
At birth the frontal bone is bisected sagittally by the metopic suture. The bone is formed from two separate ossification centres, and does not normally fuse until the second year. The frontal bone dominates the facial skeleton at birth, but as growth of the brain slows and ceases its proportional representation within the facial skeleton diminishes.
1.2.1 ib Co m m o n v a r ia t io n s in t h e m o r p h o l o g y o f t h e f r o n t a l b o n e:
1.2.1ic A r t i c u l a t i o n s :
The frontal bone articulates with the parietals, the maxillae, the ethmoid, the lacrimal, the nasal, the zygomatic and the sphenoid bones.
1.2.1Ü Th e z y g o m a t ic (m a l a r) b o n e s
The paired zygomatic bones (figure 1 .2 ), form the cheek prominence of the
human face, the outer wall and floor of the orbit, and part of the temporal and zygomatic fossae. It is quadrangular in shape and made up of three main processes. The frontal process (1 ) articulates with the external angular
process of the frontal bone. The temporal process (2 ) extends posteriorly to
join the zygomatic process of the temporal bone and together these form the zygomatic arch, through which the temporalis muscle passes. The maxillary process extends towards the midline to join the maxillary bone and forms the inferolateral margin of the orbit. On the external surface of the zygomatic bone the zygomaticofacial foramen (3) provides a passage for the zygomaticofacial nerves and vessels.
1 .2 .1 iia La r g e-s c a l e c h a n g e s in t h e m o r p h o l o g y o f t h e z y g o m a t ic b o n e s
DURING POST-NATAL GROWTH:
1.2.1 iib C om m on v a r i a t i o n s in t h e m o r p h o lo g y o f t h e z y g o m a tic b o n e s :
In some individuals a suture between the orbital and zygomatic parts of the zygomatic persists into and throughout adulthood. The zygomaticofacial foramen is often divided into multiple foramina.
1.2.1ÜC Ar t ic u l a t io n s:
The zygomatic bones articulate with the maxillae, frontal, sphenoid and temporal bones.
1.2.1iii Th e MAXILLAE
nerve and vessels. Just beneath this foramen the canine fossa (4) marks the junction between the 4 maxillary processes. The infraorbital foramen leads to the infraorbital canal, which opens posterosuperiorly on the orbital floor in the form of the infraorbital sulcus . The frontal process forms part of the opening of the nasal cavity, part of the orbital rim, and articulates with the frontal, nasal, lacrimal and ethmoid bones. On the lateral part of this process the anterior lacrimal crest (5) forms part of the lacrimal groove (the rest being formed by the lacrimal bone), which houses the nasolacrimal duct.
The palatine process forms three quarters of the hard palate as well as the floor of the nasal cavity. It projects horizontally inwards from the internal surface of the bone. At the midline, just posterior to the central incisors, the incisive foramen (6) perforates the hard palate. It is the opening of the incisive canal, which transmits the nasopalatine nerve and the descending septal artery. Posterior to this, particularly in young individuals, the premaxillary suture (7) may be visible. This suture marks the junction of prenatal ossification centres. The junction between the alveolar and palatine processes is marked laterally by the greater palatine groove (8), which supports the palatine vessels and nerve.
1.2.1iiia La r g e-s c a l e c h a n g e s in t h e m o r p h o l o g y o f t h e m a x il l a e d u r in g
POST-NATAL GROWTH:
resorption of the alveolus subsequent to tooth loss in old age or from other causes.
1 .2 .1 iiib Ar t ic u l a t io n s:
The maxillae articulate with the frontal, ethmoid, nasal, zygomatic, lacrimal, inferior nasal concha, vomer, and palatine bones, as well as with each other.
1 .2 .1 iv T h e PALATINE BONES
The palatines (figure 1.4), are a pair of L-shaped bones, which are situated at the back of the nasal fossa, wedged between the maxillae and the sphenoid. They form the rear of the hard palate and parts of the wall and floor of the nasal cavity. Each palatine bone can be divided into two main parts: an inferior horizontal plate and a superior vertical plate.
1.2.1iva A r t i c u l a t i o n :
The palatines articulate with the sphenoid, ethmoid, maxillae, inferior nasal conchae, vomer and each other.
1.2.1V Th e NASAL BONES
The nasal bones (figure 1.5), form the top margin of the nasal aperture. They are very variable in form, but are generally rectangular and oblong. The nasal foramen (1) perforates the external surface of each nasal bone.
1 .2 .1 v a Ar t ic u l a t io n s:
The nasal bones articulate with the frontal, ethmoid, and maxillary bones, as well as with each other.
1 .2 .1 v i Th e ETHMOID BONE
The ethmoid bone (figure 1.6), is located between the orbits, at the anterior part of the cranial base, and forms a part of the orbits, nasal cavity and basicranium.
foramina (2), providing passage for the olfactory nerves. The labyrinths consist of a number of thin-walled ethmoidal cells. These cells are interposed between two vertical plates of bones, the lateral one of which forms a part of the medial orbit walls, while the medial ones form the upper walls of the nasal cavity. The perpendicular plate descends from under the surface of the cribriform plate, in between the labyrinths, at the midline. It forms part of the nasal septum and articulates interiorly with the vomer.
1.2 .1 v ia Ar t ic u l a t io n s:
The ethmoid bone articulates with the frontal, sphenoid, nasal, maxillae, lacrimal, palatine, inferior nasal conchae, and vomer bones.
1.2.1VÜ Th e LACRIMAL b o n e s:
The lacrimal bones (figure 1.7), are a pair of small rectangular bones, which form part of the anteriomedial wall of the orbit. On the medial orbital wall of the lacrimal bones the posterior lacrimal crest (1) marks the boundary of the posterior part of the lacrimal groove, where it continues from the maxilla. This groove holds the nasolacrimal duct.
1.2.1viia Ar t ic u l a t io n:
1.2.2 M e c h a n is m s OF GROWTH
As was detailed above, the facial skeleton is made up of numerous independent bones, each of which grows and develops under the influence of various specific and systemic factors. In addition many of the individual bones can be divided into sub-units, which grow to some degree independently from each other. Despite this the facial skeleton has to remain a functional whole throughout the course of development, which is achieved through the constant remodelling of individual bones in order to adapt to the changes in size and/or shape of others. The process of remodelling and other growth mechanisms influencing the form of the facial skeleton are outlined in the sections below.
1 2.2i In u t e r o b o n e f o r m a t io n
Although this study deals solely with post-natal growth, it is important to have some understanding of pre-natal bone formation. It is during this period that the initial ossification of the craniofacial skeleton takes place, and the general ‘plan’ for the growth to follow is laid down This section will briefly discuss the embryonic formation of the facial skeleton.
caudal mandibular swelling, which will form the mandible and maxilla respectively.
The basic facial morphology is created in the fourth to tenth week in utero by the development and fusion of the single midline frontonasal process and the pairs of lateral mandibular and maxillary swellings (derived from the first branchial arch; Larsen, 1993; McLachlan, 1994). These appear at the end of the fourth week in utero. During the fifth week the paired swellings enlarge and nasal placodes appear on the frontonasal process and these too enlarge. During the sixth week a pit forms in each nasal placode. This results in the formation of the lateral and medial nasal processes which later fuse.
Persaud, 1993). In endochondral ossification chondroblasts form a cartilaginous matrix of glycoproteins which will provide the cartilaginous model for the bone. An osteon matrix then forms a collar of periosteum bone surrounding the cartilage, which gradually becomes invaded and replaced by bone (Sperber, 1989).
1 .2.2Ü Ce l l s in v o l v e d in b o n e f o r m a t io n a n d r e s o r p t io n
The two processes underlying the development (and later remodelling), of bone are formation and resorption. These processes are carried out by specific cells, regulated by systemic hormones and local factors. The cells involved are the bone forming cells of the osteoblastic lineage, and the resorbing osteoclastic cells.
1 .2 .2 iii Mo d e l l in g a n d r e m o d e l l in g
Once bone is formed it is subject to constant remodelling. Bone remodelling is a complex process involving different cellular functions directed towards co ordinated resorption and formation of new bone. It is regulated by hormones which control osteoblastic and osteoclastic activities. The aim of remodelling is to maintain the mineralised bone matrix and the life-long mechanical integrity of the skeleton (Canalis,1993).
shape of related elements. Bone modelling is a continuous process and covers a large surface, while remodelling is cyclical and usually covers a small area (Parfitt et al., 1983).
Bone formation is usually coupled with bone resorption: more than 97% of all new bone structural units (i.e. the end result of the process of remodelling), are formed at areas of prior resorption. This coupling was first recognised by Frost (1964). The basis of this coupling is unknown. However it is clear that when resorption stops at a specific site preosteoblasts will replace mononuclear cells, eventually form osteoblasts and bone formation takes place.
1 .2 .2 iv Me c h a n is m s o f p o s t-n a t a l f a c ia l g r o w t h
correct and that a combination of genetic and epigenetic influences is responsible for adult craniofacial morphology.
Several ways in which these influences could interact have been postulated. A common view is that the initial form of the cranio-facial skeleton is genetically determined and that it is only after birth that epigenetic influences may take over. However, the human foetus is not suspended in a mechanically inert medium, but is subjected to pressure, tension and shear from its environment. It is also capable of frequent and strong movements, the force of which may subject the skeleton to considerable stress. It is therefore likely that even pre-natally the skeleton is adapting to epigenetic influences.
so-called functional matrix as postulated by Moss (1964; Moss and Salentijn, 1969a, 1969b).
1 .2 .2 iv a Fu n c t io n a l m a t r ic e s
The functional matrix theory of skeletal growth and development was first postulated by Moss (1964, 1968; Moss and Saletijn, 1969a, 1969b). Moss believed that direct genetic influences on the size, shape and position of skeletal tissues were limited to the initiation of ossification and that subsequent genetic control of skeletogenic activity acted on functional matrices rather than the skeletal tissue itself. A functional matrix is defined as any tissue or space that guides the size, shape, and position of the supporting skeletal tissue (Ranly, 1980). In the case of the facial skeleton this would imply that the skeletal elements act purely as a supporting framework around the functional units of the eyes, mouth, brain, teeth, muscles etc. Each functional matrix has an associated skeletal unit which is subordinate to and supportive of the functional matrix.
suggests that both sutures and cartilage can regulate their own activity to some extent. Sutures can fuse prematurely and subsequently hinder the expansion of the growing brain, and although the growth of the cranial vault is severely restricted in microcephalic foetuses the chondrocranium is not significantly affected (van Limborg, 1970). It is the present consensus that the functional matrix theory can explain many aspects of genetic and biomechanical control of the growth and development of the craniofacial skeleton, although its limits and restrictions do need to be studied in greater detail.
1 .2 .2 iv b Bo n e d e p o s it io n d u r in g g r o w t h
Three main phenomena are Involved in bone deposition during post-natal growth; conversions of cartilage, sutural deposition, and periosteal remodelling.
The only cartilage involved in growth of the facial skeleton is the nasal septum. It is no longer thought to be an active participator in the displacement of the midfacial bones during development (as had been postulated by Scott, 1953, 1956), but to grow secondary to the prior displacement of the midfacial growth as a response to the expansion of the respiratory and digestive tracts (Moss, 1964). The nasal septum helps to maintain the form of the midface.
large part of the enlargement of the facial bones observed during post-natal development.
Periosteal remodelling was discussed in section 1.2.2iii. It maintains the shape and proportion of bones throughout development as well as adjusting them to changes in the shape and location of adjoining elements so that the skull remains a functional whole. It is a fundamental agent in the so called v- principle of bone growth, which is widely applicable to growth in the facial skeleton. It is based on the fact that many facial bones have v-shaped, or three-dimensionally funnel-shaped configurations. In the remodelling of such areas during growth it is thought that bone deposition occurs on the surface of the bone which faces the direction of growth while resorption is taking place on the surface facing away from the direction of growth. This causes a ‘drift of the entire structure' as well as an absolute increase in its size. Further remodelling then has to take place to adjust the structure to its new position (Thilander, 1995).
1 .2 .3 Po s t e m b r y o n ic g r o w t h o f t h e f a c ia l s k e l e t o n
1 .2 .3 i Th e FRONTAL BONE
movements ( Pritchard et al, 1956), and cell death (Bourez et al., 1997). Post natal ly bone growth will work to narrow the sutures and eliminate the fontanelles and the sutures will take on a role of absorbing mechanical stress from masticatory muscles as well as being important growth sites. Eventually some sutures, including the frontal suture, will become completely obliterated. Growth of the frontal bone and the rest of the calvaria is predominantly sutural in the first four years of life (Sperber, 1989). The regulation of sutural growth has been greatly debated. At one point it was thought that it was primary in nature and that the sutures had an independent growth potential for pushing the bones apart (Keith and Campion, 1922). This view has now been abandoned by most in favour of a view of the growth being secondary in nature as a response to some other factor or factors affecting the separation of bones and necessitating an apposition at bone surfaces (Koski, 1968). It has been noted that the separation of bones at sutures is related to increased brain weight (Babler, 1989), although the loading that the neural content causes on the braincase has not been measured directly (Herring, 1993). The neurocranium is thus a likely candidate for a situation where a capsular functional matrix could be seen to regulate bone growth (McLachlan, 1994). Moss and Salentijn (1969a), classify the neurocranial capsular matrix as containing the brain, the leptomeninges and the cerebrospinal fluid. The expanding brain displaces the bones of the neurocranium outwards. This causes tension in the sutural membranes which in turn responds by depositing bone at the sutural edges (Enlow and Hans, 1996).
Thus the frontal and the rest of the neurocranium also develops very rapidly. At birth a child has achieved 25% of neurocranial growth, 50% by six months, 75% by two years, and at ten years it has reached 95% and the growth is almost finished. At that age the facial skeleton has only achieved 65 percent of its potential growth (Sperber, 1989). The spheno-occipital synchondrosis will keep growing into adulthood to accommodate the posterior expansion of the maxilla as space is being made for the molars and growing nasopharynx. Once the neurocranial expansion slows down, sutural growth becomes negligible and remodelling becomes the most important factor in further frontal growth and determining its final shape. This remodelling is mostly influenced by the compressional stress caused by the masticatory muscles (Herring, 1993), and as a reaction to the changing form (shape and size), of the growing elements of the anterior cranial base and the facial skeleton. The stress from the muscle activity is either direct in the area of attachment or indirect as loading of the bones causes bending or torsion stress.
1 .2.3Ü Th e f a c ia l s k e l e t o n (e x c l u d in g t h e m a n d ib l e)
to displacement of the bone causing tension which stimulates deposition of new bone.
expansion of the maxillary sinuses and the basal part to the expansion of the infra-orbital canal. In addition the masticatory muscles and other periosteal matrices also influence bone surface remodelling similarly to what is seen on the cranial bones.
The maxilla is unique in that its growth is influenced by almost all the functional matrices acting on the facial skeleton, and the same matrices act on other facial bones. The general concept of functional matrices is presently established as a valid explanation for facial bone displacement and subsequent remodelling.
Although the orbit has reached its adult size at the age of 7 years, continuous remodelling of the orbital bones continues. As the whole maxilla is interiorly displaced, the orbit is said to remodel in an upward direction, at the same time as the nasal floor remodels downwards. This leads to a separation of the orbital and nasal floors which in childhood are at a similar level but are vertically separated in adulthood (Enlow, 1990). It is further aided by growth of the orofacial capsule and with it the nasal septum.
Growth at facial sutures ceases on average at 17 years of age , which is two years earlier than growth of the mandibular condyle and total body height (Bjork, 1966). In addition developmental skeletal changes in the face slow markedly in girls not long after puberty, but in boys not until late adolescence (Enlow and Hans, 1996), which is related to the development of facial sexual dimorphism in the teenage period.
1 .3 Pa t t e r n s o f m o d e r n h u m a n v a r ia t io n
1.3 .1 In t r o d u c t io n
molecular evidence. In this section I will discuss some of the more recent studies of relationships between modern humans based on craniofacial form. I shall then briefly summarise the population relationships based on molecular data, and how they contrast with those based on morphology.
1.3.2 Th e MORPHOLOGY
Coon (1962), had proposed that the craniofacial form of Caucasoid populations was the most divergent of all modern humans. Howells (1973; 1989), did not find this the case. No population was dramatically distinct from all the others, although Howells (1989), did propose that Polynesians were possibly the most divergent from the others.
Figure 1.8 shows an example of the relationships Howells found between modern human groups. The most notable trends are the similarities between the Australoid and African groups, and the distinctiveness of that cluster as opposed to the other populations. The European and Far Eastern populations also form quite distinct clusters, but the American Indian and Polynesian populations do not form distinct groups. The Australoid/African cluster is the one which has most undermined the use of craniometry for taxonomic purposes in modern humans. It is based on a strong craniometric relationship, and has been replicated in a number of consequent studies (e.g. Froment, 1992; Lynch et al, 1996; Hanihara, 1996).
midway between the African and Australian continents, reflecting their close morphological similarity, and not at all a good fit to the geography. The central position of the West Asian morphologies, which is unlike that proposed by most other workers, could be explained by their relative similarity to those of African populations (Hanihara, 1996).
Guglielmino-Matessi et al (1977), analysed Howells (1973), data set and found that the first discriminant function was correlated with climatic variables of temperature. This could explain the similarities between the African and Australian morphologies. The authors claimed that, having taken this temperature correlation into account, they found that the second discriminant function separated the populations in a way that would have been predicted from genetic relationships (see section 1.3.3). Howells (1989), however pointed out that although the populations at the extremes of the first discriminant function were from different latitudes, the position of other populations along the axis was not necessarily as well correlated with temperature variables.
craniofacial width could be due to shared adaptations to masticatory stress (see Lahr, 1995).
1.3.3 Th e MOLECULES
Whereas the morphological analyses reveal a pattern of modern human diversity which is somewhat unexpected based on geographical relationships, the molecular data is more in line with present day geographical distributions (see figure 1.9). For example Batzer et al. (1994), found 4 main groups represented on the basis of Alu insertions, representing Africa, Europe, Asia/Americas, and Australia/New Guinea. Similar patterns have been revealed based on a larger range of nuclear gene frequency data (Nei and Takezaki, 1996).
Modern human populations are very genetically homogenous. Barbujani et al (1997), found that 81.4% of modern human genetic variation (based on 109 DNA markers in 16 populations), was accounted for by intrapopulation differences, while differences between continents only represented ca. 10% of the total molecular diversity within these populations.
1.4 Se x u a l d im o r p h is m in t h e f a c ia l s k e l e t o n
1.4.1 In t r o d u c t io n
about how sex differences in morphology develop, but also about the basic mechanisms which produce those morphologies.
This section of chapter one will examine previous studies of the development of facial sexual dimorphism in humans and non-human primates, in order to establish current theories on the development of differences in adult facial form. Throughout this chapter, allometry is defined as changes in shape with size (Hills and Wood, 1984; Klingenberg, 1996)
1.4.2 Th e o n t o g e n y o f s e x u a l d im o r p h is m in t h e f a c ia l s k e l e t o n
A common way of analysing the ontogeny of sexual dimorphism within and between taxa is within the framework of heterochrony. Indeed in order to understand the conclusions of much of the ontogenetic literature, it is necessary to have an understanding of heterochronic and related processes. Therefore, before discussing the ontogeny of sexual dimorphism in the facial skeleton, a brief summary of the ontogenetic processes and nomenclature will be given.
1.4.2i He t e r o c h r o n y
conceptual basis of modern heterochronic studies is that devised by Gould (1977). Gould defined heterochrony as changes in relative time of appearance and rate of development of characters already present in ancestors. This definition summarises the main variables necessary to dissect ontogenetic processes: size, shape, age and phylogenetic information. It has been postulated that growth rate is the most plastic of the variables (Hall, 1984), although shifts in all of these variables have been detected between related taxa in various studies. Shifts in these variables have also been reported between parent and offspring (McNamara, 1986), and between breeds of the same species (Wayne, 1986).
Although Gould had formalised the framework for the study of heterochrony in 1977, it was not until two years later that Alberch et al (1979), finalised the modern diagnostic scheme of heterochronic processes. Their scheme has remained virtually unchanged ever since, except for a few modifications, particularly in nomenclature\
1.4.2ia Th e BASIC MODEL OF HETEROCHRONY (Al b e r c h ETAL, 1979)
All ontogenetic trajectories are regulated by 4 parameters: the onset and offset of growth, the growth rate during the growth period, and initial size at the commencement of the growth period. Growth rate can be further divided into growth rate in size and growth rate in shape. Under the Alberch et al. model (1979), the ontogenetic trajectories are linearised for clarity. Alberch et
al. saw six possible heterochronic relationships between ancestral and descendant taxa (see figure 1.10).
The relationships described by figures 1.10a and 1.10b, are caused by positive or negative changes in the rate of shape change during ontogeny. These result in descendant morphologies which are either like a juvenile version of the ancestral form or that transcend the ancestral form. The patterns are respectively termed neoteny and acceleration. Later literature has favoured the word deceleration over neoteny (Reilly et al., 1997). Figures 1.10c and 1.1 Od describe relationships where the descendent trajectory is marked by a decrease or increase in the growth period. Such patterns are termed progenesis and hypermorphosis respectively. The term progenesis has now been largely replaced by hypomorphosis (Shea, 1983).
Figures 1.1 Oe and 1.1 Of are examples of trajectories where the descendent taxon has undergone changes in the onset age of growth. Such a change only produces a change in adult morphology if the offset of growth remains static. Alberch et al. (1979), refer to these particular relationships as pre- and post-displacements.
In addition to the six relationships described above, Alberch et al (1979), saw the possibility of pure perturbations of size growth rates resulting in identical morphologies of smaller or larger size. They termed these proportional dwarfism and proportional giantism. Such isometric relationships will not be further discussed here.
transcends that of the ancestor. That process (and the result thereof), is called peramorphosis. The negative perturbations (deceleration, hypomorphosis and post-displacement), on the other hand result in forms whose morphology resembles the juvenile stages of the ancestral taxon. This process (and the result thereof), is called paedomorphosis. Alberch et al also related these processes back to the idea of ontogeny recapitulating phylogeny by terming the phylogenetic consequences of peramorphosis and paedomorphosis recapitulation and reverse recapitulation respectively. This particular part of their model has been greatly criticised (e.g. McNamara, 1986), and is now very rarely used.
Heterochrony is by no means a simple process and often more than one of the perturbation events can influence the end form of any one structure. Additionally the same taxon may display certain features, which are paedomorphic, and others, which are peramorphic. It is therefore more accurate to talk of certain traits following a particular heterochronic trajectory, than the whole organism doing so. Local heterochronies are also more likely to produce novel morphologies than global heterochronies (Raff and Wray,
1989).
1.4.2ib In h e r e n t c o n s t r a in t s in t h e u s e o f h e t e r o c h r o n y a s a m o d e l o f
ONTOGENETIC RELATIONSHIPS
It is inherent in the above model that to detect heterochronic processes one needs to look at the ontogenetic trajectories of more than one taxon and have a clear idea which of those taxa is the ancestral one (Fink, 1982). Insufficient investigations into phylogenetic relationships can weaken results of heterochronic investigations, and thus a clear, well-supported idea of phylogenies is a prerequisite for this type of analysis. It is also necessary to make a distinction between a developmental process and the results of that process, which, in many studies of heterochronic relationships, are often confounded (Shea, 1983).
Another problem with the idea of heterochrony is the fact that traditionally growth is usually studied relatively late in development (Hall, 1984). However, evolutionary modifications of morphological traits are possible at all stages of ontogeny, even the very earliest (Raff and Wray, 1989). Indeed it has been found that the number and mitotic activity of the cells in the initial skeletal condensation plays a fundamental role in controlling the onset of growth (Hall, 1984).
Further to this is the problem that the onset and offset of the heterochronic process of certain traits may not be at the beginning or end of the ontogenetic trajectory (Reilly et al., 1997). Some traits may be present very early on in development and be fully-formed at an early age, whereas others only start forming much later in the developmental sequence. It is therefore important to chose carefully the shape trait under study and the ‘units’ used to represent it, and to be well aware of its developmental history.