O R I G I N A L R E S E A R C H
Subjective sleep measurement: comparing sleep
diary to questionnaire
This article was published in the following Dove Press journal: Nature and Science of Sleep
David C Mallinson Maria E Kamenetsky Erika W Hagen Paul E Peppard
Department of Population Health Sciences, School of Medicine and Public Health, University of Wisconsin-Madison, Madison, WI, USA
Purpose: The sleep diary is the gold standard of self-reported sleep duration, but its comparability to sleep questionnaires is uncertain. The purpose of this study was to compare self-reported sleep duration between a sleep diary and a sleep questionnaire and to test whether sleep-related disorders were associated with diary-questionnaire differences in sleep duration.
Participants and methods: We compared self-reported sleep duration from 5,432 ques-tionnaire-sleep diary pairs in a longitudinal cohort of 1,516 adults. Participants reported sleep information in seven-day sleep diaries and in questionnaires. Research staff abstracted average sleep durations for three time periods (overall; weekday; weekend) from diaries and questionnaires. For each time period, we evaluated diary-questionnaire differences in
sleep duration with Welch's two-sample t-tests. Using linear mixed effects regression, we
regressed overall diary-questionnaire sleep duration difference on several participant char-acteristics: reporting any insomnia symptoms, having sleep apnea, sex, body mass index, smoking status, Short Form-12 Physical Health Composite Score, and Short Form-12 Mental Health Composite Score.
Results:The average diary-reported overall sleep duration (7.76 hrs) was longer than that of
the questionnaire (7.07 hrs) by approximately 41 mins (0.69 hrs, 95% confidence interval:
0.62, 0.76 hrs). Results were consistent across weekday- and weekend-specific differences.
Demographic-adjusted linear mixed effects models tested whether insomnia symptoms or sleep apnea were associated with diary-questionnaire differences in sleep duration. Insomnia symptoms were associated with a 17 min longer duration on the diary relative to the
questionnaire (β=0.28 hrs, 95% confidence interval: 0.22, 0.33 hrs), but sleep apnea was
not significantly associated with diary-questionnaire difference. Female sex was associated
with greater diary-questionnaire duration differences, whereas better self-reported health was associated with lesser differences.
Conclusion: Diaries and questionnaires are somewhat disparate methods of assessing subjective sleep duration, although diaries report longer duration relative to questionnaires, and insomnia symptoms may contribute to greater perceived differences.
Keywords:comparison, self-reported sleep, sleep log, surveys
Introduction
An abundance of epidemiologic literature has established the links between sleep duration and several health outcomes. Short sleep is associated with increased risks of obesity,1hypertension,2and diabetes.3Moreover, there is substantial evidence of an association between inadequate sleep duration and elevated risk of all-cause mortality.4 Given the relevance of sleep to health and well-being, there is clinical and epidemiologic justification to assess sleep duration metrics in clinical and research
Correspondence: Paul E Peppard Department of Population Health Sciences, School of Medicine and Public Health, University of Wisconsin-Madison, WARF Building #611A, 610 N. Walnut St, Madison, WI 53726-2397, USA
Tel +1 608 262 2680 Email ppeppard@wisc.edu
Nature and Science of Sleep
Dovepress
open access to scientific and medical research
Open Access Full Text Article
Nature and Science of Sleep downloaded from https://www.dovepress.com/ by 118.70.13.36 on 24-Aug-2020
populations. Polysomnography is the gold standard for
objective sleep duration measurement,5although its
time-and resource-consuming process can render it prohibitive for epidemiologic research. Moreover, in-lab sleep dura-tion may not be characteristic of at-home sleep duradura-tion, as the polysomnography may interfere with typical sleep. Wrist actigraphy is an alternative approach to objective sleep duration measurement, but it is also time-intensive and its validity has not been extensively tested in popula-tions with sleep-related disorders.6
In contrast to objective measures, subjective sleep
dura-tion measures can be efficient and practicable means of
collecting sleep duration data, especially in large popula-tion-based or community-based studies. Prior studies found that subjective sleep duration measures are generally
com-parable to objective measures among healthy adults,6
although subjective measures may over-report sleep dura-tion length among elderly adults or adults with poorer
health.7Nonetheless, subjective assessments offer a more
efficient approach to measuring sleep duration that are
commonly used in sleep research. Two common instru-ments for subjective sleep measurement are sleep diaries and single- or multi-item sleep questionnaires. The sleep diary is the accepted standard for self-reported sleep dura-tion, as it elicits detailed“real time”(not recalled) informa-tion on daily sleep durainforma-tion and timing over a specified time
period.8 However, diaries rely on participants’ sustained
adherence,9and there is no standardized diary for research
or clinical purposes.8Simple questionnaires (for example,
“On most nights, how many hours and minutes do you
sleep?”) are faster, but they may be prone to inaccuracies, such as substantially rounded sleep duration estimates (e.g., to the nearest hour or half-hour), since they do not collect exact bed and wake times. While both instruments have advantages and disadvantages, their comparability and the factors that affect differences between the instruments are unknown. This information may be useful for wide-scale sleep duration surveillance that prioritizes resource- and time-efficiency.
The purpose of this study is to compare self-reported sleep duration measures between a sleep diary and a ques-tionnaire in an adult population. In addition to comparing these measures, this study also investigates whether insomnia symptoms, sleep apnea, or demographic charac-teristics contribute to differences in self-reported sleep duration between the diary and questionnaire. Both insom-nia and sleep apnea can result in atypical sleep habits. These conditions may affect responses to daily sleep
reporting differently than usual sleep duration questions. Additionally, we hypothesize that observed demographic factors will not be associated with diary-questionnaire differences in reported sleep duration. Demographic char-acteristics may affect sleep quality,10 but there is little evidence of these factors contributing to disagreement between different methods of subjective sleep duration.
Methods
Sample
We analyzed data from participants in the Retirement and Sleep Trajectories (REST) Study. Established in 2010, REST is a prospective cohort used for investigating pre-and post-retirement sleep patterns in a community-dwelling (ie, independent living) population of middle-aged and
older adults.11 REST drew its study population from the
sampling frame of the Wisconsin Sleep Cohort (WSC) study, a longitudinal population-based study of the history of common sleep disorders among (then) Wisconsin state
employees who were 30–60 years old upon enrollment in
1988. The WSC’s full sample collection has been described
elsewhere.10,12Individuals from the sampling frame were
eligible for REST if they were alive in 2010 and met one of the following requirements: previous response to at least three mailed WSC surveys, or one overnight WSC poly-somnography study and previous response to at least one
mailed WSC survey.11 REST staff mailed one sleep and
health questionnaire, which included sleep duration items, as well as one seven-day sleep diary per year to each
eligible individual during 2010–2014. Participants were
asked to record sleep information in their diaries upon completion of the sleep and health questionnaire.
There were 2,472 eligible adults at baseline, 2,341 (94.7%) of whom were locatable and alive through the
fourth and final survey wave. There were 131 adults who
were lost to follow up throughout the study duration. Participants returned 6,405 questionnaire-diary pairs of a total possible of 9,589 (66.8%). We excluded 1,092 obser-vations (17.0%) that were missing information on at least one key variable for our analysis. This generated an ana-lytic sample of 5,313 questionnaire-diary pairs from 1,516 adults. Among included adults, 1,445 (95.3%) returned at least two questionnaire-diary pairs.
Subjective sleep instruments
The two subjective sleep instruments for this study were the sleep diary and the questionnaire. The diary elicited sleep and
Nature and Science of Sleep downloaded from https://www.dovepress.com/ by 118.70.13.36 on 24-Aug-2020
wake times over a seven-day period. Because sleep diaries covered a seven-day period, participants could record up to
six nights’worth of sleep data in each diary. We computed
daily sleep duration as the difference between the reported sleep time on a day and the reported wake time on the subsequent day. For example, if a participant reported falling asleep at 10:00 PM on a Monday and waking up at 6:00 AM on the following Tuesday, then the sleep duration was eight hours. This generated a possible total of six daily sleep durations, which we used to compute average diary-reported sleep durations. The three primary measures from the diary were average overall sleep duration, average weekday sleep duration, and average weekend sleep duration, all of which were measured in hours. The following formula calculated the weighted average overall sleep duration from the diary:
5 xij;weekday
=nj;weekday
þ
2 xij;weekend
=nj;weekend
=7; where 'x' is the
recorded sleep duration, subscript 'i' is the diary-logged night, 'n' is the number of diary-logged nights slept, subscript 'j' indicates the participant, subscript 'weekday' indicates a weekday night, and subscript 'weekend' indicates a weekend night. This equation calculates the mean sleep durations for weekday nights and weekend nights, and then weights those values to calculate an average sleep duration for the entire week. Participants did not have to complete all seven days of the diary to be included in this analysis.
The questionnaire consisted of several items regarding sleep history and general health. One question addressed
sleep duration:“How many hours of sleep do you usually
get during (a) a weekday night?; and (b) a weekend or
non-work night?”Participants recorded their answers in hours
and minutes. The three primary measures from question-naire data were average overall sleep duration, average weekday sleep duration, and average weekend sleep dura-tion, all of which were measured in hours. The following formula calculated weighted average overall sleep duration from the questionnaire: 5xj;weekdayþ2xj;weekend
=7; where 'x' is the recorded sleep duration, subscript 'j' indi-cates the participant, subscript 'weekday' indiindi-cates a week-day night, and subscript 'weekend' indicates a weekend night.
Variables
There were three primary sleep-related disorder predictor variables in this analysis: insomnia symptoms (yes or no), insomnia symptom-days per month, and self-reported sleep apnea (yes or no). The insomnia symptoms variable
was a composite of four questionnaire items: difficulty
falling asleep, difficulty getting back to sleep, repeated
nocturnal awakenings, and early morning awakening.
Participants could respond to each item with “never,”
“rarely,” “sometimes,” “often,” or “almost always.” If a participant responded with“often” or “almost always”to any item, then the participant was indicated as having reported insomnia symptoms. Insomnia symptom-days per month was defined as the sum of a participant’s esti-mated symptomatic days for those items (for example, an individual could report 15 days of difficulty falling asleep and 25 days of repeated nocturnal awakenings, yielding 40 insomnia symptom-days per month). There was a range of
0–100 insomnia days per month in our sample.
Self-reported sleep apnea was indicated by a survey question that asked respondents if they have ever been diagnosed with sleep apnea by a physician, to which respondents
could answer “yes” or “no.” If a respondent selected
“yes” to this question, every future observation reported
“yes”to self-reported sleep apnea.
Other variables in our analysis included age at the time of the sleep diary (years), sex (female or male), body mass
index (kilograms/meters2), smoking status (current smoker
or not current smoker), the Short Form-12 (SF-12) Physical Health Composite Score, and the SF-12 Mental Health Composite Score. We rescaled both SF-12 scores from a 0–1 point range to a 0–100 point range for ease of interpretation, with higher scores indicating better health. The development and validation process for these scores has been fully described previously.13
Analysis
We used afive-step approach to describe the sample and its
sleep duration trends. Using only thefirst observed
ques-tionnaire-diary pair for each participant, we calculated the baseline distributions of all variables and we measured the mean self-reported sleep durations for the diary and ques-tionnaire for all time periods (overall, weekday, and
week-end). Welch's two-samplet-tests evaluated the difference
between mean diary- and questionnaire-reported sleep durations for each time period, and Pearson correlation coefficients and Spearman’s rank correlation coefficients measured the relationship between diary- and question-naire-reported sleep durations for each time period. Using all observed questionnaire-diary pairs (ie including multiple questionnaire-diary pairs per participant, if available) we generated overlapping histograms of overall diary- and questionnaire-reported sleep durations, and we generated overlapping density plots of diary-to-questionnaire sleep
Nature and Science of Sleep downloaded from https://www.dovepress.com/ by 118.70.13.36 on 24-Aug-2020
duration ratios by time period (seesupplemental appendix for overlapping density plots). We calculated diary-to-ques-tionnaire ratios by dividing an observation’s diary-reported sleep duration by its questionnaire-reported sleep duration for a given time period.
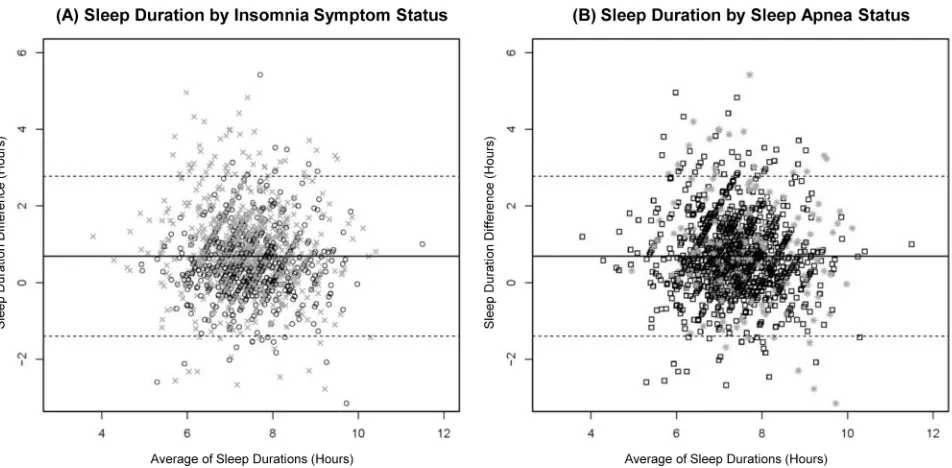
We employed a three-step approach to determine whether insomnia symptoms or sleep apnea were associated with diary-questionnaire differences in sleep duration. First, Bland-Altman graphs plotted the average of the diary- and questionnaire-reported durations against the difference between the two durations, and plot points were symboli-cally coded by insomnia symptoms and sleep apnea status, respectively. Second, we built a series of linear mixed effects regression models to identify factors associated with diary-questionnaire differences in sleep durations. Model 1A adjusted for any insomnia symptoms, sleep apnea, sex, body mass index, smoking status, SF-12 Physical Health Composite Score, and SF-12 Mental Health Composite score. The model included squared-terms for age and body mass index to account for nonlinear relationships with sleep duration differences. Models 1B and 1C replicated 1A, except 1B excluded sleep apnea and 1C excluded any insomnia symptoms. This accounted for potential over-control by including multiple sleep-related disorder variables. Models 2A and 2B replicated 1A and 1B, respectively, except they included insomnia days per month instead of any insomnia symptoms. All models included random intercepts at the participant level.
We set statistical significance for all analyses at the 5% level and calculated 95% two-sided profile confidence inter-vals. We conducted the statistical analyses in R 3.4.4,14and we used two R packages for linear mixed-effects modeling in
this analysis: lme4 and lmeTest.15,16 The University of
Wisconsin Health Sciences Institutional Review Board approved study protocols and informed consent documents.
Results
Baseline results
At baseline observation for each participant, approximately 58% of the sample reported at least one insomnia symptom with a mean (standard deviation, SD) 21.3 (18.7) insomnia days per month, and about 17% of the sample reported sleep apnea (Table 1). Respondents at baseline observation were generally middle-aged or older, and about half of the sample was female. A little less than half of the sample were current smokers at baseline observation, and the average body mass
index was near the threshold of obesity (30 kg/m2). On a
range of 0–100 points, the average SF-12 physical health
score and the average SF-12 mental health score were 48 (10) points and 52 (9) points, respectively. Both SF-12 scores for this sample are comparable to those of similarly aged populations.17
The mean (SD) overall reported sleep durations for the diary and for the questionnaire at baseline were 7.76 (1.01) hours and 7.07 (1.04) hours, respectively, with a 0.69 hr
(41 min) mean difference (95% confidence interval (CI):
0.62, 0.76 hrs) (Table 2). Overlapping histograms of diary-and questionnaire-reported overall sleep durations for baseline questionnaire-diary observations revealed some-what similar distributions (Figure 1). Of note, the histo-gram for questionnaire-reported sleep duration exhibited binning at the half hour-level, suggesting that participants may round their sleep estimates to the nearest half hour. Mean sleep durations at baseline were shorter for week-days and longer for weekends regardless of reporting method, and mean questionnaire-reported durations were consistently shorter than mean diary-reported durations. Relative to the overall mean difference in diary- and questionnaire-reported baseline sleep duration,
weekday-specific mean difference was similar (0.73 hrs, 95% CI:
0.65, 0.81), whereas the weekend-specific mean difference
was somewhat smaller (0.60 hrs, 95% CI: 0.51, 0.68 hrs).
The Pearson correlation coefficients exhibit a
mod-erate positive relationship between diary- and
Table 1Baseline characteristics of analyzed participants in the retirement and sleep trajectories study (n=1,516)
Variable Mean (SD)
or Percenta
Any insomnia symptomsb(%) 57.78
Insomnia days per monthc 21.26 (18.72)
Self-reported sleep apnea (%) 17.22
Age (years) 63.0 (6.89)
Female (%) 53.03
Current smoker (%) 45.84
Body mass index (kilograms/meters2) 29.48 (6.60)
SF-12 physical health score (points, range 0–100) 48.21 (10.22)
SF-12 mental health score (points, range 0–100) 51.69 (8.72)
Notes: a
Baseline characteristics are measured using the first of four potential questionnaire-diary pairs received from each participant. b
Four questionnaire items assessed insomnia symptoms (difficulty falling asleep; difficulty getting back to sleep; repeated nocturnal awakenings; early morning awakening), to which the respondent could report“never,” “rarely,” “sometimes,” “often,”or“almost always.” We considered responses of“often”or“almost always”to any item as reporting any insomnia symptom.c
Respondents estimated the number of symptomatic days in the last month for each insomnia symptom item (see superscriptb). The sum of these symptomatic days is the insomnia days per month.
Abbreviations:SD, standard deviation; SF-12, 12 Item Short Form Health Survey.
Nature and Science of Sleep downloaded from https://www.dovepress.com/ by 118.70.13.36 on 24-Aug-2020
questionnaire-reported sleep durations – 0.48 (95% CI: 0.44, 0.52) overall, 0.48 (95% CI: 0.44, 0.52) for
weekday-specific durations, and 0.39 (95% CI: 0.34,
0.43) for weekend-specific durations. Spearman’s rank
correlation coefficients were nearly identical. The
diary-to-questionnaire ratio of sleep duration was con-stant and demonstrated nearly identical patterns across time periods (Figure S1). For those reasons, we focus on diary-questionnaire differences in overall reported sleep duration for the remainder of this section.
Sleep-related predictors of
diary-questionnaire differences
Bland-Altman plots suggest minimal differences in diary-and questionnaire-reported sleep duration by insomnia symptom status or self-reported sleep apnea (Figure 2). However, mixed-effects regression models demonstrated that both the presence of any insomnia symptom and the number of insomnia symptom-days per month were
sig-nificantly and positively associated with differences
between diary- and questionnaire-reported sleep duration.
Table 2Self-reported sleep duration measures on the sleep diary and questionnaire among participants in the retirement and sleep trajectories study at baseline (n=1,516)a
Time Frame Sleep Diary (hours) Questionnaire (hours) Difference (hours)b
Mean (SD) Range Mean (SD) Range Mean (SE) 95% CI P-Valuec
Overall 7.76 (1.01) 4.00, 16.75 7.07 (1.04) 3.20, 11.30 0.69 (0.04) 0.62, 0.76 <0.001
Weekday 7.67 (1.08) 3.25, 16.75 6.94 (1.10) 2.50, 12.00 0.73 (0.04) 0.65, 0.81 <0.001
Weekend 8.03 (1.31) 1.50, 20.00 7.43 (1.16) 2.50, 12.00 0.60 (0.04) 0.51, 0.68 <0.001
Notes:a
Sleep durations were abstracted from thefirst of potentially four questionnaire-diary pairs received from each participant.b
Difference = (sleep diary-reported duration) - (questionnaire-reported duration).cDifference in mean self-reported sleep durations tested with Welch's two-samplet-tests of difference in means. Abbreviations:CI, confidence interval; SD, standard deviation; SE standard error.
Figure 1Histograms of baseline diary-reported and questionnaire-reported overall sleep durations in the retirement and sleep trajectories study (n=1,516)a. Key: Dark gray indicates questionnaire-reported sleep duration; light gray indicates sleep diary-reported sleep duration; dashed lines indicate the mean sleep duration for their respective measure. Each bar represents a 15 min block of sleep duration.aThere were 5,313 questionnaire-diary pairs for 1,516 study participants, and each participant returned at least one of potentially four questionnaire-diary pairs throughout the study duration. We used baseline questionnaire-diary pairs to generate the histograms.
Nature and Science of Sleep downloaded from https://www.dovepress.com/ by 118.70.13.36 on 24-Aug-2020
Having any insomnia symptoms was associated with a 0.28 hr (17 min) average increase in diary-reported sleep duration relative to the questionnaire-reported duration, regardless of whether we adjusted for self-reported sleep apnea (Table 3). Likewise, each insomnia day per month is associated with a 0.01 hr (0.6 min) average increase in diary-reported sleep duration relative to the questionnaire-reported duration (Table 4). A 10-day increase in insomnia days, for example, is related to an expected 6 min increase in the diary-to-questionnaire difference of reported sleep duration. Again, adjusting for self-reported sleep apnea did not alter the association between insomnia days per month and reported sleep duration difference. Self-reported sleep apnea was not significantly associated with diary-question-naire differences in reported sleep duration in any model. Therefore, there is no evidence of over-adjustment by including multiple sleep disorder-related variables.
Demographic predictors of
diary-questionnaire differences
Relative to male participants, female participants had a
consistent and statistically significant 7 to 8 min larger
difference between diary- and questionnaire-reported sleep duration. In contrast to the other predictors, there is
evidence of an association between SF-12 physical health score and the SF-12 mental health score with shorter diary-reported sleep. Specifically, a one-point increase in either score was associated with a 0.01 hr (0.6 min) shorter sleep duration on the diary compared to the questionnaire. There was no evidence that any other observed demo-graphic variables were associated with diary-questionnaire differences in reported sleep duration.
Discussion
To our knowledge, this is thefirst study to compare
sub-jective sleep duration between sleep diaries and
question-naires. The findings from our study suggest that sleep
diaries and questionnaires are comparable instruments for collecting self-reported sleep duration, although question-naires may elicit shorter self-reported sleep duration than diaries. Indeed, questionnaire-reported sleep durations were on average 40 mins shorter than diary-reported sleep dura-tions in our sample. Furthermore, questionnaire-reported durations exhibited a pattern of rounding to the nearest half-hour, whereas diary-reported sleep durations did not. This indicates that the diary elicits more precise data, sup-porting the conventional wisdom that the sleep diary is the
preferred mode for self-reported sleep duration.8Despite
Figure 2Bland-Altman plots of diary-reported and questionnaire-reported sleep durations by insomnia symptom status (A) and sleep apnea status in the retirement and sleep trajectories study (B) (n=5,313)a
. Key: Circles indicate“No insomnia symptoms”; x’s indicate“Any insomnia symptom”; squares indicate“No self-reported sleep apnea”; stars indicate“Self-reported sleep apnea”; solid lines indicate the mean sleep duration difference; dashed lines indicate plus or minus two standard deviations from the mean sleep duration difference. Average of Sleep Durations = (diary-reported overall sleep duration + questionnaire-reported overall sleep duration)/2. Sleep Duration Difference = (diary-reported overall sleep duration)– (questionnaire-reported overall sleep duration).aThere were 5,313 questionnaire-diary pairs for 1,516 study participants, and each participant returned at least one of potentially four questionnaire-diary pairs throughout the study duration.
Nature and Science of Sleep downloaded from https://www.dovepress.com/ by 118.70.13.36 on 24-Aug-2020
these differences, there was overlap in the distributions of diary-reported and questionnaire-reported sleep durations.
Our results partially corroborate our hypothesis that sleep-related disorders contribute to diary-questionnaire differences in reported sleep duration. Insomnia symptoms were associated with recording longer sleep duration on the diary compared to the questionnaire; the adjusted mean (standard error) diary-questionnaire difference for persons with no insomnia symptoms was 34.44 (2.11) minutes and the mean difference for those with any insomnia symptoms was 51.48 (2.04) minutes. Additionally, for every 10 insom-nia symptom-days per month, an additional 6 mins of sleep were reported on the diary compared to the questionnaire. However, there was no evidence that self-reported sleep apnea was related to differences in reported sleep duration between the sleep diary and the questionnaire.
In contrast to our hypothesis, we found evidence that some observed demographic variables were associated with
diary-questionnaire differences in reported sleep duration. Being female was associated with a 7 to 8 min greater difference between diary- and questionnaire-reported sleep duration. It is unclear why sex would predict differences in subjective sleep duration between diaries and questionnaires. A wealth of clinical, epidemiological, and sociological literature estab-lishes that, on average, women report longer sleep duration
than men,18but this would not explain discordance between
different subjective sleep duration measures. Perhaps sleep onset latency–the duration between“lights out”(the time of first attempted initiation of sleep) and actual sleep onset19– provides insight into this difference. Recent literature suggests that women report longer sleep onset latency relative to men.20 Rather than recording the time at which they fell asleep in their sleep diaries, participants may have recorded the time at which they initiated the ritual of sleep (ie, getting into bed, turning off the lights, etc.). If participants responded to questionnaires in such a way that it did not capture sleep onset latency–that is,
Table 3Demographic predictors of the difference between diary-reported and questionnaire-reported overall sleep duration in the retirement and sleep trajectories study, with dichotomous insomnia exposure (n=1,516)
Variable Model 1A Model 1B Model 1C
β, hoursa 95% CI β, hoursa 95% CI β, hoursa 95% CI
Any insomnia symptomb
No Referent Referent
Yes 0.28*** 0.22, 0.33 0.28*** 0.23, 0.34
Self-reported sleep apnea
No Referent Referent
Yes 0.06 −0.05, 0.16 0.04 −0.06, 0.15
Age (years) 0.00 −0.07, 0.08 0.00 −0.08, 0.08 0.01 −0.07, 0.10
Age2(years2) 0.00 −0.00, 0.00 0.00 −0.00, 0.00 −0.00 −0.00, 0.00
Sex
Male Referent Referent Referent
Female 0.13** 0.05, 0.21 0.13** 0.05, 0.21 0.13** 0.05, 0.21
BMI (kg/m2) 0.01 −0.02, 0.04 0.01 −0.02, 0.04 0.01 −0.03, 0.04
BMI2((kg/m2)2) −0.00 −0.00, 0.00 −0.00 −0.00, 0.00 −0.00 −0.00, 0.00
Current smoker
No Referent Referent Referent
Yes 0.05 −0.03, 0.13 0.05 −0.03, 0.13 0.05 −0.03, 0.13
SF-12 physical health score (points) −0.01*** −0.01,−0.00 −0.01*** −0.01,−0.00 −0.01*** −0.01,−0.01
SF-12 mental health score (points) −0.01*** −0.01,−0.01 −0.01*** −0.01,−0.01 −0.01*** −0.01,−0.01
Notes:*P-value <0.05 **P-value <0.01 ***P-value <0.001.aThe beta coefficient is the estimated average incremental difference between diary-reported sleep duration and
questionnaire-reported sleep duration in hours per unit change in predictor variables (difference = sleep durationdiary–sleep durationquestionnaire). b
Four questionnaire items assessed insomnia symptoms (difficulty falling asleep; difficulty getting back to sleep; repeated nocturnal awakenings; early morning awakening), to which the respondent could report“never,” “rarely,” “sometimes,” “often,”or“almost always.”We considered responses of“often”or“almost always”to any item as reporting any insomnia symptom. Abbreviations:β, beta coefficient; BMI, body mass index; CI, profile confidence interval; kg, kilograms; m, meters; SE, standard error.
Nature and Science of Sleep downloaded from https://www.dovepress.com/ by 118.70.13.36 on 24-Aug-2020
participants reported only the time spent asleep, excluding the
time spent trying to fall asleep – then diary-questionnaire
differences in reported sleep duration will be greater for women relative to men.
Additionally, higher SF-12 physical and mental health scores were associated with marginally lower diary-reported sleep duration relative to the questionnaire-reported duration. This pattern is analogous to insomnia
symptoms’relation with diary-questionnaire differences in
sleep duration measurement. Compared to individuals with better self-reported health, those with worse self-reported health may report longer sleep duration on the diary relative to the questionnaire. This could translate to closer diary-questionnaire correspondence among healthier individuals. However, to the best of our knowledge, there is no prior empirical evidence that self-reported health predicts differ-ences between self-reported sleep duration measures.
If insomnia truly contributed to differences between diary-reported and questionnaire-reported sleep duration,
the exact mechanisms by which they affect differences is uncertain. Insomnia symptomatic individuals may have unusual and less predictable sleep habits relative to non-symptomatic individuals due to the nature of their disorder. In addition to altering sleep cycles, insomnia symptoms could act as stressors that worsen an individual’s ability to accurate perceive and, later, recall sleep state. A sleep diary could elicit more accurate information by requesting
speci-fic sleep and wake times for each reported cycle, which
encourages affected participants to be more aware of their atypical or varying sleep behaviors. Conversely, our sleep diary may over-report sleep duration relative to the ques-tionnaire, as it only collected sleep and wake times but not nocturnal awakenings. Insomnia-symptomatic adults, who may be prone to these awakenings, may consider this when reporting sleep duration on the questionnaire but not on the
diary. This hypothesis parallels findings from studies that
compared self-reported sleep durations from diaries or questionnaires to objective actigraphy measures, which
Table 4Demographic predictors of the difference between diary-reported and questionnaire-reported overall sleep duration in the retirement and sleep trajectories study, with insomnia days per month exposure (n=1,516)
Model 2A Model 2B Model 2Cb
Variable β, hoursa 95% CI β, hoursa 95% CI β, hoursa 95% CI
Insomnia days per monthc 0.01*** 0.01, 0.02 0.01*** 0.01, 0.02
Self-reported sleep apnea
No referent referent
Yes 0.08 -0.02, 0.18 0.04 -0.06, 0.15
Age (years) -0.00 -0.08, 0.07 -0.00 -0.08, 0.07 0.01 -0.07, 0.09
Age2(years2) 0.00 -0.00, 0.00 0.00 -0.00, 0.00 -0.00 -0.00, 0.00
Sex
Male referent referent referent
Female 0.12** 0.05, 0.20 0.12** 0.04, 0.20 0.13** 0.05, 0.21
BMI (kg/m2) 0.01 -0.02, 0.04 0.01 -0.02, 0.04 0.01 -0.03, 0.04
BMI2((kg/m2)2) -0.00 -0.00, 0.00 -0.00 -0.00, 0.00 -0.00 -0.00, 0.00
Current smoker
No referent referent referent
Yes 0.04 -0.03, 0.12 0.05 -0.03, 0.12 0.05 -0.03, 0.13
SF-12 physical health score (points) -0.00** -0.01, -0.00 -0.01** -0.01, -0.00 -0.01*** -0.01, -0.01
SF-12 mental health score (points) -0.01** -0.01, -0.00 -0.01** -0.01, -0.00 -0.01*** -0.01, -0.01
Notes:*P-value <0.05 **P-value <0.01 ***P-value <0.001.aThe beta coefficient is the estimated average incremental difference between diary-reported sleep duration and
questionnaire-reported sleep duration in hours per unit change in predictor variables (difference = sleep durationdiary–sleep durationquestionnaire). b
Model 2C is equivalent to Model 1C, presented inTable 3.cFour questionnaire items assessed insomnia symptoms (difficulty falling asleep; difficulty getting back to sleep; repeated nocturnal
awakenings; early morning awakening). Respondents estimated the number of symptomatic days in the last month for each insomnia symptom item. The sum of these symptomatic days is the insomnia days per month.
Abbreviations:β, beta coefficient; BMI, body mass index; CI, profile confidence interval; kg, kilograms; m, meters; SE, standard error.
Nature and Science of Sleep downloaded from https://www.dovepress.com/ by 118.70.13.36 on 24-Aug-2020
found that poor sleep quality explained some over-reported duration on subjective measures relative to actigraphy.7,21 We cannot explore these hypotheses, as our study did not compare subjective sleep duration measures to objective measures.
Differential processes for recalling sleep duration may also contribute to variation between the diary and ques-tionnaire. Respondents only need to know sleep time and wake time for a given cycle to complete the diary. Assuming daily adherence, the cognitive burden for using the sleep diary is low. In contrast, questionnaire
respondents need to consider what qualifies as a typical
sleep cycle, compute the difference between a sleep onset and wake time, and average those sleep durations in their
final reported average duration estimates. Differences in
these processes for reporting sleep duration may give rise to divergent self-reported sleep durations.
These findings highlight some implications for using
diaries or questionnaires for eliciting sleep duration. Diary- and questionnaire-reported sleep durations were rea-sonably comparable among non-insomnia symptomatic respondents, so questionnaires may be less expensive and less burdensome in measuring self-reported sleep durations in unaffected populations. However, questionnaires were disproportionately prone to rounding at the half-hour. It is unknown whether this measurement bias is random or sys-tematic. Random rounding would reduce the precision of sleep duration estimates but not bias them, whereas sys-tematic rounding would induce bias, which is problematic if using questionnaire-reported sleep duration to identify fac-tors associated with sleep duration.22Careful questionnaire design, such as providing instructions in questionnaires to estimate sleep time to the nearest 5 or 10 mins, may prevent excessive rounding. Otherwise, sleep diaries may be pre-ferred to minimize measurement error via rounding.
It is important to consider this study’s limitations. First, the generalizability of thesefindings may be limited due to
the sample’s homogeneity. REST participants are current
or former Wisconsin state employees, most of whom have
stable incomes and adequate access to medical care.10,11
Sleep diary-questionnaire comparability may vary in other populations, particularly in populations with more limited access to medical care for sleep-related disorders. Second, there may be a spillover effect between sleep diaries and questionnaires. Participants completed diaries and ques-tionnaires close in time, so diary responses may have informed questionnaire responses or vice-versa. We cannot
confirm that respondents would have reported the same
sleep durations on the questionnaire or the sleep diary if they only used one of the modes. Lastly, this study cannot speak to the objective or clinical accuracy of either mea-sure. We did not compare the diary or questionnaire to a gold standard objective sleep measure (e.g., polysomno-graphy), so it is possible that the diary and questionnaire
are comparable but not valid. Likewise, these findings
cannot directly inform best practices for subjective sleep measurement in a clinical setting (for example, whether practitioners can use a sleep diary or questionnaire in diagnosing sleep-related disorders such as insomnia).
Conclusion
Sleep diaries and questionnaires obtain somewhat disparate self-reported sleep duration estimates, with diaries eliciting longer durations, on average. Insomnia symptoms may, in part, drive these differences, so the questionnaire and diary may be similarly valid instruments for self-reported sleep duration measurement in persons unaffected by insomnia. To lesser extents, sex and general self-reported health were associated with diary-questionnaire differences in reported sleep duration. Future research should investigate the mechanisms by which insomnia symptoms lead to diary-questionnaire differences, as well as other sources of poten-tial disagreement.
Ethics statement
All protocols and informed consent documents were approved by the University of Wisconsin-Madison Health Sciences Institutional Review Board (UW HS-IRB). All Wisconsin Sleep Cohort Study participants provide written informed consent for laboratory-based protocols. All Retirement and Sleep Trajectories (REST) Study
partici-pants–REST is an ancillary study of the Wisconsin Sleep
Cohort Study– additionally provided implied consent as
approved by UW HS-IRB according to this language that
accompanied the mailed REST surveys:“Your permission
is voluntary. If you wish to participate, a returned survey will be taken to indicate that you consent to participate. If you do not wish to participate, you can simply discard the surveys. You also may choose to participate but skip any
questions that you do not feel comfortable answering.”
Acknowledgments
The authors thank Jodi Barnet for preparing the data for analysis. This work was supported by US National Institutes of Health (NIH) grants 1R01AG036838, R01HL62252, and 1UL1RR02501.
Nature and Science of Sleep downloaded from https://www.dovepress.com/ by 118.70.13.36 on 24-Aug-2020
Author contributions
DCM conducted the literature review, co-developed the analysis plan, and wrote the original manuscript. MEK co-developed the analysis plan, conducted statistical analyses,
createdfigures, and revised the manuscript. EWH
co-man-aged the data acquisition, reviewed the analysis plan, and revised the manuscript. PEP developed the original research question, co-managed the data acquisition, reviewed the analysis plan, and revised the manuscript. All authors con-tributed to data analysis, drafting and revising the article, gavefinal approval of the version to be published, and agree to be accountable for all aspects of the work.
Disclosure
The authors report no conflicts of interest in this work.
References
1. Patel SR, Hu FB. Short sleep duration and weight gain: a systematic review.Obesity.2008;16(3):643–653. doi:10.1038/oby.2007.118 2. Gangwisch JE, Heymsfield SB, Boden-Albala B, et al. Short sleep
duration as a risk factor for hypertension: analyses of thefirst national health and nutrition examination survey. Hypertension. 2006;47 (5):833–839. doi:10.1161/01.HYP.0000217362.34748.e0
3. Gottlieb DJ, Punjabi NM, Newman AB, et al. Association of sleep time with diabetes mellitus and impaired glucose tolerance. Arch Intern Med.2005;165(8):863–867. doi:10.1001/archinte.165.8.863 4. Cappuccio FP, D’Elia L, Strazzullo P, Miller MA. Sleep duration and
all-cause mortality: a systematic review and meta-analysis of prospec-tive studies.Sleep.2010;33(5):585–592. doi:10.1093/sleep/33.5.585 5. Penzel T, Conradt R. Computer based sleep recording and analysis.
Sleep Med Rev.2000;4(2):131–148. doi:10.1053/smrv.1999.0087 6. Sadeh A. The role and validity of actigraphy in sleep medicine: an
update. Sleep Med Rev. 2011;15(4):259–267. doi:10.1016/j. smrv.2010.10.001
7. Van Den Berg JF, Van Rooij FJ, Vos H, et al. Disagreement between subjective and actigraphic measures of sleep duration in a population-based study of elderly persons. J Sleep Res. 2008;17(3):295–302. doi:10.1111/j.1365-2869.2008.00638.x
8. Carney CE, Buysse DJ, Ancoli-Israel S, et al. The consensus sleep diary: standardizing prospective sleep monitoring. Sleep. 2012;35 (2):287–302. doi:10.5665/sleep.1642
9. Thurman SM, Wasylyshyn N, Roy H, et al. Individual differences in compliance and agreement for sleep logs and wrist actigraphy: a longitudinal study of naturalistic sleep in healthy adults.PLoS One. 2018;13(1):e0191883. doi:10.1371/journal.pone.0191883
10. Young T. Rationale, design, andfindings from the wisconsin sleep cohort study: toward understanding the total societal burden of sleep-disordered breathing.Sleep Med Clin.2009;4(1):37–46. doi:10.1016/ j.jsmc.2008.11.003
11. Harden CChanges in Self-Reported Napping Behaviors Across the Retirement Transition [dissertation]. Madison, WI: University of Wisconsin-Madison;2017.
12. Young T, Palta M, Dempsey J, Skatrud J, Weber S, Badr S. The occur-rence of sleep-disordered breathing among middle-aged adults.N Engl J Med.1993;328(17):1230–1235. doi:10.1056/NEJM199304293281704 13. Ware J, Kosinski M, Keller SM. A 12-item short-form health survey:
construction of scales and preliminary tests of reliability and validity.Med Care.1996;34(3):220–233. doi:10.1097/00005650-199603000-00003 14. R Core Team. R: A Language and Environment for Statistical
Computing. Vienna, Austria: R Foundation for Statistical Computing; 2018.
15. Bates D, Maechler M, Bolker B, Walker S. Fitting linear mixed-effects models using lme4. J Stat Softw. 2015;67(1):1–48. doi:10.18637/jss.v067.i01
16. Kuznetsova A, Brockhoff PB, Christensen RHB. lmerTest package: tests in linear mixed effects models.J Stat Softw.2017;82(13):1–26. doi:10.18637/jss.v082.i13
17. Office of Public Health Assessment. Health Status in Utah: the Medical Outcomes Study SF-12. Salt Lake City, UT: Utah Department of Health;2004.
18. Burgard SA, Ailshire JA. Gender and time for sleep among U.S. adults.
Am Sociol Rev.2013;78(1):51–69. doi:10.1177/0003122412472048 19. Cajochen C, Kräuchi K, Danilenko KV, Wirz-Justice A. Evening
administration of melatonin and bright light: interactions on the EEG during sleep and wakefulness.J Sleep Res.1998;7(3):145–157. 20. Ohayon MM, Reynolds CF, Dauvilliers Y. The link between excessive quantity of sleep and deteriorated quality wakefulness–implications for the DSM-5.Ann Neurol.2013;73(6):785–794. doi:10.1002/ana.23818 21. Lauderdale DS, Knutson KL, Yan LL, Liu K, Rathouz PJ. Sleep
duration: how well do self-reports reflect objective measures? The CARDIA sleep study.Epidemiol.2008;19(6):838–845. doi:10.1097/ EDE.0b013e318187a7b0
22. Kan YK, Pudney S. Measurement error in stylized and diary data on time use.Sociol Methodol.2008;38(1):101–132. doi:10.1111/j.1467-9531.2008.00197.x
Nature and Science of Sleep
Dovepress
Publish your work in this journal
Nature and Science of Sleep is an international, peer-reviewed, open access journal covering all aspects of sleep science and sleep med-icine, including the neurophysiology and functions of sleep, the genetics of sleep, sleep and society, biological rhythms, dreaming, sleep disorders and therapy, and strategies to optimize healthy sleep.
The manuscript management system is completely online and includes a very quick and fair peer-review system, which is all easy to use. Visit http://www.dovepress.com/testimonials.php to read real quotes from published authors.
Submit your manuscript here:https://www.dovepress.com/nature-and-science-of-sleep-journal
Nature and Science of Sleep downloaded from https://www.dovepress.com/ by 118.70.13.36 on 24-Aug-2020