Protocol
Pseudotype Neutralization Assays: From Laboratory
Bench to Data Analysis
Francesca FerraraID and Nigel Temperton *ID
Viral Pseudotype Unit, Medway School of Pharmacy, The Universities of Greenwich and Kent at Medway, Chatham ME4 4TB, UK; [email protected]
* Correspondence: [email protected]; Tel.: +44-(0)1634-202957
Received: 11 December 2017; Accepted: 16 January 2018; Published: 22 January 2018
Abstract:Pseudotype neutralization assays are powerful tools to study functional antibody responses against viruses in low biosafety laboratories. However, protocols described in the literature differ widely with respect to material, reagents, and methods used to perform these assays and to analyse the raw data generated. This could result in discrepancies between the results of different laboratories even when the same pseudotypes and the same samples are analysed. Here, we describe, in detail, an experimental protocol to perform pseudotype neutralization assays using lentiviral pseudotypes bearing influenza haemagglutinin and expressing firefly luciferase. We also present the steps necessary to analyse the data and calculate the half maximal inhibitory concentration of the sera analysed. This protocol will provide support for the validation and the standardization of the pseudotype neutralization assay for influenza virus serology. Additionally, it will provide a starting point for the development of pseudotype neutralization assays using pseudotypes bearing other viral envelope proteins.
Keywords:influenza; pseudotypes; serology; lentiviral vector; antibodies; neutralization
1. Introduction
Neutralization assays are powerful tools to study human and animal antibody responses against viruses elicited by vaccination or natural exposure [1]. These assays routinely require the use of wild-type viruses, and this limits their application when highly pathogenic human viruses are studied. However, replication-deficient viruses can often be used as a safe alternative. When enveloped viruses are studied, gammaretroviral and lentiviral vectors pseudotyped with the viral glycoproteins of interest [2] are a feasible substitute for viruses. Numerous lentiviral vectors harboring glycoproteins of different viruses have been described in the literature, and some of them have been used in neutralization assays [3,4]. For example, the use of pseudotyped lentiviral vectors as surrogate antigens in neutralization assays is extremely useful in influenza research. Influenza pseudotype neutralization assays are a safe alternative when potentially pandemic viruses need to be studied [5]. Furthermore, they have been shown to have a high sensitivity in detecting antibodies directed against the stalk of influenza envelope glycoprotein, the haemmaglutinin [6]. These antibodies are the ones that new influenza universal vaccination candidates are intended to elicit [7]. Extended information on influenza pseudotype neutralization assay variables has recently been systematically reviewed [8]. However, a standard operating procedure-like protocol is not yet available in the literature, limiting the application and standardization of this assay. Here we present a detailed protocol to perform pseudotype neutralization assays, using influenza haemagglutinin-enveloped HIV pseudotypes carrying a firefly luciferase reporter. The use of such a reporter results in a wide dynamic range of neutralization titres and a high level of sensitivity. The alternative green fluorescent protein (GFP) reporter would necessitate either a 96-well flow cytometer, or the counting of green “transduced” cells with a fluorescence
Methods and Protoc.2018,1, 8 2 of 16
microscope. This protocol was designed to be easily adapted to other lentiviral pseudotype platforms, and will provide support for the validation and the standardization of the pseudotype neutralization assay for influenza virus serology. The data from this assay can be harmonized with that obtained by other neutralization assays, by making use of common reference reagents, such as those available from the National Institute for Biological Standards and Control (NIBSC) and the World Organisation for Animal Health (OiE). Additionally, this protocol will provide a starting point for the development of pseudotype neutralization assays using lentiviral pseudotypes bearing other viral envelope proteins.
2. Experimental Design
2.1. General Considerations
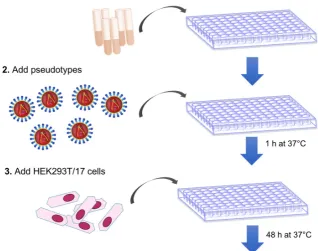
The pseudotype neutralization assay, here described, is a cell-based viral neutralization assay that is performed in a 96-well format.
Figure 1 is a schematic representation of the main assay steps. Similar to a traditional microneutralization assay, different concentrations of antibodies or sera are incubated with cells and pseudotype particles. The pseudotype lentiviral particles used for this assay encode firefly luciferase in their lentiviral vector genome. When their genome integrates after entry into cells, firefly luciferase expression and activity is proportional to the number of cells that were transduced.
Methods Protoc. 2018, 1, 8 2 of 16
of green “transduced” cells with a fluorescence microscope. This protocol was designed to be easily adapted to other lentiviral pseudotype platforms, and will provide support for the validation and the standardization of the pseudotype neutralization assay for influenza virus serology. The data from this assay can be harmonized with that obtained by other neutralization assays, by making use of common reference reagents, such as those available from the National Institute for Biological Standards and Control (NIBSC) and the World Organisation for Animal Health (OiE). Additionally, this protocol will provide a starting point for the development of pseudotype neutralization assays using lentiviral pseudotypes bearing other viral envelope proteins.
2. Experimental Design
2.1. General Considerations
The pseudotype neutralization assay, here described, is a cell‐based viral neutralization assay that is performed in a 96‐well format.
Figure 1 is a schematic representation of the main assay steps. Similar to a traditional microneutralization assay, different concentrations of antibodies or sera are incubated with cells and pseudotype particles. The pseudotype lentiviral particles used for this assay encode firefly luciferase in their lentiviral vector genome. When their genome integrates after entry into cells, firefly luciferase expression and activity is proportional to the number of cells that were transduced.
Methods and Protoc.2018,1, 8 3 of 16
After 48 h incubation, to permit cell transduction of non-neutralized particles and expression of firefly luciferase, cells are lysed in the presence of a luciferase substrate to assess luciferase activity. The comparison between the luciferase signals detected in untransduced cells, in cells transduced with pseudotypes only, and in cells transduced with pseudotypes in the presence of serum, will enable one to determine if that serum has neutralization activity against the pseudotype tested.
2.2. Materials
• 12-channel micro-pipette
• 8-channel micro-pipette
• Pipettes (10–200µL)
• 200 µL MultiGuard NX Barrier tips (Sorenson BioScience, Salt Lake City, UT, USA; Cat. no.: 30550T)
• 20µL MultiGuard Barrier tips (Sorenson BioScience; Cat. no. 35220)
• 10µL MultiGuard E Barrier tips (Sorenson BioScience; Cat. no. 15020T)
• Dulbecco’s Modified Eagle Medium (DMEM) with high glucose and GlutaMAX (Thermo Fisher Scientific Inc., Waltham, MA, USA; Cat. no.: 31966-021; or Sigma-Aldrich, St. Louis, MO, USA; Cat. no.: D6429; or PAN Biotech, Aidenbach, Bavaria, Germany; Cat. no.: P04 04510)
• Fetal Bovine Serum (FBS; Thermo Fisher Scientific Inc.; Cat. no.: 10500-064; or PAN Biotech; Cat. no.: P30 8500)
• Penicillin/streptomycin (Sigma-Aldrich; Cat. No: P4333).
• 0.05% (w/v) Trypsin 0.53 mM EDTA solution (Sigma-Aldrich; Cat. no.: T3924; or PAN Biotech; Cat. no.: P10 040100)
• Nunc F96 MicroWell white polystyrene plates (Thermo Fisher Scientific Inc.; Cat. no.: 136101)
• Reagent reservoirs (Corning Inc., Corning, NY, USA; Cat. no.: 4870; or Dutscher Scientific, Brumath, France; Cat. no.: 006793)
• Influenza pseudotyped lentiviral vectors encoding Firefly luciferase with known titer expressed as Relative Luminescence Units (RLU)/mL [8–10]
• Positive control sera (appropriate for the pseudotyped lentiviral vectors used, see Section2.6)
• Negative control sera (appropriate for the pseudotyped lentiviral vectors used, see Section2.6)
• Bright Glo Luciferase Assay System (Promega, Madison, WI, USA; Cat. no.: E2650)
2.3. Cell Line
For influenza pseudotype neutralization, we used HEK293T/17 cells (ATCC, CRL11268) as target cell lines [9]. If necessary, the assay can be modified to allow the use of a different cell line (MDCK for example); in such cases, the lentiviral vector input and number of cells used should be optimized.
HEK293T/17 cells used for the assay should be cultured and maintained in DMEM with high glucose and GlutaMAX and with 15% (v/v) FBS and 1% (v/v) penicillin/streptomycin. We recommend performing HEK293T/17 cell subculture, keeping the ratios and days of subculture constant. In general, cells can be subcultured, depending on cell growth of the particular batch and the vessel used, on Monday and Wednesday, at ratios of 1:4 or 1:5, and on Friday, at ratios of 1:8 or 1:10. If cells are thawed gently and a good recovery and viability is observed after thawing, the assay can be performed with cells from passage 2. Cells are usually kept in culture and used for 3–4 months (equivalent to passage 36–40). In any case, if changes in cell morphology or growth are observed, the cell batch should be discarded, and a new vial should be thawed.
Methods and Protoc.2018,1, 8 4 of 16
2.4. Equipment and Software
• GloMax Multi detection system luminometer (Promega; Cat. no.: E7031 and E7041) or equivalent
• Centrifuge for 96-well plates
• Humidified CO2Incubator
• Biological Safety Cabinet
• Automated cell counter (Bio-Rad Laboratories Inc., Hercules, CA, USA; Cat. no.: 1450102) or cell counting chamber slides
• VACUSIP (INTEGRA Biosciences, Hudson, NH, USA; Cat. no.: 159000) or vacuum pump or similar instrument (optional)
• GraphPad Prism version 6 Software (GraphPad Software Inc., La Jolla, CA, USA)
2.5. Plate Format
In Figure 2, we report the plate format that is used in the pseudotype neutralization protocol described.
A serial dilution of 1:2 of an appropriate positive control (serum or antibodies) that can neutralize the pseudotype that will be used in the assay is included in each plate, to check that the pseudotype used is correctly neutralized. Isotype control antibodies or serum are also included and diluted, to verify that non-specific neutralization/non-specific background signal is not detected.
In this protocol, we will show the calculation for one plate. If more than nine samples need to be analyzed and multiple plates are necessary, multiply the calculation here reported, using a factor corresponding to the number of plates required.
To maintain adequate reagent volumes and make pipetting more straightforward, we recommend doing all the calculations with an assumption of 100 wells for each plate.
Methods Protoc. 2018, 1, 8 4 of 16
GloMax Multi detection system luminometer (Promega; Cat. no.: E7031 and E7041) or equivalent
Centrifuge for 96‐well plates
Humidified CO2 Incubator
Biological Safety Cabinet
Automated cell counter (Bio‐Rad Laboratories Inc., Hercules, CA, USA; Cat. no.: 1450102) or cell counting chamber slides
VACUSIP (INTEGRA Biosciences, Hudson, NH, USA; Cat. no.: 159000) or vacuum pump or similar instrument (optional)
GraphPad Prism version 6 Software (GraphPad Software Inc., La Jolla, CA, USA)
2.5. Plate Format
In Figure 2, we report the plate format that is used in the pseudotype neutralization protocol described.
A serial dilution of 1:2 of an appropriate positive control (serum or antibodies) that can neutralize the pseudotype that will be used in the assay is included in each plate, to check that the pseudotype used is correctly neutralized. Isotype control antibodies or serum are also included and diluted, to verify that non‐specific neutralization/non‐specific background signal is not detected.
In this protocol, we will show the calculation for one plate. If more than nine samples need to be analyzed and multiple plates are necessary, multiply the calculation here reported, using a factor corresponding to the number of plates required.
To maintain adequate reagent volumes and make pipetting more straightforward, we recommend doing all the calculations with an assumption of 100 wells for each plate.
Figure 2. Pseudotype neutralization assay 96‐well plate format. Colour gradients represent dilution
of the serum samples down the plate. Usually, a 1:2 serial dilution starting with 1:40 or 1:80 is used.
2.6. Sera
Common, commercially available sera, neutralizing the influenza virus of the strain and subtype of interest, can be used as positive controls in a research‐based setting. For negative controls,
Methods and Protoc.2018,1, 8 5 of 16
2.6. Sera
Common, commercially available sera, neutralizing the influenza virus of the strain and subtype of interest, can be used as positive controls in a research-based setting. For negative controls, commercially available serum of naïve animals or isotype controls that does not possess influenza virus neutralization activity can be used. If using commercially available monoclonal antibodies that can neutralize multiple strains of influenza virus (e.g., C179 Takara Bio USA Inc., Mountain View, CA, USA; Cat. no.: M145), it should be kept in consideration that their half maximal inhibitory concentration (IC50) in this assay is lower than in classic neutralization assays.
Human sera, or sera from different animal origins can be used in this assay. Sera treatment, such as heat inactivation, can be performed and usually does not affect the assay results. Other treatments, such as receptor destroying enzymes, were not tested.
3. Procedure
3.1. Assay Set-Up. Time for Completion: 2:30 h
1. Before performing the assay, calculate the amount of influenza pseudotyped lentiviral vector that will be used.
a. Firstly, calculate how many RLU are required for one assay, performed in one plate. In each well, we recommend a virus input that results in 1×10⁶RLU:
1×106RLU×100wells=1×10⁸RLU
b. Therefore, the volume of pseudotype (P) that should be used is calculated, as shown below:
P= 1×10
8RLU
pseudotype titre(RLU/mL)
c. Considering that pseudotypes are added to each well at a volume of 50µL for one plate, 5 mL (50µL×100) of pseudotype suspension should be prepared by adding to the volume calculated in b., bringing the complete medium to a total volume of 5 mL.
2. Add 50µL of complete medium to A1, B1, C1, D1. 3. Add 100µL to E1, F1, G1, H1 (Cell only control).
4. Add 50µL of medium to B2-H12 (A2–A12 should remain empty in this step). 5. Add 5µL (or 2.5µL or 2µL or less) of each serum sample to wells A2 to A10.
Note: if the same serum will be analyzed multiple times to obtain technical replicates, we advise putting the replicates in adjacent columns to simplify the subsequent analysis.
6. Add to A11, the same amount (5µL or 2.5µL or 2µL or less) of positive control serum and to A12, the same amount of negative control serum.
7. Make volume up to 100µL with the complete medium in A2–A12. 8. OPTIONAL STEPSpin the plate in a centrifuge for 1 min at 500×g.
9. Take 50µL from wells A2–A12 (samples and serum control) and serially dilute down the plate (from A to H) using a 12-channel pipettor.
10. Spin the plate in a centrifuge for 1 min at 500×g.
11. In a new reservoir, prepare the pseudotyped lentiviral vector on the basis of the calculation performed in step 1: add the pseudotype volume and then the complete medium, to give a final volume of 5 mL. Mix by gently moving the reservoir and by pipetting up and down with the multichannel pipette.
Methods and Protoc.2018,1, 8 6 of 16
A1, B1, C1 and D1 will be the pseudotype only (no sera) control.
Methods Protoc. 2018, 1, 8 6 of 16
CRITICAL STEP Do not use tubes to prepare the cell suspension as HEK293T/17 can tend to clump, and this could result in a non‐homogenous cell suspension. Keep cells in the tissue culture dish during the preparation of the cell suspension.
a. Remove media from a 95–100% confluent HEK293T/17 cell dish.
b. To wash the cells and neutralize remaining serum, add 2 mL of Trypsin‐EDTA, and then remove it.
c. Add 2 mL of Trypsin‐EDTA.
d. Incubate the dish for 5 min at 37 °C and 5% CO2.
e. Neutralize the Trypsin‐EDTA by adding 6 mL of complete medium.
f. Resuspend carefully, until a single cell suspension is obtained (this can require 2–3 min). g. Count the HEK293T/17 cells, using an appropriate cell counting chamber slide under the
microscope, or a cell counter, following the manufacturer’s instructions. A concentration, expressed as cells/mL, should be obtained.
h. Calculate the cells needed for one assay plate:
1.5 10 100 1.5 10
i. Calculate the volume of cell suspension for one assay plate:
50 100 5000 5
j. Calculate the volume (x) of HEK293T/17 cells for assay cell suspension:
1.5 10
293 17⁄ /
k. Resuspend the HEK293T/17 cells in the dish and then add the volume of cells calculated (x) to a clean and sterile reservoir.
l. Add the volume of complete medium needed to reach a total volume of 5 mL. m. Mix by moving the reservoir back and forward.
16. After careful mixing of the assay cell suspension by pipetting up and down, add 50 μL of HEK293T/17 cell suspension to each well of the assay plate that was removed from the incubator.
CRITICAL STEP To avoid carry over, change tips for each column or row of the plates when adding the cells.
17. Spin the plate in a centrifuge for 1 min at 500× g. 18. Incubate plate for 48 h at 37 °C and 5% CO2.
3.2. Firefly Luciferase Read‐Out. Time for Completion: 15 min
19. Assay firefly luciferase RLU, using a Promega GloMax Multi detection system luminometer or equivalent.
a. Remove plate from the incubator.
b. Add 50 μL of Bright‐Glo, reconstituted following the manufacturer’s instructions, to each well of the 96‐well plate.
c. Incubate for 5 minutes at room temperature.
d. Read, using the Bright‐Glo protocol, pre‐installed on the GloMax Multi detection system luminometer (or alternative machine, using readily available settings for firefly luciferase). e. Export the data onto a USB stick for further analysis on a PC.
OR
f. Remove plate from the incubator.
g. Remove the medium from each well of the plate (vacuum pump or similar instrument). CRITICAL STEP To avoid carry over, change the tips for each column or row of the plates when removing the media.
CRITICAL STEPTo avoid carry over, change tips for each column or row of the plates when adding the pseudotyped lentiviral vector.
13. Spin the plate in a centrifuge for 1 min at 500×g. NOTE: Manual mixing is not required after this step.
14. Incubate the serum-pseudotype mix for 1 h at 37◦C and 5% CO2.
15. Fifteen minutes before the end of the 1-hour incubation time, prepare a HEK293T/17 cell suspension (assay cell suspension) directly in a sterile reservoir.
Methods Protoc. 2018, 1, 8 6 of 16
CRITICAL STEP Do not use tubes to prepare the cell suspension as HEK293T/17 can tend to clump, and this could result in a non‐homogenous cell suspension. Keep cells in the tissue culture dish during the preparation of the cell suspension.
a. Remove media from a 95–100% confluent HEK293T/17 cell dish.
b. To wash the cells and neutralize remaining serum, add 2 mL of Trypsin‐EDTA, and then remove it.
c. Add 2 mL of Trypsin‐EDTA.
d. Incubate the dish for 5 min at 37 °C and 5% CO2.
e. Neutralize the Trypsin‐EDTA by adding 6 mL of complete medium.
f. Resuspend carefully, until a single cell suspension is obtained (this can require 2–3 min). g. Count the HEK293T/17 cells, using an appropriate cell counting chamber slide under the
microscope, or a cell counter, following the manufacturer’s instructions. A concentration, expressed as cells/mL, should be obtained.
h. Calculate the cells needed for one assay plate:
1.5 10 100 1.5 10
i. Calculate the volume of cell suspension for one assay plate:
50 100 5000 5
j. Calculate the volume (x) of HEK293T/17 cells for assay cell suspension:
1.5 10
293 17⁄ /
k. Resuspend the HEK293T/17 cells in the dish and then add the volume of cells calculated (x) to a clean and sterile reservoir.
l. Add the volume of complete medium needed to reach a total volume of 5 mL. m. Mix by moving the reservoir back and forward.
16. After careful mixing of the assay cell suspension by pipetting up and down, add 50 μL of HEK293T/17 cell suspension to each well of the assay plate that was removed from the incubator.
CRITICAL STEP To avoid carry over, change tips for each column or row of the plates when adding the cells.
17. Spin the plate in a centrifuge for 1 min at 500× g. 18. Incubate plate for 48 h at 37 °C and 5% CO2.
3.2. Firefly Luciferase Read‐Out. Time for Completion: 15 min
19. Assay firefly luciferase RLU, using a Promega GloMax Multi detection system luminometer or equivalent.
a. Remove plate from the incubator.
b. Add 50 μL of Bright‐Glo, reconstituted following the manufacturer’s instructions, to each well of the 96‐well plate.
c. Incubate for 5 minutes at room temperature.
d. Read, using the Bright‐Glo protocol, pre‐installed on the GloMax Multi detection system luminometer (or alternative machine, using readily available settings for firefly luciferase). e. Export the data onto a USB stick for further analysis on a PC.
OR
f. Remove plate from the incubator.
g. Remove the medium from each well of the plate (vacuum pump or similar instrument). CRITICAL STEP To avoid carry over, change the tips for each column or row of the plates when removing the media.
CRITICAL STEPDo not use tubes to prepare the cell suspension as HEK293T/17 can tend to clump, and this could result in a non-homogenous cell suspension. Keep cells in the tissue culture dish during the preparation of the cell suspension.
a. Remove media from a 95–100% confluent HEK293T/17 cell dish.
b. To wash the cells and neutralize remaining serum, add 2 mL of Trypsin-EDTA, and then remove it.
c. Add 2 mL of Trypsin-EDTA.
d. Incubate the dish for 5 min at 37◦C and 5% CO2.
e. Neutralize the Trypsin-EDTA by adding 6 mL of complete medium.
f. Resuspend carefully, until a single cell suspension is obtained (this can require 2–3 min). g. Count the HEK293T/17 cells, using an appropriate cell counting chamber slide under the
microscope, or a cell counter, following the manufacturer’s instructions. A concentration, expressed as cells/mL, should be obtained.
h. Calculate the cells needed for one assay plate:
1.5×10⁴cells×100wells=1.5 ×10⁶cells i. Calculate the volume of cell suspension for one assay plate:
50µL×100wells=5000µL=5 mL
j. Calculate the volume (x) of HEK293T/17 cells for assay cell suspension:
x= 1.5×10
6cells
HEK293T/17cell concentration(cells/mL)
k. Resuspend the HEK293T/17 cells in the dish and then add the volume of cells calculated (x) to a clean and sterile reservoir.
l. Add the volume of complete medium needed to reach a total volume of 5 mL. m. Mix by moving the reservoir back and forward.
16. After careful mixing of the assay cell suspension by pipetting up and down, add 50 µL of HEK293T/17 cell suspension to each well of the assay plate that was removed from the incubator.
Methods Protoc. 2018, 1, 8 6 of 16
CRITICAL STEP Do not use tubes to prepare the cell suspension as HEK293T/17 can tend to clump, and this could result in a non‐homogenous cell suspension. Keep cells in the tissue culture dish during the preparation of the cell suspension.
a. Remove media from a 95–100% confluent HEK293T/17 cell dish.
b. To wash the cells and neutralize remaining serum, add 2 mL of Trypsin‐EDTA, and then remove it.
c. Add 2 mL of Trypsin‐EDTA.
d. Incubate the dish for 5 min at 37 °C and 5% CO2.
e. Neutralize the Trypsin‐EDTA by adding 6 mL of complete medium.
f. Resuspend carefully, until a single cell suspension is obtained (this can require 2–3 min). g. Count the HEK293T/17 cells, using an appropriate cell counting chamber slide under the
microscope, or a cell counter, following the manufacturer’s instructions. A concentration, expressed as cells/mL, should be obtained.
h. Calculate the cells needed for one assay plate:
1.5 10 100 1.5 10
i. Calculate the volume of cell suspension for one assay plate:
50 100 5000 5
j. Calculate the volume (x) of HEK293T/17 cells for assay cell suspension:
1.5 10
293 17⁄ /
k. Resuspend the HEK293T/17 cells in the dish and then add the volume of cells calculated (x) to a clean and sterile reservoir.
l. Add the volume of complete medium needed to reach a total volume of 5 mL. m. Mix by moving the reservoir back and forward.
16. After careful mixing of the assay cell suspension by pipetting up and down, add 50 μL of HEK293T/17 cell suspension to each well of the assay plate that was removed from the incubator.
CRITICAL STEP To avoid carry over, change tips for each column or row of the plates when adding the cells.
17. Spin the plate in a centrifuge for 1 min at 500× g. 18. Incubate plate for 48 h at 37 °C and 5% CO2.
3.2. Firefly Luciferase Read‐Out. Time for Completion: 15 min
19. Assay firefly luciferase RLU, using a Promega GloMax Multi detection system luminometer or equivalent.
a. Remove plate from the incubator.
b. Add 50 μL of Bright‐Glo, reconstituted following the manufacturer’s instructions, to each well of the 96‐well plate.
c. Incubate for 5 minutes at room temperature.
d. Read, using the Bright‐Glo protocol, pre‐installed on the GloMax Multi detection system luminometer (or alternative machine, using readily available settings for firefly luciferase). e. Export the data onto a USB stick for further analysis on a PC.
OR
f. Remove plate from the incubator.
g. Remove the medium from each well of the plate (vacuum pump or similar instrument). CRITICAL STEP To avoid carry over, change the tips for each column or row of the plates when removing the media.
CRITICAL STEPTo avoid carry over, change tips for each column or row of the plates when adding the cells.
17. Spin the plate in a centrifuge for 1 min at 500×g. 18. Incubate plate for 48 h at 37◦C and 5% CO2.
3.2. Firefly Luciferase Read-Out. Time for Completion: 15 min
Methods and Protoc.2018,1, 8 7 of 16
a. Remove plate from the incubator.
b. Add 50µL of Bright-Glo, reconstituted following the manufacturer’s instructions, to each well of the 96-well plate.
c. Incubate for 5 min at room temperature.
d. Read, using the Bright-Glo protocol, pre-installed on the GloMax Multi detection system luminometer (or alternative machine, using readily available settings for firefly luciferase). e. Export the data onto a USB stick for further analysis on a PC.
OR
f. Remove plate from the incubator.
g. Remove the medium from each well of the plate (vacuum pump or similar instrument).
Methods Protoc. 2018, 1, 8 6 of 16
CRITICAL STEP Do not use tubes to prepare the cell suspension as HEK293T/17 can tend to clump, and this could result in a non‐homogenous cell suspension. Keep cells in the tissue culture dish during the preparation of the cell suspension.
a. Remove media from a 95–100% confluent HEK293T/17 cell dish.
b. To wash the cells and neutralize remaining serum, add 2 mL of Trypsin‐EDTA, and then remove it.
c. Add 2 mL of Trypsin‐EDTA.
d. Incubate the dish for 5 min at 37 °C and 5% CO2.
e. Neutralize the Trypsin‐EDTA by adding 6 mL of complete medium.
f. Resuspend carefully, until a single cell suspension is obtained (this can require 2–3 min). g. Count the HEK293T/17 cells, using an appropriate cell counting chamber slide under the
microscope, or a cell counter, following the manufacturer’s instructions. A concentration, expressed as cells/mL, should be obtained.
h. Calculate the cells needed for one assay plate:
1.5 10 100 1.5 10
i. Calculate the volume of cell suspension for one assay plate:
50 100 5000 5
j. Calculate the volume (x) of HEK293T/17 cells for assay cell suspension:
1.5 10
293 17⁄ /
k. Resuspend the HEK293T/17 cells in the dish and then add the volume of cells calculated (x) to a clean and sterile reservoir.
l. Add the volume of complete medium needed to reach a total volume of 5 mL. m. Mix by moving the reservoir back and forward.
16. After careful mixing of the assay cell suspension by pipetting up and down, add 50 μL of HEK293T/17 cell suspension to each well of the assay plate that was removed from the incubator.
CRITICAL STEP To avoid carry over, change tips for each column or row of the plates when adding the cells.
17. Spin the plate in a centrifuge for 1 min at 500× g. 18. Incubate plate for 48 h at 37 °C and 5% CO2.
3.2. Firefly Luciferase Read‐Out. Time for Completion: 15 min
19. Assay firefly luciferase RLU, using a Promega GloMax Multi detection system luminometer or equivalent.
a. Remove plate from the incubator.
b. Add 50 μL of Bright‐Glo, reconstituted following the manufacturer’s instructions, to each well of the 96‐well plate.
c. Incubate for 5 minutes at room temperature.
d. Read, using the Bright‐Glo protocol, pre‐installed on the GloMax Multi detection system luminometer (or alternative machine, using readily available settings for firefly luciferase). e. Export the data onto a USB stick for further analysis on a PC.
OR
f. Remove plate from the incubator.
g. Remove the medium from each well of the plate (vacuum pump or similar instrument). CRITICAL STEP To avoid carry over, change the tips for each column or row of the plates when removing the media.
CRITICAL STEPTo avoid carry over, change the tips for each column or row of the plates when removing the media.
h. Add 50µL of a reading solution, previously prepared by a 1:2 dilution of Bright Glo in complete medium (i.e., 2.5 mL of Bright Glo and 2.5 mL of complete medium).
i. Incubate for 5 min at room temperature.
j. Read using the Bright-Glo protocol pre-installed on the GloMax Multi detection system luminometer (or alternative machine, using readily available settings for firefly luciferase) k. Export the data onto a USB stick for further analysis on a PC.
3.3. Data Analysis. Time for Completion: 01:30 h
Microsoft Excel (Microsoft Corporation, Redmond, WA, USA) and GraphPad Prism should be used to analyse the data and calculate the half maximal inhibitory dilution (ID50) of each serum tested, or the half maximal inhibitory concentration (IC50) of antibodies tested. Microsoft Excel is necessary to perform some of the calculations, and to visualize the raw data, as the software can automatically open the comma-separated values (csv) file that is generated by the GloMax Multi detection system luminometer. The protocol steps reported here for the analysis are performed using GraphPad Prism version 6. Differences in the procedure may be necessary if other versions of the software are used.
20. Open the raw data file using Microsoft Excel and calculate the average values of the pseudotype only control wells and of the cell only wells.
21. Open GraphPad Prism version 6.
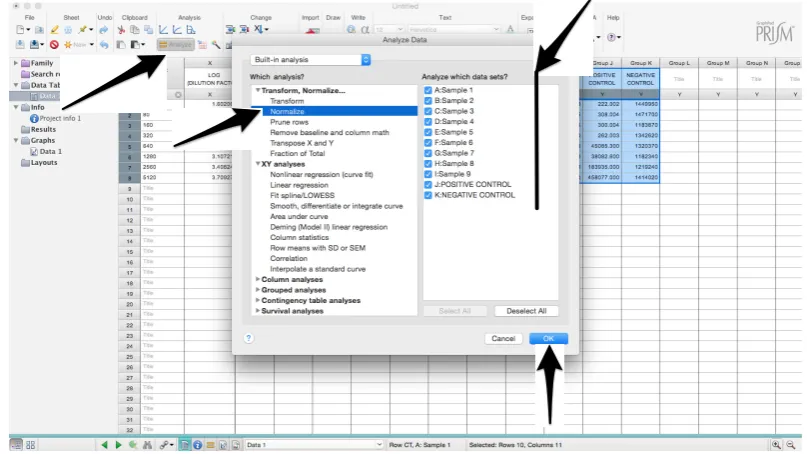
22. Create a New project file selecting “XY” table and “Enter and plot a single value Y for each point” and then press the “Create button” (Figure3).
If multiple replicates for the same serum were performed on the same plate, select “Enter in . . . replicate values side-by-side subcolumns” and in the box, insert how many replicates were performed. Be careful to put replicates next to each other when the data are copied.
Methods and Protoc.2018,1, 8 8 of 16
Methods Protoc. 2018, 1, 8 7 of 16
h. Add 50 μL of a reading solution, previously prepared by a 1:2 dilution of Bright Glo in complete medium (i.e., 2.5 mL of Bright Glo and 2.5 mL of complete medium).
i. Incubate for 5 min at room temperature.
j. Read using the Bright‐Glo protocol pre‐installed on the GloMax Multi detection system luminometer (or alternative machine, using readily available settings for firefly luciferase) k. Export the data onto a USB stick for further analysis on a PC.
3.3. Data Analysis. Time for Completion: 01:30 h
Microsoft Excel (Microsoft Corporation, Redmond, WA, USA) and GraphPad Prism should be used to analyse the data and calculate the half maximal inhibitory dilution (ID50) of each serum tested, or the half maximal inhibitory concentration (IC50) of antibodies tested. Microsoft Excel is necessary to perform some of the calculations, and to visualize the raw data, as the software can automatically open the comma‐separated values (csv) file that is generated by the GloMax Multi detection system luminometer. The protocol steps reported here for the analysis are performed using GraphPad Prism version 6. Differences in the procedure may be necessary if other versions of the software are used.
20. Open the raw data file using Microsoft Excel and calculate the average values of the pseudotype only control wells and of the cell only wells.
21. Open GraphPad Prism version 6.
22. Create a New project file selecting “XY” table and “Enter and plot a single value Y for each point” and then press the “Create button” (Figure 3).
If multiple replicates for the same serum were performed on the same plate, select “Enter in … replicate values side‐by‐side subcolumns” and in the box, insert how many replicates were performed. Be careful to put replicates next to each other when the data are copied.
If replicates were performed on different plates, we advise processing each replicate with “Enter in side‐by‐side subcolumns”, and then average the ID50/IC50 obtained.
Figure 3.Instructions for creating a new GraphPad Prism (GraphPad Software Inc., La Jolla, CA, USA) file to be used for data analysis.
23. A window like the one reported in Figure4will appear.
Methods Protoc. 2018, 1, 8 8 of 16
Figure 3. Instructions for creating a new GraphPad Prism (GraphPad Software Inc., La Jolla, CA, USA)
file to be used for data analysis.
23. A window like the one reported in figure 4 will appear.
Figure 4. Example of GraphPad Prism table that is used to input and analyse the data.
24. Insert assay dilution factors in the first column (40–5120, for example, if the serum sample volume was 5 μL).
25. Insert logarithmic dilution factors (which can be calculated using Microsoft Excel using the LOG10 function) in the X column.
26. Copy the samples, positive and negative serum control raw data (with the exception of pseudotype and cell only values) into the other columns; each column should represent a sample/control (Figure 5).
Figure 5. Example of a GraphPad Prism table in which the raw data and serum dilution factors were
appended to perform the data analysis. DILUTION
FACTORS
LOG (DILUTION FACTOR)
SAMPLES AND CONTROLS RAW DATA
Methods and Protoc.2018,1, 8 9 of 16
24. Insert assay dilution factors in the first column (40–5120, for example, if the serum sample volume was 5µL).
25. Insert logarithmic dilution factors (which can be calculated using Microsoft Excel using the LOG10 function) in the X column.
26. Copy the samples, positive and negative serum control raw data (with the exception of pseudotype and cell only values) into the other columns; each column should represent a sample/control (Figure5).
Methods Protoc. 2018, 1, 8 8 of 16
Figure 3. Instructions for creating a new GraphPad Prism (GraphPad Software Inc., La Jolla, CA, USA) file to be used for data analysis.
23. A window like the one reported in figure 4 will appear.
Figure 4. Example of GraphPad Prism table that is used to input and analyse the data.
24. Insert assay dilution factors in the first column (40–5120, for example, if the serum sample
volume was 5 μL).
25. Insert logarithmic dilution factors (which can be calculated using Microsoft Excel using the
LOG10 function) in the X column.
26. Copy the samples, positive and negative serum control raw data (with the exception of
pseudotype and cell only values) into the other columns; each column should represent a
sample/control (Figure 5).
Figure 5. Example of a GraphPad Prism table in which the raw data and serum dilution factors were appended to perform the data analysis.
DILUTION FACTORS
LOG (DILUTION FACTOR)
SAMPLES AND CONTROLS RAW DATA
Figure 5.Example of a GraphPad Prism table in which the raw data and serum dilution factors were appended to perform the data analysis.
27. To transform the data into percentage neutralization, click on “Analyze”.
28. In the new window that opens, select “Normalize” and be sure that all the data sets are ticked; then click “OK” (Figure6).
Methods Protoc. 2018, 1, 8 9 of 16
27. To transform the data into percentage neutralization, click on “Analyze”.
28. In the new window that opens, select “Normalize” and be sure that all the data sets are ticked;
then click “OK” (Figure 6).
Figure 6. Graphical instruction for permitting the normalization of the raw data.
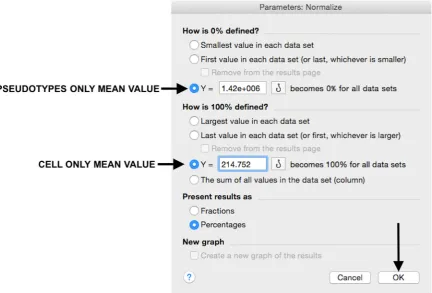
29. Insert the pseudotype only mean value (which was calculated in step 20) in “How is 0%
defined?” and cell‐only mean value in “How is 100% defined?”. Be sure that the “Y=” and the
“Percentages” options are selected. Then click “OK” (Figure 7).
Methods and Protoc.2018,1, 8 10 of 16
29. Insert the pseudotype only mean value (which was calculated in step 20) in “How is 0% defined?” and cell-only mean value in “How is 100% defined?”. Be sure that the “Y=” and the “Percentages” options are selected. Then click “OK” (Figure7).
Methods Protoc. 2018, 1, 8 9 of 16
27. To transform the data into percentage neutralization, click on “Analyze”.
28. In the new window that opens, select “Normalize” and be sure that all the data sets are ticked; then click “OK” (Figure 6).
Figure 6. Graphical instruction for permitting the normalization of the raw data.
29. Insert the pseudotype only mean value (which was calculated in step 20) in “How is 0% defined?” and cell‐only mean value in “How is 100% defined?”. Be sure that the “Y=” and the “Percentages” options are selected. Then click “OK” (Figure 7).
Figure 7. Raw data normalization using “pseudotype only” and “cell only” mean values in the appropriate fields.
30. “Normalize of Data 1” table will be created. From now on, this table will be used for analysis (Figure8).
Methods Protoc. 2018, 1, 8 10 of 16
Figure 7. Raw data normalization using “pseudotype only” and “cell only” mean values in the
appropriate fields.
30. “Normalize of Data 1” table will be created. From now on, this table will be used for analysis (Figure 8).
Figure 8. Selection of the Normalize data table.
31. Now click again on “Analyze”.
32. Select “Nonlinear regression (curve fit)” and be sure that all the data sets are ticked; then click “OK” (Figure 9).
Figure 9. Analysis of the normalized raw data to calculate the half maximal inhibitory concentration (IC50) of each sera.
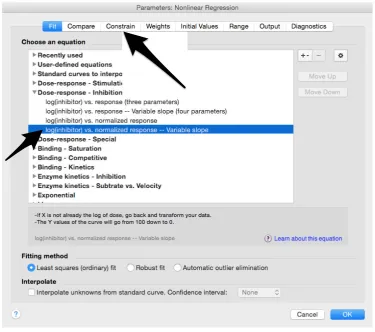
33. Select “log(inhibitor) vs. normalized response—Variable slope” from “Dose‐response‐ Inhibition”; then click on “Constrain” (Figure 10).
Figure 8.Selection of the Normalize data table.
Methods and Protoc.2018,1, 8 11 of 16
32. Select “Nonlinear regression (curve fit)” and be sure that all the data sets are ticked; then click “OK” (Figure9).
Methods Protoc. 2018, 1, 8 10 of 16
Figure 7. Raw data normalization using “pseudotype only” and “cell only” mean values in the appropriate fields.
30. “Normalize of Data 1” table will be created. From now on, this table will be used for analysis
(Figure 8).
Figure 8. Selection of the Normalize data table.
31. Now click again on “Analyze”.
32. Select “Nonlinear regression (curve fit)” and be sure that all the data sets are ticked; then click
“OK” (Figure 9).
Figure 9. Analysis of the normalized raw data to calculate the half maximal inhibitory concentration (IC50) of each sera.
33. Select “log(inhibitor) vs. normalized response—Variable slope” from “Dose‐response‐
Inhibition”; then click on “Constrain” (Figure 10).
Figure 9.Analysis of the normalized raw data to calculate the half maximal inhibitory concentration (IC50) of each sera.
33. Select “log(inhibitor) vs. normalized response—Variable slope” from “Dose-response-Inhibition”; then click on “Constrain” (FigureMethods Protoc. 2018, 1, 8 10). 11 of 16
Figure 10. Selection of the appropriate nonlinear regression equation used to fit the data.
NOTE: If ID20 (or IC20) or ID80 (or IC80) need to be reported, create and use a user‐defined
equation based on “Dose‐response—Special: log(agonist) vs. response—FindECanything” (see
Figure 10); after double‐clicking, press “clone this equation”, change the name and edit the formula by putting “Bottom” as 0 and “Top” as 100. In “Rules for Initial Values”, be sure that the variables are as follows: “logECF” should be “*(Value of X at YMID)”, “HillSlope” should be “SIGN(YATXMAX‐ YATXMIN)” and F should be set as “(Initial Value, to be fit)”
In “Default Constraints”, select “Must be less than” 0 for the “Hill‐Slope” (see also step 34). Constrain the F parameter to 20 if IC20/ID20 needs to be calculated, or to 80 for the IC80/ID80 calculation, or any other number between 0 and 100.
In “Transform to Report” change “ECF” to “ICF”.
34. Constrain the “Hill Slope” to be less than 0, as shown below; then click on “Output” (Figure 11). NOTE 1: Constraining the hill slope usually improves the data fit, forcing the software to consider the data points as part of inhibitory curves. However, if done improperly, it can block the IC50 calculation.
Methods and Protoc.2018,1, 8 12 of 16
NOTE: If ID20 (or IC20) or ID80 (or IC80) need to be reported, create and use a user-defined equation based on “Dose-response—Special: log(agonist) vs. response—FindECanything” (see Figure10); after double-clicking, press “clone this equation”, change the name and edit the formula by putting “Bottom” as 0 and “Top” as 100. In “Rules for Initial Values”, be sure that the variables are as follows: “logECF” should be “*(Value of X at YMID)”, “HillSlope” should be “SIGN(YATXMAX- YATXMIN)” and F should be set as “(Initial Value, to be fit)”
In “Default Constraints”, select “Must be less than” 0 for the “Hill-Slope” (see also step 34). Constrain the F parameter to 20 if IC20/ID20 needs to be calculated, or to 80 for the IC80/ID80 calculation, or any other number between 0 and 100.
In “Transform to Report” change “ECF” to “ICF”.
34. Constrain the “Hill Slope” to be less than 0, as shown below; then click on “Output” (Figure11). NOTE 1: Constraining the hill slope usually improves the data fit, forcing the software to consider the data points as part of inhibitory curves. However, if done improperly, it can block the IC50calculation.
NOTE 2: It is possible to use a pre-modified “log(inhibitor) vs. normalized response—Variable slope” function, in which the hill slope is already constrained. Please see Prism Manual Online to learn how to modify an already existing equation (or see step 33 NOTE as example).
Methods Protoc. 2018, 1, 8 12 of 16
Figure 11. Constraints of the Hill Slope value.
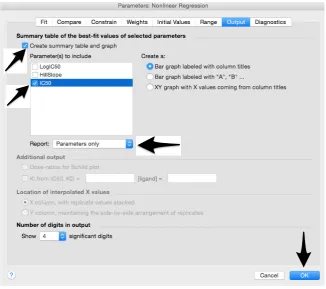
35. Tick “Create summary table and graph”, and then remove all the ticks apart from “IC50” (Figure 12).
36. Select “Parameter only” and then click on “OK” (Figure 12). Figure 11.Constraints of the Hill Slope value.
Methods and Protoc.2018,1, 8 13 of 16
36. Select “Parameter only” and then click on “OK” (FigureMethods Protoc. 2018, 1, 8 12). 13 of 16
Figure 12. Generation of the summary table that will report the IC50 values.
37. Analyses will be performed, and new sheets will appear in results. 38. Check the “Summary table” for IC50 values (Figure 13).
Figure 13. Summary table with IC50 values.
Figure 12.Generation of the summary table that will report the IC50values.
37. Analyses will be performed, and new sheets will appear in results. 38. Check the “Summary table” for IC50values (Figure13).
Methods Protoc. 2018, 1, 8 13 of 16
Figure 12. Generation of the summary table that will report the IC50 values.
37. Analyses will be performed, and new sheets will appear in results. 38. Check the “Summary table” for IC50 values (Figure 13).
Methods and Protoc.2018,1, 8 14 of 16
39. Save the file.
NOTE: If additional plates from the same experiment need to be analysed, the same file could be used; a new table should be added, and then proceed with analysis from point 3.
We advise always double-checking the data, the results, and especially the final graph generated by GraphPad Prism, to identify possible incongruences. This procedure should be considered a simplified guide for the data analysis and should not substitute a critical interpretation of the generated neutralization data.
4. Expected Results
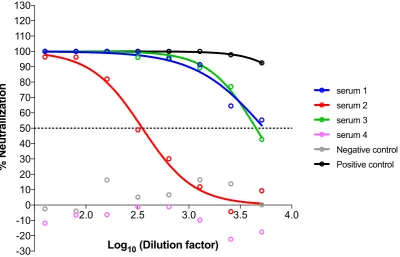
Figure14shows an example of analyzed pseudotype neutralization results. In this case, four sera were tested together with appropriate negative and positive neutralization controls. In this example, sera 1, 2 and 3 (IC50 serum 1 = 5402, IC50 serum 2 = 353, IC50 serum 3 = 4468) are clearly able to neutralize the pseudotype tested with different potencies, whereas serum 4 does not neutralize the pseudotype with a result comparable to the negative control.
The method with GraphPad Prism does not require having points below the 50% mark, because data are firstly normalized and then the equation is constrained to always start with 100% and always finish with 0%. Sometimes GraphPad Prism is unable to calculate the ID50/IC50, because all the points are on one of the two plateaus (for example serum 4 and negative control) and a clear curve slope cannot be computed. In that case, it does not provide a value, and the ID50/IC50should be provided as lower or higher than the range tested.
The pseudotype neutralization assay is more sensitive than the traditional microneutralization assay—if the same serum is analyzed with a microneutralization assay, it will have lower ID50values [6,9].
Methods Protoc. 2018, 1, 8 14 of 16
39.
Save
the
file.
NOTE:
If
additional
plates
from
the
same
experiment
need
to
be
analysed,
the
same
file
could
be
used;
a
new
table
should
be
added,
and
then
proceed
with
analysis
from
point
3.
We
advise
always
double
‐
checking
the
data,
the
results,
and
especially
the
final
graph
generated
by
GraphPad
Prism,
to
identify
possible
incongruences.
This
procedure
should
be
considered
a
simplified
guide
for
the
data
analysis
and
should
not
substitute
a
critical
interpretation
of
the
generated
neutralization
data.
4.
Expected
Results
Figure
14
shows
an
example
of
analyzed
pseudotype
neutralization
results.
In
this
case,
four
sera
were
tested
together
with
appropriate
negative
and
positive
neutralization
controls.
In
this
example,
sera
1,
2
and
3
(IC
50serum
1
=
5402,
IC
50serum
2
=
353,
IC
50serum
3
=
4468)
are
clearly
able
to
neutralize
the
pseudotype
tested
with
different
potencies,
whereas
serum
4
does
not
neutralize
the
pseudotype
with
a
result
comparable
to
the
negative
control.
The
method
with
GraphPad
Prism
does
not
require
having
points
below
the
50%
mark,
because
data
are
firstly
normalized
and
then
the
equation
is
constrained
to
always
start
with
100%
and
always
finish
with
0%.
Sometimes
GraphPad
Prism
is
unable
to
calculate
the
ID
50/IC
50,
because
all
the
points
are
on
one
of
the
two
plateaus
(for
example
serum
4
and
negative
control)
and
a
clear
curve
slope
cannot
be
computed.
In
that
case,
it
does
not
provide
a
value,
and
the
ID
50/IC
50should
be
provided
as
lower
or
higher
than
the
range
tested.
The
pseudotype
neutralization
assay
is
more
sensitive
than
the
traditional
microneutralization
assay—if
the
same
serum
is
analyzed
with
a
microneutralization
assay,
it
will
have
lower
ID
50values
[6,9].
Figure 14. Graphical example of neutralization results of four sera after GraphPad Prism 6 analysis. Normalised percentage neutralization values are plotted against the logarithm of the dilution factors, and neutralization curves are inferred by the software that additionally calculates the IC50.
2.0 2.5 3.0 3.5 4.0
-30 -20 -10 0 10 20 30 40 50 60 70 80 90 100 110 120 130
Log
10(Dilution factor)
%
Neutrall
iz
ati
o
n
serum 1serum 2 serum 3
Negative control Positive control serum 4
Methods and Protoc.2018,1, 8 15 of 16
5. Conclusions and Future Work
In this paper, we present a detailed influenza pseudotype neutralization assay and downstream data analysis protocols within a unified framework. This is accompanied by extensive graphical instructions for the enumeration of neutralization titres, something that was hitherto lacking in the influenza pseudotype literature. This protocol outlines the first steps towards influenza neutralization assay standardization. It should be noted that there are additional key parameters that must be extensively evaluated to optimize an assay of this type, if validation of the assay is the end goal. These parameters are precision, accuracy, specificity, limits of detection, range, linearity and robustness. These have been addressed with an HIV-1 Env pseudotype luciferase-based neutralization assay [11], and this can provide a path forward for equivalent influenza assays. Using this protocol in a study encompassing multiple stakeholder laboratories would enable inter-laboratory variation to be studied at the parameter level.
The protocol presented can be used as an alternative or adjunct to plaque-reduction neutralization assays/microneutralization assays. It benefits from the fact that no wild-type virus is required, and therefore, containment facilities are superfluous. This is of major benefit when working with HPAI H5 and H7 viruses. It is a functional assay which measures the total neutralizing antibody response to the HA (both head and stalk). If accurate quantification of the stalk response is required, the assay can be performed using a pseudotype carrying an HA with a mismatched head (as we have described recently for H11 head/pH1 stalk pseudotypes [12]).
Acknowledgments:This study was funded by the Medway School of Pharmacy.
Author Contributions:F.F. and N.T. conceived and designed the experiments; F.F. performed the experiments; F.F. and N.T. analyzed the data and wrote the paper.
Conflicts of Interest:The authors declare no conflict of interest. The founding sponsors had no role in the design of the study; in the collection, analyses, or interpretation of data; in the writing of the manuscript, and in the decision to publish the results.
References
1. Storch, G.A.; Wang, D. Diagnostic Virology and Virus Discovery. InFields Virology, 6th ed.; Fields, B.N., Knipe, D.M., Howley, P.M., Eds.; Lippincott Williams & Wilkins: Philadelphia, PA, USA, 2013; Volume 1, pp. 414–452, ISBN 978-1451105636.
2. King, B.; Temperton, N.J.; Grehan, K.; Scott, S.D.; Wright, E.; Tarr, A.W.; Daly, J.M. Technical considerations for the generation of novel pseudotyped viruses.Future Virol.2016,11, 47–59. [CrossRef]
3. Li, Q.; Liu, Q.; Huang, W.; Li, X.; Wang, Y. Current status on the development of pseudoviruses for enveloped viruses.Rev. Med. Virol.2017,13, e1963. [CrossRef] [PubMed]
4. Steffen, I.; Simmons, G. Pseudotyping Viral Vectors with Emerging Virus Envelope Proteins.Curr. Gene Ther.
2016,16, 47–55. [CrossRef] [PubMed]
5. Ferrara, F.; Molesti, E.; Temperton, N.J. The application of pseudotypes to influenza pandemic preparedness.
Future Virol.2015,10, 731–749. [CrossRef]
6. Corti, D.; Voss, J.; Gamblin, S.J.; Codoni, G.; Macagno, A.; Jarrossay, D.; Vachieri, S.G.; Pinna, D.; Minola, A.; Vanzetta, F.; et al. A Neutralizing Antibody Selected from Plasma Cells That Binds to Group 1 and Group 2 Influenza A Hemagglutinins.Science2011,333, 850–856. [CrossRef] [PubMed]
7. Krammer, F.; Palese, P. Influenza virus hemagglutinin stalk-based antibodies and vaccines.Curr. Opin. Virol.
2013,3, 521–530. [CrossRef] [PubMed]
8. Carnell, G.W.; Ferrara, F.; Grehan, K.; Thompson, C.P.; Temperton, N.J. Pseudotype-based neutralization assays for influenza: A systematic analysis.Front. Immunol.2015,6, 161. [CrossRef] [PubMed]
Methods and Protoc.2018,1, 8 16 of 16
10. Ferrara, F.; Molesti, E.; Böttcher-Friebertshäuser, E.; Cattoli, G.; Corti, D.; Scott, S.D.; Temperton, N.J. The human Transmembrane Protease Serine 2 is necessary for the production of Group 2 influenza A virus pseudotypes.J. Mol. Genet. Med.2012,7, 309–314. [CrossRef] [PubMed]
11. Sarzotti-Kelsoe, M.; Bailer, R.T.; Turk, E.; Lin, C.L.; Bilska, M.; Greene, K.M.; Gao, H.; Todd, C.A.; Ozaki, D.A.; Seaman, M.S.; et al. Optimization and validation of the TZM-bl assay for standardized assessments of neutralizing antibodies against HIV-1.J. Immunol. Methods2014,409, 131–146. [CrossRef] [PubMed] 12. Ferrara, F.; Temperton, N. Chimeric influenza haemagglutinins: Generation and use in pseudotype
neutralization assays.MethodsX2017,4, 11–24. [CrossRef] [PubMed]