www.atmos-meas-tech.net/7/2745/2014/ doi:10.5194/amt-7-2745-2014
© Author(s) 2014. CC Attribution 3.0 License.
Potential of airborne lidar measurements for cirrus cloud studies
S. Groß1, M. Wirth1, A. Schäfler1, A. Fix1, S. Kaufmann1,2, and C. Voigt1,2
1Institut für Physik der Atmosphäre, Deutsches Zentrum für Luft- und Raumfahrt (DLR), Oberpfaffenhofen,
82234 Wessling, Germany
2Johannes-Gutenberg-Universität Mainz, Institut für Physik der Atmosphäre, 55122 Mainz, Germany
Correspondence to: S. Groß (silke.gross@dlr.de)
Received: 17 February 2014 – Published in Atmos. Meas. Tech. Discuss.: 16 April 2014 Revised: 9 July 2014 – Accepted: 23 July 2014 – Published: 26 August 2014
Abstract. Aerosol and water vapour measurements were per-formed with the lidar system WALES of Deutsches Zen-trum für Luft- und Raumfahrt (DLR) in October and Novem-ber 2010 during the first mission with the new German re-search aircraft G55-HALO. Curtains composed of lidar pro-files beneath the aircraft show the vertical and horizontal dis-tribution and variability of water vapour mixing ratio and backscatter ratio above Germany. Two missions on 3 and 4 November 2010 were selected to derive the water vapour mixing ratio inside cirrus clouds from the lidar instrument. A good agreement was found with in situ observations per-formed on a second research aircraft flying below HALO. ECMWF analysis temperature data are used to derive relative humidity fields with respect to ice (RHi) inside and outside of cirrus clouds from the lidar water vapour observations. The RHi variability is dominated by small-scale fluctuations in the water vapour fields while the temperature variation has a minor impact. The most frequent in-cloud RHi value from li-dar observations is 98 %. The RHi variance is smaller inside the cirrus than outside of the cloud. 2-D histograms of rel-ative humidity and backscatter ratio show significant ences for in-cloud and out-of-cloud situations for two differ-ent cirrus cloud regimes. Combined with accurate tempera-ture measurements, the lidar observations have a great poten-tial for detailed statistical cirrus cloud and related humidity studies.
1 Introduction
Although clouds have an important impact on the Earth’s atmosphere and climate system (Cox, 1971; Liou, 1986) their influence on the Earth’s radiation budget is still hard to
determine (IPCC, 2007, 2013). Especially, radiative effects of cirrus clouds are a major uncertainty for determination of the cloud feedback factor in climate response. Typically, they are assumed to have a net warming effect (Chen et al., 2000). Radiative properties of mid-latitude cirrus clouds strongly depend on their microphysical parameters, e.g. ice crystal shape, size distribution and number concentration (Stephens et al., 1990; Haag and Kärcher, 2004; Fusina et al., 2007), which are influenced by ambient conditions, especially dy-namics (Kärcher and Lohmann, 2003), temperature and su-persaturation (Heymsfield, 1977; Khvorostyanov and Sassen, 1998b) as well as the nucleation mode, i.e. the composi-tion of the ambient aerosol (e.g. Ström and Ohlsson, 1998; Seifert et al., 2004). Furthermore, small-scale turbulence is important for the fine structure of cirrus clouds, which af-fects the inhomogeneity of microphysical properties (Gu and Liou, 2000) and therefore of the cirrus’ radiative effect (Liou, 1972). The inhomogeneous nature of cirrus on different spa-tial scales is one major issue which complicates modelling of their radiative properties. Model simulations usually use idealized cloud structure and microphysics, as well as ra-diative transfer approximations. To improve the representa-tion of cirrus clouds in simularepresenta-tions and circularepresenta-tion models, we need a better understanding of the micro- and macro-physical properties of cirrus clouds, as well as of small-scale processes within cirrus.
from model analyses or dropsondes) further enables us to in-vestigate the variability of relative humidity and ice super-saturation within cirrus clouds which are crucial properties for cirrus cloud evolution (e.g. Heymsfield and Miloshevich, 1995). However, up to now, the high signal dynamics within clouds limited the use of airborne downward-looking DIAL measurements for mid-latitude cirrus clouds. An optimal dis-tance of about 2 km to the cirrus cloud is required to avoid an overload of detectors and data acquisition due to the im-mense signal dynamics in the near field resulting from the
r dependence of the backscatter signal. Up to now the re-quired flight altitude to examine mid-latitude cirrus clouds up to about 13 km height was only accessible with high-altitude aircraft like the Russian stratospheric aircraft Geo-physica (Stefanutti et al., 1999) and the NASA ER-2. With the new German research aircraft HALO (High Altitude and LOng range) (Krautstrunk and Giez, 2012) it is possible to reach flight altitudes of up to 15 km, and thus a sufficient dis-tance to the cirrus cloud top in most cases.
For the first time, measurements of the airborne aerosol and water vapour DIAL WALES (Water vapour Lidar Exper-iment in Space; Wirth et al., 2009), operated onboard HALO during its first scientific mission (Techno-Mission) are pre-sented. The HALO Techno-Mission took place in October and November 2010 and provided the opportunity to investi-gate cloud properties with two different aircraft. HALO, fly-ing at a cruise altitude of∼14 km probed the cloud (∼1 km below cruise altitude) with the lidar. Additionally, the DLR research aircraft Falcon was equipped with in situ instru-ments to measure temperature and water vapour mixing ra-tio within cirrus clouds. This unique combinara-tion of these two aircraft provided the opportunity to compare the differ-ent measuremdiffer-ent strategies, i.e. in situ and remote sensing measurements with a focus on cirrus cloud studies. Relative humidity with respect to ice (RHi) is determined within the cirrus clouds based on the novel high-altitude DIAL obser-vations combined with ECMWF model analysis temperature data.
Section 2 gives an overview over the aircraft and mis-sion design, the WALES system, and the WARAN in situ hygrometer onboard the Falcon used for water vapour inter-comparison. Section 3 demonstrates the potential of the DIAL system for cirrus cloud studies based on a case study with measurements inside the cirrus cloud. Section 4 pro-vides a summary and discussion of the main findings. Sec-tion 5 gives an outlook to future cirrus cloud observaSec-tions with remote sensing instruments onboard HALO.
2 Data and methods
2.1 HALO and Techno-Mission
HALO (Fig. 1) is a modified Gulfstream G550 busi-ness jet operated by the flight department of DLR in
Table 1. Technical features of Gulfstream G550 HALO aircraft
adopted from Krautstrunk and Giez (2012).
Engine Rolls-Royce BR710
Aircraft Performance
Maximum range 12 500 km Maximum cruise altitude 15 540 m Take-off distance 1801 m Maximum speed 0.885 Mach
Weights
Maximum take-off weight 41 277 kg Maximum payload 3 t
Exterior
Length 29.4 m
Height 7.9 m
Wingspan 28.5 m
Interior
Cabin length 15.3 m
Cabin height 1.88 m
Cabin width 2.24 m
Cabin volume 47.3 m3
Oberpfaffenhofen. With a range of more than 8000 km and an endurance of up to more than 10 flight hours even large-scale atmospheric features can be investigated at almost all regions around the globe. A maximum cruising altitude of more than 15 km enables measurements in the upper troposphere and lower stratosphere in high- and mid-latitude regions. With a payload of up to three tons, HALO provides enough capacity to accommodate a synergetic payload to collect a compre-hensive atmospheric data set (Krautstrunk and Giez, 2012). Technical details can be found in Table 1.
Figure 1. HALO (High Altitude and LOng range) aircraft. Photo
adopted from http://www.halo.dlr.de/.
of the measurement area. This gave us the opportunity to per-form measurements in cloudy and in cloud-free air masses. HALO was equipped with a spectrometer system operated by University of Leipzig together with an instrument for mea-suring the actinic flux in cooperation with Forschungszen-trum Jülich (HALO-SR) (Fricke et al., 2014), an automated high-volume air sampling system (MIRAH – Measurements of Stable Isotope Ratios in Atmospheric Trace Gases on HALO) of University of Wuppertal (Krebsbach et al., 2013), and an ion trap mass spectrometer of DLR (Roiger et al., 2011). Additionally, and in the focus of this paper, the DIAL system WALES (Wirth et al., 2009) was provided by DLR In-stitute of Atmospheric Physics (IPA). The campaign focused on the test of the in-flight performance of new instrumenta-tion and validainstrumenta-tion of remote sensing instruments with in situ measurements. A further aim was the development and eval-uation of new sampling strategies for future campaigns, in-cluding finding an optimal flight level for remote cloud stud-ies as well as to investigate the possibility to use HALO as the pathfinder for a secondary aircraft with an in situ payload for cloud studies (e.g. distance from cloud top). For inter-comparison and validation, the DLR Falcon was equipped with several in situ instruments including the WARAN tune-able diode laser hygrometer operated by DLR (Voigt et al., 2014). Falcon flew in parallel, either wing by wing to com-pare in situ instruments or several kilometres below HALO to compare lidar with in situ measurements.
2.2 Differential absorption lidar WALES
Differential absorption lidar is an active remote sensing tech-nique for measuring atmospheric gases such as water vapour (e.g. Bösenberg, 1998; Browell et al., 1998). It is based on the absorption at different laser wavelengths with narrow spec-tra. The so-called online wavelength is centred on a molecu-lar water vapour absorption line. For the offline wavelength a non-absorbing wavelength is used, which serves as the ref-erence. By calculating the difference between absorptions at online and offline wavelength, a profile of the water vapour number density as function of the distance from the lidar sys-tem can be derived.
The WALES lidar system consists of two transmitters, both based on an injection-seeded optical parametric oscilla-tor (OPO) pumped by the second harmonic of a Q-switched, diode pumped Nd:YAG laser. Thus, WALES is capable to simultaneously emit four wavelengths, three online and one offline, in the water vapour absorption band between 935 and 936 nm. The three online wavelengths achieve the necessary sensitivity needed for measurements over the whole range of tropospheric water vapour concentration. A complete wa-ter vapour profile of the troposphere is composed by using the information of the partly overlapping line contributions. The averaged pulse energy is 35 mJ with a repetition rate of 200 Hz. The vertical resolution of the raw data is 15 m. In addition to the 935 nm channel, the receiver is equipped with polarization-sensitive aerosol channels at 532 and 1064 nm, the first one with High Spectral Resolution capabilities us-ing an iodine filter in the detection path (Esselborn et al., 2008). This allows for collocated measurements of humidity and optical depth, as well as studies of clouds and aerosol optical properties. System parameters of the WALES system are listed in Table 2. For a detailed technical description see Wirth et al. (2009).
As the main objective of the lidar measurements during the HALO Techno-Mission was high-resolution measure-ments of cirrus clouds, only the strong absorption line of 935.6846 nm was used. For the second laser, the genera-tion of laser radiagenera-tion for the medium and weak absorbing line for mid- and lower tropospheric H2O measurements was switched off. Thus, highest possible spectral purity of the HSRL (High Spectral Resolution Lidar) channel at 532 nm was achieved. The vertical resolution of the measurements is 150 m, the horizontal resolution is about 1 km (5 s aver-ages). The statistical error of the water vapour retrievals is about 5 %. A general analysis of the systems accuracy can be found in Kiemle et al. (2008).
Table 2. System parameters of WALES.
Transmitter type Nd:YAG laser-pumped OPO
Pulse energy (mJ) 40 Repetition rate (Hz) 200
Wavelength (nm) 532, 935, 1064 Strong absorbing line (nm) 935.6846 Medium absorbing line (nm) 935.6083 Weak absorbing line (nm) 935.5612 Telescope diameter (cm) 48 Vertical resolution (m) 150 Horizontal resolution (km) 1 (5 s)
2.3 WARAN hygrometer
The airborne in situ hygrometer instrument WARAN consists of a commercial tunable diode laser (TDL) device (WVSS-II, Spectrasensors Inc.; Voigt et al., 2014) in combination with a Rosemount inlet system. The WVSS-II is a closed-cell TDL system in which a diode laser is tuned continuously over the water vapour absorption line at 1.37 µm. After pass-ing the measurement cell twice (∼24 cm), the laser intensity is measured by a photodiode. High sensitivity is achieved by utilizing second-harmonic detection as e.g. described by May and Webster (1993). The measurement range is from 30 to 40 000 ppmv covering typical atmospheric mixing ratios from ground up to the upper troposphere. The relative un-certainty increases towards lower water vapour mixing ratios from 5 % above 200 ppmv up to 20 % at 30 ppmv, confirmed by a direct intercomparison with calibrated data from wa-ter vapour mass spectromewa-ter (Kaufmann et al., 2014). The air flows passively through the measurement cell. A heated Rosemount inlet system was used in order to avoid particles, especially ice crystals, entering the inlet line. While the par-ticle separation works well for typical cirrus conditions with low number concentrations and ice particle sizes of several 10 µm, particles smaller than around 1 µm may enter the inlet and evaporate. In combination with high number concentra-tions as present in e.g. mixed phase clouds or contrails, this effect can have an influence on the in-cloud humidity mea-surements.
3 Results 3.1 Overview
At the time of the observation (12:00 UTC) on 4 Novem-ber 2010, the synoptic situation over Europe was charac-terized by a large-scale ridge. Cirrus clouds at upper levels are advected towards Germany within the anticyclonic jet stream (see increased values of relative humidity at 250 hPa in Fig. 2a). Figure 2b shows the flight track of HALO be-tween 10:21 and 13:32 UTC in the TRA Allgäu in southern
Figure 2. (a) ECMWF analysis of geopotential height (in dm, black
contour lines) and relative humidity (%, grey shading) at 250 hPa valid on 12:00 UTC 4 November 2010. (b) Flight track of HALO between 10:46 and 13:32 UTC (dashed line). The thick black line in (b) indicated the section shown in Fig. 3. Grey area in (b) shows the TRA Allgäu. Black rectangle in (a) indicates the section shown in (b).
Germany. In the following we only consider data from the 910 km long section of the five consecutive oval flights be-tween 10:47 and 11:54 UTC (solid line) when measurements were performed at constant flight level of about 14 km. After 11:54 UTC HALO started to descend.
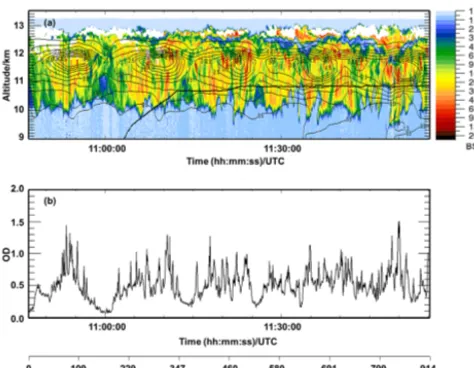
Figure 3a presents the lidar backscatter ratio cross sec-tion at 532 nm, the ECMWF cloud ice water content, and the flight altitude of the Falcon within the cirrus cloud. The backscatter ratio indicates the cirrus cloud with a base alti-tude at about 10 km and the cirrus cloud top at about 13 km. The backscatter ratio within the cirrus cloud shows a wide range of values from about 4 up to more than 50. Unfortu-nately, we were not able to reach the maximum cruise al-titude of HALO during this case study to obtain an opti-mal distance to the cirrus cloud top to avoid signal overload (identified by the white areas in the upper part of the cloud in Fig. 3a). The comparison of the backscatter ratio and the ECMWF cloud ice water content indicates that model data and observation of cloud height and location are in good agreement, a crucial requirement to combine model data and lidar measurements. The Falcon flight track reaches the cloud at constant height level at about 11 km at 11:25 UTC and both aircraft flew in short horizontal distance until 11:54 UTC. This time period corresponds to a flight distance of about 220 km. Falcon in situ measurements during that period can be used for validation of the lidar measurements and com-parisons of model data within the cloud. Figure 3b shows the lidar-derived upper level (9–13 km) optical depth (OD) at 532 nm, which is a measure of the attenuation of light on its way through the atmosphere. The OD was determined with the high spectral resolution lidar method (Esselborn et al., 2008). It ranges between about 0.1 and 1.5 in the upper level with a very variable structure. The uncertainty of the OD in this optically rather thick cirrus cloud is about 5 %.
Figure 3. (a) Backscatter ratio at 532 nm (colour shading) between
10:47 and 11:54 UTC on 4 November 2010. White areas are caused by saturation of the detection optics. The thick black solid line indi-cates the altitude of the DLR Falcon; the black contour lines show the ECMWF cloud ice water content of 0.5–4.5 mg kg−1. (b) Opti-cal depth (OD) at 532 nm of the cirrus cloud derived from WALES measurements.
observations at the same altitude and location by the DIAL WALES. In Fig. 4b the horizontal distance between HALO and Falcon is plotted. The blue line (Fig. 4a, b) indicates the time when the Falcon reached a constant flight altitude of about 10.8 km. Both measurements agree well when the distance between both measurements is less than 10 km (af-ter∼11:20 UTC). The mixing ratio during the selected time period is about 100 ppmv. Even small-scale features can be resolved well by the WALES-DIAL measurement.
3.2 Relative importance of temperature and humidity for the determination of RHi
Additionally to the water vapour measurements, the calcu-lation of RHi requires collocated temperature information. As there was no remote measurement of the temperature field beneath HALO, 3-D temperature fields provided by the ECMWF global model were used. Analyses and short-term forecast with a 1-hourly temporal resolution and a T799L91 spatial resolution, i.e. ∼25 km horizontal distance between neighbouring grid points, are interpolated in space and time to match with the position of the WALES measurement (see Schäfler et al., 2010). Beside temperature, also simulated cloud ice water content and water vapour mixing ratios were interpolated to the flight track. The vertical resolution of the terrain-following model at cirrus altitude (∼10–13 km) is about 400 m.
To estimate the accuracy of the ECMWF model temper-ature inside cirrus clouds and its applicability for RHi stud-ies we compare the ECMWF temperature data with in situ
Table 3. Mean values and relative variability (averaged between
11:25 and 11:54 UTC) along Falcon flight path on 4 Novem-ber 2010. For the ECMWF relative humidity uncorrected model temperature data are used. In situ relative humidity is determined from WARAN water vapour measurements and in situ temperature measurements onboard the Falcon.
Mean Variability
ECMWF In situ ECMWF In situ
Temperature (K) 219 220 0.0003 0.0006 H2O mix (ppmv) 100 99 0.03 0.12
RHi (%) 103 91 0.03 0.12
temperature measurements of the Falcon flying in the cir-rus cloud beneath HALO. For this purpose, a flight path in which the Falcon flight level of about 10.8 km varied by less than 100 m (11:25–11:54 UTC) was chosen, to avoid uncer-tainties resulting from sharp vertical temperature gradients at changing flight altitudes.
Figure 4. (a) Water vapour mixing ratio as retrieved by the WARAN
instrument flown on the Falcon (red line) and the WALES instru-ment (black line) at the same altitude. (b) Horizontal distance be-tween the two aircraft as a function of time.
ECMWF showing less variation than in situ data. The rela-tive variability of the individual variables is listed in Table 3. The influence of temperature variability on the variability of relative humidity over ice is further estimated along the Falcon flight section (see Fig. 5) by comparing RHi values calculated with the mixing ratio from WARAN and differ-ent temperatures. The relative variability of relative humid-ity calculated with the Falcon temperature measurements is 0.12, with the uncorrected temperature from ECMWF anal-ysis is 0.13, and with a constant temperature (i.e. the mean of the Falcon measurements) is 0.12. Values differ only by about 10 %, meaning that the major part of local RHi fluctua-tions is caused by local variafluctua-tions in the water vapour mixing ratio. Temperature variations give only a minor local contri-bution.
It is worthwhile mentioning that the ECMWF model pre-dicts the cloud where it is detected by lidar. However, addi-tional uncertainties in the absolute values of RHi resulting from differences in model temperature and actual tempera-ture have to be taken into account.
3.3 Relative humidity over ice within cirrus cloud To derive RHi using WALES water vapour measurements, ECMWF temperature data were interpolated in space and time to match with the measured field. Figure 5 showed dif-ferences between observed and modelled temperatures at the flight altitude of the Falcon. To verify the applicability of the model temperature in this altitude range, we compare the ver-tical profile of different measurements: radiosonde data from the 12:00 UTC ascents over Munich and Stuttgart, ECMWF temperature analysis data at 12:00 UTC, and HALO and Fal-con profiles derived from the total air temperature sensors of both aircraft during descent to Oberpfaffenhofen (11:57 to
Figure 5. Comparison of in situ temperature, water vapour and RHi
measurements on 4 November 2010 from WARAN onboard the Fal-con (blue lines) with data from ECMWF model analysis (red lines).
(a) Static air temperature, (b) water vapour mixing ratio and (c)
rela-tive humidity over ice along the flight track. The red line shows RHi calculated from ECMWF temperature and water vapour data, the thick blue line shows RHi calculated from WARAN water vapour mixing ratio and Falcon in situ temperature measurements, and the thin blue line shows RHi calculated from WARAN water vapour mixing ratio measurements and ECMWF model temperature.
13:32 UTC for HALO and 12:13 to 13:29 UTC for the Fal-con) airport which is closest in time (Fig. 6).
As can readily be seen from Fig. 6a, the temperature pro-files of the two radiosonde temperature propro-files of Munich and Stuttgart agree well (with minor deviations between 12 and 13 km, i.e. the tropopause region) which indicates little horizontal variability of the temperature field. This is also confirmed by horizontal sections of ECMWF temperature at 10 km altitude (not shown). This is important as the loca-tion of the aircraft measurements lies in between both sta-tions. Another important result of this comparison is that the tropopause region between 12 and 13 km altitude is captured well in the model data, confirming that model data are ap-propriate to use in this altitude range. Also, the temperature profiles from the two aircraft show very comparable results up to the maximum ceiling altitude of the Falcon which is not surprising since both aircraft use the same type of total air temperature sensors (Stickney et al., 1994).
Figure 6. (a) Temperature measurements from radiosondes over Munich (light blue line) and Stuttgart (purple line) at 12:00 UTC, 4
Novem-ber 2010, ECMWF model analysis (black line) and in situ measurements from HALO (red line) and Falcon (green line) descents. (b) Dif-ference of ECMWF model analysis temperature data and HALO in situ temperature measurements (red line), Falcon in situ measurements (green line) during descents, and radiosonde temperature measurements over Munich (light blue line) and Stuttgart (purple line).
in the upper cloud region (11–13 km altitude) the difference is height dependent and varies between−1.4 K (uppermost level) and about 1.5 K (about 12.2 km). The mean difference in this height range is about 0.6 K. In the entire altitude range (9–13 km) the mean difference is about 0.8 K. The sources of the differences between model and HALO temperature are not entirely clear, although up to altitudes where both radiosondes agree very well (∼12 km) the deviation is still within the combined error that is given in the literature – ∼0.3 K for radiosondes at daytime (Nash et al., 2011) and ∼0.5 K for the aircraft temperature sensors (A. Giez, per-sonal communication, 2014; Stickney et al., 1994). Possible reasons may be uncertainties in the temperature measure-ments of the aircraft due to insufficient correction for flight performance parameters (A. Giez, personal communication 2014), due to radiation or cloud effects (Nash et al., 2011), or due to resolution artefacts. Comparing radiosonde temper-ature measurements to model and airborne tempertemper-ature data we see that model and radiosondes occasionally show good agreements while airborne and radiosonde temperature mea-surements show similar differences to model and airborne data. To create the analysis fields, preferably the most realis-tic representation of the state of the atmosphere, ECMWF as-similates a multitude of different observation types, e.g. from surface stations, satellites and also radiosondes. This can ex-plain the smaller deviations between modelled temperatures and the radiosonde profiles and may also impact on the devi-ations between model and aircraft data.
Although the uncertainties of the temperature measure-ments lead to a relative uncertainty of about 10–15 % in the retrieved RHi in the considered temperature range, we con-clude that the ECMWF model temperature field is suited for this kind of study.
In our case we used the available observed temperature profile of HALO to offset the ECMWF temperature field with
Figure 7. (a) Water vapour volume mixing ratio as measured
with WALES on HALO and contour lines of ECMWF tempera-ture. (b) Relative humidity over ice from combined WALES and ECMWF data. In the white areas no trustworthy measurements are available due to signal overload and strong variability.
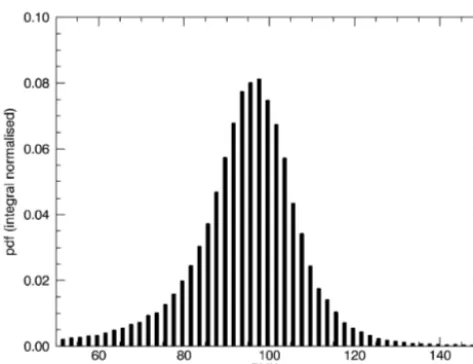
Figure 8. Frequency distribution of the relative humidity over ice
inside the cirrus cloud shown in Figs. 3 and 7. The bin size of the histogram is 2 %.
and due to the light extinction within the cloud. In contrast to the water vapour profiles, the RHi field (Fig. 7b) depicts vertical uniformly distributed values.
The threshold for the decision whether a data point is in-side the cirrus or not was set to an empirical value of 4 for the backscatter ratio (BSR) at 532 nm. A BSR threshold of 2 did not show significant differences. A histogram of the ob-served relative humidity over ice within the fully developed cirrus cloud (BSC > 4) is shown in Fig. 8. The frequency dis-tribution of RHi over the whole cirrus cloud shows a nearly Gaussian distribution with a maximum at approximately ice saturation. About 30 % of all data points inside the cirrus cloud show RHi values above ice saturation; only 2 % of all data points are higher than 120 %.
To determine a possible altitude dependence of RHi within the cirrus cloud, the cloud was divided into vertical layers with a depth of 500 m (see Fig. 9). Between 10 and 12 km no significant difference in the frequency distribution of RHi can be seen relative to the complete spectrum (Fig. 9). Only in the upper layers are small differences visible. The upper-most layer shows a shift to lower RHi values compared to the layers below with a maximum at 91 % RHi.
To obtain information about the cirrus cloud life cycle we perform a correlation analysis using the 2-D RHi and backscatter ratio fields. For this analysis the backscatter and relative humidity data were interpolated to the same time– height resolution. For studying the RHi conditions inside and outside the cirrus cloud in different cloud regimes, the pre-sented persistent cirrus cloud observed on 4 November (dis-cussed above) is compared with a transient/intermittent cir-rus cloud drifting out of the observation area followed by cloud-free air on 3 November 2010. In this case we had the opportunity to study cloudy and cloud-free areas. Figure 10 shows the joint distribution of backscatter ratio and relative
Figure 9. Frequency distribution of the relative humidity over ice
at different vertical layers inside the cirrus cloud shown in Figs. 3 and 7.
humidity over ice for both cirrus regimes. In the persistent cirrus cloud on 4 November 2010 (Fig. 10a) only very few RHi values exceed 120 %, even outside the cirrus at low backscatter ratios. In contrast, in the transient cirrus case (Fig. 10b) high RHi values up to 150 % are found outside the cirrus cloud. In both cases, the corresponding RHi value of the maximum backscatter ratio is about 100 %.
4 Summary and discussion
We used combined airborne water vapour lidar measure-ments and ECMWF temperature data to analyse RHi within a cirrus cloud observed on 4 November 2010. For this analysis it is important that the model is able to reproduce the general cloud situation, as otherwise uncertainties may occur mainly due to temperature differences. For the examined case, on 4 November 2010, we therefore verified that the model is able to reproduce the cloud situation in terms of location and vertical extent of the cirrus cloud. This ensures comparability of observed and modelled cloud properties.
Figure 10. Histogram of the joint occurrence of the relative
hu-midity over ice (RHi) and the extinction corrected backscatter ratio (BSR) at 532 nm (a) for a fully developed cirrus cloud on 4 Novem-ber 2010 and (b) for a transient cirrus cloud on 3 NovemNovem-ber 2010.
evolution stage of the examined cirrus cloud regimes. Con-sidering the INCA data set, Ovarlez et al. (2002) found that two types of distributions can be fitted to the observations; a Gaussian distribution for warm cirrus clouds (T >−40◦C), and a Rayleigh distribution to cirrus clouds colder than −40◦C. The dependence of the RHi distribution on the tem-perature is interpreted as an effect of the length of time a cirrus cloud needs from formation to a mature equilibrium state (Spichtinger et al., 2004). Thus, the tail towards higher RHi values might be a signature of clouds that have not yet reached values close to equilibrium. The RHi distribution within the cirrus cloud of 4 November 2010 shows a nearly Gaussian distribution at a temperature range of about −45 to−65◦C. We therefore conclude that the observed cloud is fully developed, potentially with a tendency to dissolve.
The comparison of the vertical RHi structure shows a shift to lower values in the uppermost cirrus cloud layer compared to the lower and middle part of the cloud. This is in con-trast to former model studies (Khvorostyanov and Sassen, 1998a, b) indicating the region of highest ice supersatura-tion in the middle part of the cloud layer, the so-called ice crystal growth region, and lower ice supersaturation in the upper and lower layers with lowest ice supersaturation in the lowest layer. From ground-based Raman lidar measurements in combination with model temperature data (Comstock et al., 2004) a relatively similar frequency distribution in the upper 75 % of the cloud with a high fraction of ice super-saturation was found, while in the lowermost 25 % of the cloud 84 % of the data points were below ice supersaturation. These findings are in good agreement with model simula-tions of Heymsfield and Miloshevich (1995), which showed enhanced ice supersaturation in the uppermost cloud layer and a sublimation region near the cloud base. It has to be kept in mind that we consider only a single case study in our analysis and, as mentioned above, the comparability of this case study with former findings is limited by the evolu-tion state of the observed cloud as well as by ambient con-ditions. Similar to earlier findings of a positive skewness in cold clouds (Ovarlez et al., 2002), Spichtinger et al. (2004) found asymmetric RHi distributions in the upper (and colder)
cloud layers based on the MOZAIC (Measurement of Ozone by Airbus In-service aircraft project) data set. They interpret their findings with the influence of vertical motion on the du-ration of the transition to equilibrium (Gierens, 2003) and therewith on the distribution of (super-)saturation within the cloud. As we assume the observed cloud of 4 November 2010 to be in equilibrium with a tendency to dissolve, this may ex-plain the differences in the observed vertical RHi structure.
By comparing the relative humidity inside and outside the cirrus clouds for the fully developed stage on 4 Novem-ber 2010 we found a limit of RHi values of about 120 % inside as well as outside the cloud. This supports the as-sumption that the cloud is rather stable, maybe with a ten-dency to evaporate at that stage. High RHi values of approxi-mately 140–150 % RHi are needed for homogeneous ice nu-cleation (DeMott et al., 1998; Koop et al., 2000; Haag et al., 2003; Kärcher, 2012). Thus the high RHi values of up to 150 % following the transient cirrus cloud on 3 Novem-ber 2010 suggest that homogeneous ice nucleation may play a role in cirrus cloud formation in this situation. The rela-tive humidity corresponding to the maximum backscatter ra-tio was∼100 % in both cases. We interpret that in the centre of the cirrus, where particle density causes high backscatter ratios, the water uptake by, and evaporation of, ice crystals is in equilibrium. As expected, in both cases the RHi range is much wider outside the cirrus than within.
The presented novel analysis technique enables us to clas-sify the evolution stage in the life cycle of the cirrus cloud as it provides information of the RHi distribution shape within the cirrus cloud, the vertical structure of the RHi, and the joint distribution of in-cloud and out-of-cloud RHi values. As these parameters are (amongst others) dependent on the life cycle of the cloud, the novel analysis technique can give indications of whether the cloud is in a formation or dissi-pation stage. However, additional observations of different cloud regimes and environmental conditions are required for a thorough analysis.
5 Conclusions
measurements. The profile data make it possible to perform simultaneous statistical analysis in different cloud layers.
Since the Techno-Mission was focused mainly on the tech-nical performance of aircraft and instruments, it is beyond the scope of this study to address all details of cirrus cloud for-mation to its full extent. The flights were limited with respect to the operation area and to local meteorological conditions. For the future, additional data are required during the entire life cycle of a cirrus cloud. Future HALO missions, espe-cially the ML-Cirrus mission, are focusing on this topic and will benefit from the findings and techniques presented in this article. The measurement of temperature profiles with a mi-crowave temperature profiler, as planned for the ML-Cirrus mission, will enable elaboration of the presented methods.
Acknowledgements. This work has been funded by the Deutsche Forschungsgemeinschaft (DFG) in the SPP (no. 1294/2) “Atmosphären- und Erdsystemforschung mit dem Forschungs-flugzeug HALO (High Altitude and Long Range Research Aircraft)” and under contract no. KI1567/1-1 and no. VO1504/2-1. S. Kaufmann was funded by the Helmholtz-Gemeinschaft Deutscher Forschungszentren e.V. (HGF) under contract VH-NG-309 within the Helmholtz-Hochschul Young Investigators group AEROTROP. The authors like to thank the staff members of the DLR Falcon and the HALO aircraft from DLR Flight Experiments for preparing and performing the measurement flights and provid-ing Falcon in situ temperature measurements and analysis.
The service charges for this open access publication have been covered by a Research Centre of the Helmholtz Association.
Edited by: M. Hamilton
References
Ansmann, A. and Bösenberg J.: Correction scheme for spectral broadening by Rayleigh scattering in differential absorption lidar measurements of water vapour in the troposphere, Appl. Optics, 26, 3026–3032, doi:10.1364/AO.26.003026, 1987.
Bösenberg, J.: Ground-based differential absorption lidar for water-vapor and temperature profiling: Methodology, Appl. Optics, 37, 3845–3860, doi:10.1364/AO.37.003845, 1998.
Browell, E. V., Ismail, S., and Grant, W. B.: Differential absorption lidar (DIAL) measurments from air and space, Appl. Phys. B, 67, 399–410, 1998.
Chen, T., Rossow, W. B., and Zhang, Y.: Radiative effects of cloud-type variations, J. Climate, 13, 264–286, doi:10.1175/1520-0442(2000)013<0264:REOCTV>2.0.CO;2, 2000.
Comstock, J. M., Ackerman, T. P., and Turner, D. D.: Evidence of high ice supersaturation in cirrus clouds using ARM Ra-man lidar measurements, Geophys. Res. Lett., 31, L11106, doi:10.1029/2004GL019705, 2004.
Cox, S. K.: Cirrus clouds and the climate, J. At-mos. Sci., 28, 1513–1515, doi:10.1175/1520-0469(1971)028<1513:CCATC>2.0.CO;2, 1971.
DeMott, P. J., Rogers, D. C., Kreidenweis, S. M., Chen, Y., Twohy, C. H., Baumgardner, D., Heymsfield, A. J., and Chan, K. R.: The role of heterogeneous freezing nucleation in upper tropo-spheric clouds: Inferences from SUCCESS, Geophys. Res. Lett., 25, 1387–1390, doi:10.1029/97GL03779, 1998.
Ehret, G., Kiemle, C., Renger, W., and Simmet, G.: Airborne remote sensing of tropospheric water vapor with a near-infrared differ-ential absorption lidar system, Appl. Optics., 32, 4534–4551, doi:10.1364/AO.32.004534, 1993.
Esselborn, M., Wirth, M., Fix, A., Tesche, M., and Ehret, G.: Air-borne high spectral resolution lidar for measuring aerosol ex-tinction and backscatter coefficients, Appl. Optics, 47, 346–358, doi:10.1364/AO.47.000346, 2008.
Fricke, C., Ehrlich, A., Jäkel, E., Bohn, B., Wirth, M., and Wendisch, M.: Influence of local surface albedo variability and ice crystal shape on passive remote sensing of thin cirrus, At-mos. Chem. Phys., 14, 1943–1958, doi:10.5194/acp-14-1943-2014, 2014.
Fusina, F., Spichtinger, P., and Lohmann, U.: Impact of ice supersat-urated regions and thin cirrus on radiation in the midlatitudes, J. Geophys. Res., 112, D24S14, doi:10.1029/2007JD008449, 2007. Gierens, K.: On the transition between heterogeneous and homogeneous freezing, Atmos. Chem. Phys., 3, 437–446, doi:10.5194/acp-3-437-2003, 2003.
Goff, J. A. and Gratch, S.: Low-pressure properties of water from −160 to 212 F, Trans. Am. Soc. Heating Air-Cond. Eng., 52, 95– 122, presented at the 52nd annual meeting of the American soci-ety of heating and ventilating engineers, New York, 1946. Gu, Y. and Liou, K. N.: Interactions of radiation,
mi-crophysics, and turbulence in the evolution of cirrus clouds, J. Atmos. Sci., 57, 2463–2479, doi:10.1175/1520-0469(2000)057<2463:IORMAT>2.0.CO;2, 2000.
Haag, W. and Kärcher, B.: The impact of aerosols and gravity waves on cirrus clouds at midlatitudes, J. Geophys. Res., 109, D12202, doi:10.1029/2004JD004579, 2004.
Haag, W., Kärcher, B., Ström, J., Minikin, A., Lohmann, U., Ovar-lez, J., and Stohl, A.: Freezing thresholds and cirrus cloud forma-tion mechanisms inferred from in situ measurements of relative humidity, Atmos. Chem. Phys., 3, 1791–1806, doi:10.5194/acp-3-1791-2003, 2003.
Heymsfield, A. J.: Precipitation development in strat-iform ice clouds: A microphysical and dynamical study, J. Atmos. Sci., 34, 367–381, doi:10.1175/1520-0469(1977)034<0367:PDISIC>2.0.CO;2, 1977.
Heymsfield, A. J. and Miloshevich, L. M.: Relative humid-ity and temperature influences on cirrus formation and evolution: Observations from wave clouds and FIRE II, J. Atmos. Sci., 52, 4302–4326, doi:10.1175/1520-0469(1995)052<4302:RHATIO>2.0.CO;2, 1995.
IPCC: Climate change 2007: The scientific basis, Cambridge Uni-versity Press, 2007.
IPCC: Climate change 2013: The Physical Science Basis, Cam-bridge University Press, 2013.
Kärcher, B.: Atmospheric Ice Formation Processes, in: Atmo-spheric Physics, edited by: Schumann, U., Research Topics in Aerospace, pp. 151–168, Springer Berlin Heidelberg, 2012. Kärcher, B. and Lohmann, U.: A parameterization of cirrus cloud
formation: Heterogeneous freezing, J. Geophys. Res., 108, 4402, doi:10.1029/2002JD003220, 2003.
Khvorostyanov, V. I. and Sassen, K.: Cirrus cloud simulation using explicit microphysics and radiation; Part I: Model de-scription, J. Atmos. Sci., 55, 1808–1821, doi:10.1175/1520-0469(1998)055<1808:CCSUEM>2.0.CO;2, 1998a.
Khvorostyanov, V. I. and Sassen, K.: Cirrus cloud simulation using explicit microphysics and radiation; Part II: microphysics, vapor and ice mass budgets, and optical and radiative properties, J. At-mos. Sci., 55, 1822–1845, 1998b.
Kiemle, C., Wirth, M., Fix, A., Ehret, G., Schumann, U., Gardiner, T., Schiller, C., Sitnikov, N., and Stiller, G.: First airborne wa-ter vapor lidar measurements in the tropical upper troposphere and mid-latitudes lower stratosphere: accuracy evaluation and in-tercomparisons with other instruments, Atmos. Chem. Phys., 8, 5245–5261, doi:10.5194/acp-8-5245-2008, 2008.
Koop, T., Luo, B., Tsias, A., and Peter, T.: Water activity as the determinant for homogenous ice nucleation in aqueous solutions, Nature, 406, 611–614, 2000.
Krautstrunk, M. and Giez, A.: The transition from Falcon to HALO era airborne atmospheric research, in Atmospheric Physics, edited by: Schumann, U., Research Topics in Aerospace, pp. 609–624, Springer Berlin Heidelberg, 2012.
Krebsbach, M., Koppmann, R., Bühler, F., Heuser, H.-P., Knieling, P., Scheidt, M., and Spahn, H.: Measurements of Stable Carbon Isotope Ratios in Atmospheric VOC on HALO during TACTS and ESMVal, Geophys. Res. Abstr., EGU2013-3853, EGU Gen-eral Assembly 2013, Vienna, Austria, 2013.
Liou, K.-N.: Light scattering by ice clouds in the visible and in-frared: A theoretical study, J. Atmos. Sci., 29, 524–536, 1972. Liou, K.-N.: Influence of cirrus clouds on weather
and climate processes: a global perspective, Mon. Weather Rev., 114, 1167–1199, doi:10.1175/1520-0493(1986)114<1167:IOCCOW>2.0.CO;2, 1986.
May, R. D. and Webster, C. R.: Data processing and calibration for tunable diode laser harmonic absorption spectrometers, J. Quant. Spectrosc. Ra., 49, 335–347, 1993.
Nash, J., Oakley, T., Vömel, H., and Wei, L. I.: WMO intercom-parion of high quality radiosonde systems: Yanjiang, China, 12 July–3 August 2010, IOM Rep. 107, WMO/TD-1580, 238 pp., 2011.
Ovarlez, J., Gayet, J.-F., Gierens, K., Ström, J., Ovarlez, H., Auriol, F., Busen, R., and Schumann, U.: Water vapor mea-surements inside cirrus clouds in northern and southern hemispheres during INCA, Geophys. Res. Lett., 29, 1813, doi:10.1029/2001GL014440, 2002.
Roiger, A., Aufmhoff, H., Stock, P., Arnold, F., and Schlager, H.: An aircraft-borne chemical ionization – ion trap mass spectrometer (CI-ITMS) for fast PAN and PPN measurements, Atmos. Meas. Tech., 4, 173–188, doi:10.5194/amt-4-173-2011, 2011. Schäfler, A., Dörnbrack, A., Kiemle, C., Rahm, S., and Wirth, M.:
Tropospheric water vapor transport as determined from airborne lidar measurements, J. Atmos. Ocean. Tech., 27, 2017–2030, doi:10.1175/2010JTECHA1418.1, 2010.
Seifert, M., Ström, J., Krejci, R., Minikin, A., Petzold, A., Gayet, J.-F., Schlager, H., Ziereis, H., Schumann, U., and Ovarlez, J.: Aerosol-cirrus interactions: a number based phenomenon at all?, Atmos. Chem. Phys., 4, 293–305, doi:10.5194/acp-4-293-2004, 2004.
Spichtinger, P., Gierens, K., Smit, H. G. J., Ovarlez, J., and Gayet, J.-F.: On the distribution of relative humidity in cirrus clouds, Atmos. Chem. Phys., 4, 639–647, doi:10.5194/acp-4-639-2004, 2004.
Stefanutti, L., Sokolov, L., Balestri, S., MacKenzie, A. R., and Khattatov, V.: The M-55 geophysica as a platform for the air-borne polar experiment, J. Atmos. Ocean. Tech., 16, 1303–1312, doi:10.1175/1520-0426(1999)016<1303:TMGAAP>2.0.CO;2, 1999.
Stephens, G. L., Tsay, S.-C., Stackhouse Jr., P. W., and Flatau, P. J.: The relevance of the microphysical and radiative properties of cirrus clouds to climate and climatic feedback, J. Atmos. Sci., 47, 1742–1754, 1990.
Stickney, T. M., Shedlov, M. W., and Thompson, D. I.: Goodrich total temperature sensors, Technical Report 5755, Rev.C, 1994. Ström, J. and Ohlsson, S.: In situ measurements of enhanced
crys-tal number densities in cirrus clouds caused by aircraft exhaust, J. Geophys. Res., 103, 11355–11361, doi:10.1029/98JD00807, 1998.
Voigt, C., Jeßberger, P., Jurkat, T., Kaufmann, S., Baumann, R., Schlager, H., Bobrowski, N., Guffirda, G., and Salerno, G.: Evolution of SO2, HCl, HNO3 and CO2 in the vol-canic plume from Etna, Geophys. Res. Lett., 41, 2196–2203, doi:10.1002/2013GL058974, 2014.