www.clim-past.net/10/1079/2014/ doi:10.5194/cp-10-1079-2014
© Author(s) 2014. CC Attribution 3.0 License.
Modeling of severe persistent droughts over eastern China
during the last millennium
Y. Peng1, C. Shen2,3, H. Cheng4,5, and Y. Xu6
1Department of Earth Environmental Science, Xi’an Jiaotong University, Xi’an, China
2Key Laboratory of Plateau Lake Ecology and Global Change, Yunnan Normal University, Kunming, China 3Atomspheric Sciences Research Center, State University of New York at Albany, Albany, USA
4Institute of Global Environmental Change, Xi’an Jiaotong University, Xi’an, China 5Department of Geology and Geophysics, University of Minnesota, Minneapolis, USA 6Laboratory for Climate Studies, China Meteorological Administration, Beijing, China
Correspondence to: Y. Peng ([email protected]) and C. Shen ([email protected])
Received: 29 September 2013 – Published in Clim. Past Discuss.: 20 November 2013 Revised: 16 April 2014 – Accepted: 18 April 2014 – Published: 28 May 2014
Abstract. We use proxy data and modeled data from 1000 year model simulations with a variety of climate forc-ings to examine the occurrence of severe event of persis-tent drought over eastern China during the last millennium and diagnose the mechanisms. Results show that the model was able to roughly simulate most of these droughts over the study area during the last millennium such as those that oc-curred during the periods of 1123–1152, 1197–1223, 1353– 1363, 1428–1449, 1479–1513, and 1632–1645.
Our analyses suggest that these six well-captured droughts may caused by the East Asian summer monsoon (EASM) weakening. Study on the wavelet transform and spectral anal-ysis reveals these events occurred all at the statistically sig-nificant 15–35-year timescale. A modeled data intercompar-ison suggests the possibility that solar activity may be the primary driver in the occurrence of the 1129–1144, 1354– 1365, 1466–1491 and 1631–1648 droughts as identified by the model. However another possibility that these events may be related to internal variability cannot be excluded. Al-though the El Niño–Southern Oscillation (ENSO) plays an important role in monsoon variability, a temporally consis-tent relationship between the droughts and SST pattern in the Pacific Ocean could not be found either in the modeled or proxy data. Our analyses also indicate that large volcanic eruptions play a role as an amplifier in the drought of 1631– 1648 and caused the droughts of 1830–1853 and 1958–1976, which was identified by the model.
1 Introduction
Drought is the main recurring extreme climate event that strikes eastern China. Since the frequency and intensity of droughts has increased globally in recent years as well as its significant impacts of climate extremes on economy, society, and the environment (Easterling et al., 2000; Changnon et al., 2001; IPCC, 2012), droughts have been receiving increased attention. In particular, severe multiyear droughts, because of their durations and wide area coverage, can have devastat-ing effects. For example, the most recent drought of this type, which occurred during the 1960s, caused more than 1 million deaths in China and India (Shen et al., 2007).
Zhang, 1988; Zhang and Crowley, 1989; Yan et al., 1992; Qian et al., 2003, 2012; Shen et al., 2007).
It is also important to understand the causes, and thereby improve predictions, of droughts. The precipitation change over eastern China is mainly driven by the Asian summer monsoon (ASM), which is divided into two strongly nonlin-ear interacting subsystems: the East Asian summer monsoon (EASM) and the Indian summer monsoon (ISM) (Wang et al., 2001). Wang et al. (2000) used observational data of years 1951–1996 to study possible causes for drought in northern China, and found that the western Pacific subtropical high and meridional monsoon circulation in the middle latitudes over East Asia are responsible for the occurrence of summer rainfall in northern China. On the basis of reconstructions of precipitation variability over large-scale monsoon Asia, to-gether with reconstructions of monsoon variability, it appears that four out of five episodes of “monsoon megadroughts” during the Little Ice Age (LIA) occurred over monsoon Asia within a period of generally reduced monsoon strength be-tween AD 1300 and 1700 (Sinha et al., 2011). Several candi-date forcing factors that are important and potentially inde-pendent mechanisms for monsoon failures have been linked to the occurrence of droughts over eastern China, includ-ing solar activity (Zhang and Liang, 2010; Sun and Liu, 2012), volcanic eruptions (Xu, 1986; Shen et al., 2007; Peng et al., 2009b; Zhang and Liang, 2010; Zhang et al., 2013), anomalous sea surface temperature such as the one associ-ated with ENSO (e.g., Huang and Wu, 1989; Liu and Ding, 1992; Zhang and Xue, 1994; Lau and Weng, 2000; Li et al., 2005, 2010; Shen et al., 2007) and Pacific Decadal Oscil-lation (PDO, e.g., Zhu and Yang, 2003; Shen et al., 2006), and anomalous sea level pressure such as North Atlantic Os-cillation (NAO, e.g., Sung et al., 2006; Yang et al., 2012; Barriopedro et al., 2012). A great deal of work has been carried out on drought events, but the possible mechanism remains unclear because of the complex climate system in eastern China.
The modeling approach, as a powerful tool, allows us to study the characteristics of severe persistent drought of the last millennium and provides important insights into the mechanisms that cause these climate variations. Most gen-eral circulation models (GCMs) have often been used to sim-ulate precipitation changes for the region as well as extreme departures from mean conditions, including severe droughts, and the related large-scale atmospheric circulation (Seager et al., 2005; Meehl and Hu, 2006; Yu et al., 2013). Based on a 1360-year control run from a global coupled climate model, Meehl and Hu (2006) linked the megadroughts in the south-western US and the Indian monsoon regions, which represent extreme events of naturally occurring multidecadal precipita-tion variaprecipita-tions, to the dominant pattern of multidecadal SST variability in the Indian and Pacific Oceans. Another mod-eling study suggested that variations in solar insolation are the main drivers for the SST anomalies in the Indian Ocean (Polanski et al., 2013). Analysis of the simulations produced
by the Earth system model indicates the long-term changes of the East Asia summer monsoon are dominated by the land– sea thermal contrast change (Man et al., 2012), which may be associated with the variations in external radiative forcing (insolation, volcanic aerosol, and greenhouse gases) coupled with the remote impact of the internal dynamics of climate modes in the oceans, such as ENSO and PDO, suggested by other model studies (Liu et al., 2011). However, few works have focused on understanding the occurrence of the severe decadal droughts in China, although studies to date have re-vealed some extreme persistent drought events over the last thousand years (e.g., Zhang, 2005; Zheng et al., 2006; Shen et al., 2007; Qian et al., 2012).
In this study, we will examine the occurrence of severe events of persistent drought over eastern China (east of 105◦E, 25–40◦N) during the last millennium by combining
proxy and modeled data and explore possible causes for se-vere persistent drought events using the simulated data.
2 Data and model
The data used in this study include proxy and modeled data of rainy season precipitation (May–September) over eastern China. The former is a data set of the dryness-wetness index (DWI), a proxy data set of rainy season precipitation over eastern China from 1470 to 2000 derived from Chinese his-torical documents and instrumental measurements (CNMA, 1981; Zhang et al., 2003). This data uses five grades, 1 – very wet, 2 – wet, 3 – normal, 4 – dry, and 5 – very dry, to describe climate conditions for 120 stations in China. The relative fre-quencies of five grades (i.e. 10, 25, 30, 25, and 10 %), are de-fined by observed rainfall anomalies (Zhang, 1988; Wang et al., 2000). Recently, this unique historical data set from 69 of the 120 stations covering the area located mainly in eastern China (25–41◦N, 105–122◦E) has been interpolated to reg-ular gridded data by Wei et al. (2007). Their gridded data, with a spatial resolution of 0.5◦×0.5◦, are used here. Ad-ditionally, 1000-year time series of regional DWI over east-ern China (east of approximately 105◦E; 25–40◦N) recon-structed by Zheng et al. (2006) are also analyzed. This data set, with 10-year time resolution, is also derived from Chi-nese historical documents.
component is the NCAR implementation of the POP (Parallel Ocean Program, Smith and Gent, 2002) and has a longitudi-nal resolution of∼3.6◦ and variable latitudinal resolutions
of ∼1.8◦and up to∼0.9◦ in the tropics. The sea ice com-ponent is a dynamic–thermodynamic model with same hor-izontal grid as the ocean component. Four simulations are conducted, including a control run, a run with orbital and solar forcing, a run with orbital and volcanic forcing and an-other run with full forcing (Peng et al., 2009a). Forcing time series used in runs include the global and seasonal change of the orbital insolation (Berger, 1978), the solar variation and volcanic eruption (Crowley et al., 2003), and the greenhouse gases (Ammann et al., 2007).
Monthly mean precipitation flux data from the Coupled Model Intercomparison Project – phase 5 (CMIP5) past1000 and historical experiments are also used here. The past1000 simulations, available at http://cmip-pcmdi.llnl.gov/index. html, were performed with multi-models. From each GCM, only one run is used and only if it is available both for the last millennium and the historical experiments, and if it com-pletely covers the 1000–2000 period. We also exclude the simulation with MIROC-ESM since it shows a problematic long-term drift (Bothe et al., 2013), and the CSIRO data, as they consider solar forcings as presented by Steinhilber et al. (2009), which are different from the other models. Thus, GCMs from the CMIP5 used in our study include bcc-csm1-1 (BCC), CCSM4, GISS-R24 (GISS), MPI-ESM-P (MPI), and IPSL-CM5ALR (IPSL).
3 The index of land–sea thermal difference
The occurrence of the EASM variability is a consequence of the atmospheric response to the diabatic heating between the ocean and the land (Li and Yanai, 1996). Sun et al. (2002) found the EASM region to be not only under the effect of zonal but also meridional land–sea thermal difference. Sun et al. (2000) defined an index of land–sea thermal difference (ILSTD) that includes zonal and meridional land–sea ther-mal difference. Zonal therther-mal difference is defined as sur-face temperature difference between eastern China (the land at 27–35◦N and east of 105◦E) and the northwestern Pa-cific (15–30◦N, 120–150◦E). Meridional thermal difference is defined as surface temperature difference between South China (the land south of 27◦N and east of 105◦E) and the South China Sea (5–18◦N, 105–120◦E). The zonal thermal
difference accounts for 80 % of the land–sea thermal dif-ference and the meridional thermal difdif-ference accounts for 20 %. The choice of monsoon index here is somewhat sub-jective because there are many types of EASM indices. The index provides a direct measurement of large-scale thermal difference between the land and sea for the EASM variabil-ity and thus it is used as an EASM index in the present study.
4 Results
4.1 Severe persistent droughts that occurred over eastern China in the last millennium
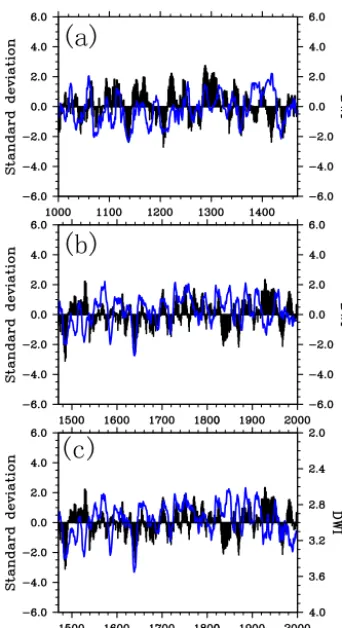
Figure 1 shows the precipitation variation in proxy data and full-forcing CCSM2.0 modeled data over eastern China dur-ing the last 1000 years. Due to the 10-year runndur-ing average being involved in developing regional DWI for eastern China over last 1000-year, high-frequency variability in the regional DWI time series was removed (Zheng et al., 2006). There-fore, this data set has a 10-year time resolution. For matching the time resolution of the DWI index series from the proxy data of Zheng et al. (2006), the DWI series from the proxy data of Zhang et al. (2003) and modeled data have all been subjected to a 10-year running mean to remove the effects of interannual variability and to retain variability on timescales of just under a decade and longer. After the smoothing, the modeled precipitation time series are standardized. The gen-eral impression from the figure is that the simulation pro-duces a temporal variability similar to that observed in proxy data, except during the periods of 1360–1420, the 16th cen-tury, and after 1820. The correlation between the simulation and reconstruction by Zheng et al. (2006) is significant by the Pearson’srtwo-tailed test (r= 0.17,P <0.01). We note the long poor matches between model and proxy data that occur in the last century. One possible reason is that our model overestimates the response to increasing greenhouse gas forcing. The greenhouse-gas-induced increase of rainy season precipitation over eastern China (Peng et al., 2009a) largely overwhelms the other forcings. An alternative is that a number of potentially important forcings are not considered in the simulations studied here, such as the climate effects of black carbon aerosols (Xu, 2001; Menon et al., 2002) and human-induced land cover changes (Fu, 2002, 2003).
(a)
(b)
(c)
Year(AD)
Figure 1. The rainy season precipitation anomaly (May–
September) from the modeled data (black bars) and DWI from the proxy data (blue curve) of Zheng et al. (2006) over eastern China during the last 1000 years (a, b). (c) Same as (b) but from the proxy data of Zhang et al. (2003) during the last 530 years. All data are 10-year running averages.
corresponds closely to the drought classification scheme of 10 % of occurrence (Solomon et al., 2007). In this classifi-cation, the proxy data show that 10 severe decadal droughts have occurred during the last millennium, and most of them overlap with the model results, that is, the droughts of 1123– 1152, 1197–1223, 1353–1363, 1428–1449, 1479–1513, and 1632–1645 (Table 1). However, the model underestimates the severity and length of the drought from 1066 to 1092 and misses two droughts in the 16th century and one drought in the late 12th century detected in the proxy data. Figure 1 and Table 1 also reveal some rather peculiar model behav-ior during the early 15th century, the middle 19th century and the middle 20th century. Although the proxy data show a very wet period occurring from 1407 to 1426 over eastern China, severe drought conditions are found using other proxy data in other regions over monsoon Asia, such as in India (Sinha et al., 2007), central China (Zhang et al., 2008), and southern Vietnam (Buckley et al., 2010). The spatiotemporal pattern during this period, revealed by the proxy data over monsoon Asia, is associated with the warmer tropical Indian
Table 1. Severe decadal droughts over eastern China during the last
millennium are identified in proxy and simulated data. Bold-faced years are the droughts captured by both the proxy and simulated data.
Century Droughts in the Droughts in 1000 year DWI the simulation series (mean value) (mean value)
1000–1099 1066–1092 (−1.33) – (−0.20)
1100–1199 1123–1152 (−1.26) 1129–1144 (−1.24)
1169–1186 (−1.10) – (0.26)
1200–1299 1197–1223 (−1.14) 1186–1214 (−0.97)
1300–1399 1353–1363 (−1.19) 1354–1365 (−1.23)
1400–1499 – (1.61) 1407–1426 (−1.09)
1428–1449 (−1.15) 1435–1448 (−1.12) 1479–1513 (−1.01) 1466–1491 (−1.21)
1500–1599 1522–1537 (−0.91) – (0.92) 1580–1591 (−1.07) – (0)
1600–1699 1632–1645 (−1.66) 1631–1648 (−1.37)
1700–1799 – –
1800–1899 – (0.97) 1830–1853 (−1.22) 1900–1999 – (0.29) 1958–1976 (−0.93)
and western Pacific as well as the cooler tropical eastern Pa-cific Ocean (Graham et al., 2011), which the model can not produce (not shown). Although significant decreases in rainy season precipitation over eastern China during the periods of 1830–1853 and 1958–1976 are observed in the data set of DWI consisting of 48 regions (Zheng et al., 2006), the cli-mate in these two periods was still considered to be at wet or normal conditions. It seems it is possible that the model overestimates the decreasing trends in rainy season precip-itation in the period of the 1830s and 1960s. However, we also note drought conditions during the middle 20th century could be observed in the data set of DWI consisting of 69 re-gions. Significant differences in precipitation during 1960s between these two proxy data sets indicate that too many missing records in the proxy data of Zheng et al. (2006) will likely have a significant effect on a hydrologic assess-ment. Furthermore, the D/W index has been criticized. Ge et al. (2007) point out the D/W index is a qualitative rather than a quantitative reconstruction of precipitation and not as use-ful as other proxy data in detailing truly large-scale precipi-tation variations and model-data comparisons. Thus, having such a large uncertainty in proxy data reconstruction from historical documents, it is also possible that the proxy data underestimates the decreasing trends in rainy season precip-itation during these two periods.
(a) (b)
(c)
(e) (f)
(g) (h)
(d)
Figure 2. Modeled precipitation anomalies (mm day−1) of the six well-captured droughts (a–f) and the last two regional droughts identified from the historical records from the periods 1479– 1513 (g) and 1632–1645 (h).
regions of eastern China, but with different drought cen-ters. In the proxy data, the great drought during the period of 1479–1513 stretched over most regions of eastern China (Fig. 2g), with the most severe conditions located in north-ern China (Sun et al., 2012). The model produces this ma-jor drought, with the locations of maximum drought in the middle-lower Yangtze River valley (Fig. 2e). In the proxy reconstructions, between 1632 and 1645, most regions over eastern China experienced drought, with the driest condi-tions centered in the north of China (Fig. 2h). The model
produces this widespread drought, with the locations of max-imum drought in the middle-lower Yangtze River valley (Fig. 2f). The pattern correlations over eastern China be-tween changes in modeled precipitation anomalies and DWI (Zhang et al., 2003) are−0.59 and−0.83 during theses two droughts, respectively. Note that for our purposes, the mod-eled precipitation is regridded from their native resolution to an even 0.5◦×0.5◦grid. It seems CCSM2.0 overestimates the drought conditions in the regions south of 35◦N, whereas it underestimates in the regions north of 35◦N during the last two droughts. Our previous work (Shen et al., 2009) have indicated that CCSM2.0’s performance in simulating the ef-fect of the Tibetan Plateau on precipitation needs to be im-proved. In spite of these errors, the model simulates the gen-eral features of these six severe persistent droughts in terms of drought intensity and duration. The droughts in the model overlap with the paleoclimate record, which would be ex-pected: the model is capable of producing these droughts that are characteristic of the paleoclimate record and the modeled severe decadal droughts are a forced response. Among the six well-captured droughts, the first three appeared in the warm period of Medieval Climate Anomaly (MCA), whereas the other three occurred in the cold period of the LIA. The next question is, since they happened in different climatic back-grounds, which natural forcing causes these severe persistent drought events with long periods of time, great intensity, and extensive coverage.
4.2 Possible causes of six well-captured droughts 4.2.1 The possible relationships between DWI and
climate forcings
thermal contrast, which favors the weakening of the EASM. Using the data network of DWI over eastern China during last 500 years (Zhang et al., 2003), some previous studies investigated the relationships of precipitation variation over eastern China with such climate forcing factors. The occur-rence of a quasi-centennial oscillation in precipitation over eastern China might have been associated with the solar forc-ing fluctuation on the quasi-centennial timescale (Zhu and Wang, 2001). Shen et al. (2007, 2008) suggested that large volcanic eruptions could trigger exceptional droughts over eastern China, and found a significant correlation between volcanic eruption events and droughts over eastern China during the last 500 years. The data network of DWI over east-ern China during last 530 years have also been successfully used to reconstruct the annual PDO index, indicating that PDO has strong impacts on rainy season precipitation over eastern China (Shen et al., 2006).
To assess the possible linkage between DWI of Zheng et al. (2006) and SSTs in the Pacific Ocean during the last millennium, we examine a 700-year tree-ring-based, high-resolution reconstruction of Niño3.4 SSTs (Li et al., 2013) and a 1000-year tree-ring-based reconstruction of the PDO (MacDonald and Case, 2005). As shown by Fig. 3, we do not find sufficient justification to cite ENSO as the causative force that brought about the severe persistent droughts over eastern China. Take the well-captured droughts for exam-ple: the proxy ENSO reconstructions suggest El Niño-like mean states were sustained through the droughts of 1353– 1363 and 1479–1513, and La Niña-like mean states were sus-tained through the droughts of 1428–1449 and 1632–1645. The PDO was generally neutral or more La Niña-like dur-ing each severe persistent drought interval except durdur-ing the drought of 1479–1513. This result is also found in all of mon-soon Asia. By comparing a series of proxy records that reflect changes in El Niño frequency or the mean state of ENSO in the tropical Pacific, Sinha et al. (2011) also found there is no conclusive evidence to suggest that the megadroughts in monsoon Asia were associated with anomalous sea surface temperature anomalies that were solely the result of ENSO-like variability in the tropical Pacific. We also did not find that the dry/wet conditions over eastern China in proxy data strongly responded to the solar activity during the last mil-lennium. The low-frequency variations of the DWI series and solar forcing series (Vieria et al., 2011), after 10 and 30-year smoothing, are not significantly correlated with each other,
r= 0.04 and 0.06, respectively. A direct comparison between DWI and the volcanic forcing time series (Gao et al., 2008) can also be made in Fig. 3, which shows that dry conditions or significant decreases in precipitation over eastern China occurred in active periods of volcanic eruption. However, the correlation coefficient is−0.04 between these two series. These results provide evidence that hydroclimate variability in eastern China is not solely a response to only one climate forcing change.
Year(AD)
(b)
(c)
(d)
(e)
(a)
Figure 3. Climate records during the last millennium. (a) DWI from
Zheng et al. (2006) over eastern China. The area between the black line and zero is colored red for the region below zero. (b) Tree-ring-based Niño3.4 SSTs from Li et al. (2013). (c) Tree-ring-Tree-ring-based PDO reconstruction from MacDonald and Case (2005). The area between the black line and zero is colored red for the region below zero.
(d) The solar forcing of total solar irradiance (W m−2) from Vieria et al. (2011). (e) The volcanic forcing of global sulfate aerosol (Tg) from Gao et al. (2008).
4.2.2 Possible causes of six well-captured droughts revealed by the model
(a) (b)
(c)
(e) (f)
(d)
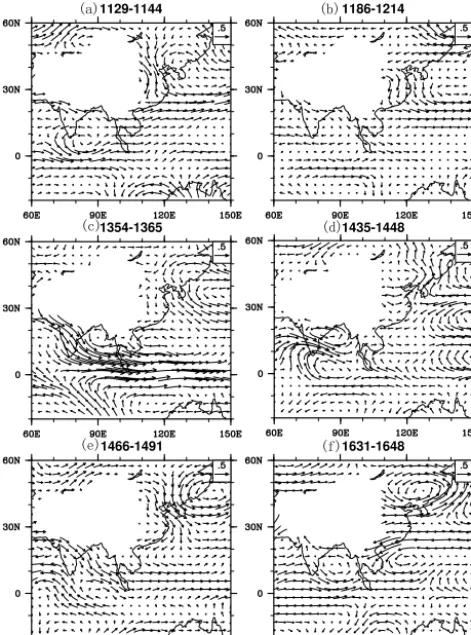
Figure 4. Same as Fig. 2 but for the wind at the level of 850hpa for
the six well-captured droughts.
et al., 2011). For changes of land–sea thermal contrast that lead to the EASM monsoon changes suggested by Man et al. (2012), we used an index of land–sea thermal difference (ILSTD) that describes its zonal and meridional strength re-sponsible for EASM circulation (Sun et al., 2002) in order to study its relation to the East Asian monsoon circulation and the summer rainfall over China during these droughts (Fig. 5). Results show that the land–sea thermal difference is generally strong during the MCA, weak during the LIA, and strong again after 1700. The results are consistent with the reconstructions of monsoon variability from the speleothem oxygen isotope records in Wanxiang Cave (Zhang et al., 2008) and Dongge Cave (Wang et al., 2005) in China, show-ing that the long-term changes of EASM are dominated by the land–sea thermal contrast change. The decadal varia-tions of rainy season precipitation over eastern China cor-relates significantly with the land–sea thermal contrast dur-ing the last millennium (r= 0.21,p <0.01), and six droughts that occurred in the periods following a weak index corre-sponding to the weak EASM, suggesting that the changes of land–sea thermal contrast may contribute to the weak sum-mer monsoon during periods of these droughts. Note that not each weak index periods results in a severe persistent drought
Year(AD)
ILSTD
Figure 5. The 10-year running mean time series of standardized
anomaly variations for the index of land–sea thermal difference (IL-STD). Six well-captured severe decadal droughts occurred during the periods 1129–1144, 1186–1214, 1354–1365, 1435–1448, 1466– 1491 and 1631–1648 are shown with red bars.
event in the model. The land–sea thermal contrast is, there-fore, not the only mechanism driving persistent precipitation anomalies over eastern China in the CCSM2.0 model, and the climatological mechanism for severe decadal drought events is more complex than those we discuss here.
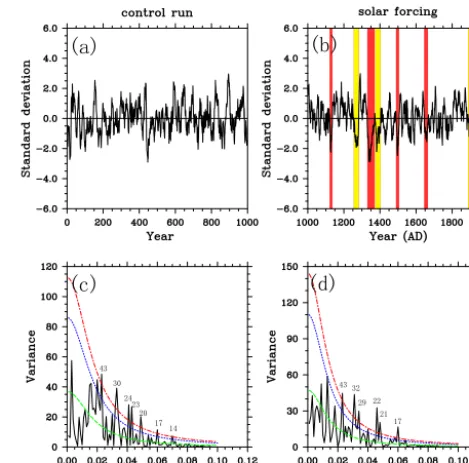
To examine possible causes of these monsoon failures (droughts), first of all, wavelet analysis is used to inves-tigate how the dominant timescales of drought variability change with time. Study of the wavelet transform in the 10-year running average precipitation series has detected the cy-cle periods. Figure 6 shows the wavelet coefficients for the timescale 8–128 years over the period of the last thousand years. Bidecadal variability (15–35 years) exists throughout the last millennium, and for all six well-captured droughts and elevated aridity in the mean, bidecadal variability is evident, with some statistically significant strength also in the multidecadal bands (50–70 years). The presence of a bidecadal rhythm in eastern China precipitation variability has been noted in the past from observations, proxy records, and other simulation data over eastern China (Lin and Yu, 1987; Jiang et al., 1997; Zhu and Wang, 2001; Qi et al., 2001; Qian et al., 2003, 2012; Liu et al., 2011; Shen et al., 2009). To examine possible attributions of the 15–35-year oscillation, we also conduct spectral analysis on the modeled rainy season precipitation from the control run and solar run. As shown by Fig. 7c and d, the bidecadal peaks in the 15– 35 years revealed in the control run match those in the solar forcing run, which is consistent with the length of cycles in oceanic records such as PDO, with fluctuations at periodici-ties of 15 and 20–30 years and with NAO fluctuations at pe-riodicities of 20 years, and similar to solar radiation cycles of 22 years in the Hale solar magnetic cycle. Thus, it strength-ens the argument that solar activity and the internal variabil-ity of the climate system may be the driver of these severe persistent drought occurrences in the model.
Figure 6. The real-part coefficients of wavelet transform of the
sim-ulate precipitation series. The thick contour encloses regions with greater than 95 % confidence of wavelet power. Six well-captured severe decadal droughts of 1129–1144, 1186–1214, 1354–1365, 1435–1448, 1466–1491 and 1631–1648 are shown with gray bars.
warming in SSTs in the last 100 years may exaggerate the cold SST anomalies during the LIA. As shown by Fig. 8, a temporally consistent relationship between the droughts and SST pattern in the Pacific Ocean also could not be found in the model. There is an El Niño-like SST pattern occur-ring duoccur-ring the droughts of 1129–1144, 1435–1448, 1466– 1491 and 1631–1648; a La Niña-like SST pattern during the droughts of 1354–1365; and a neutral pattern during the droughts of 1186–1214.
Figure 7b shows the precipitation time series over eastern China during the last millennium in solar forcing run and the severe persistent drought events that were identified in the same way in the full forcing run. Over the last thousand years, the effective solar radiation forcing has experienced six periods of significant minimum; these occurred during the periods of 950–1150, 1250–1350, 1400–1550, 1645–1715, and 1790–1830, and around 1900. It is of interest to ob-serve that all the severe decadal droughts identified in the solar forcing run occurred following the minimum effective solar radiation forcing, except that during the Dalton Mini-mum (1790–1830). The droughts of 1129–1144, 1354–1365, 1466–1491, and 1631–1648 detected in the full forcing run are also identified in the solar forcing run, albeit with fre-quent phase shifts of severe years or so. Overlap between the droughts in solar forcing run and full forcing run may indi-cate the possibility that solar activity plays a dominating role in these droughts. However, we cannot exclude another pos-sibility that any overlap between these two runs may occur by chance. Both the droughts of 1186–1214 and 1435–1448 are not detected in the solar forcing run, suggesting that other factors may have caused these two drought events.
One other possible forcing responsible for drought events over eastern China is volcanic eruption. In our previous work (Peng et al., 2009b), a modeling analysis of response of rainy season precipitation over eastern China to large volcanic
(a) (b)
(c) (d)
43 30
23 20
17 24
14
43
17 22 29 32
21
Figure 7. The 10-year running mean time series of standardized
anomaly variations of rainy season precipitation rate derived from the control run (a) and solar forcing run (b), and the corresponding spectra in the control run (c) and solar forcing run (d). The statistical significance of the spectral peaks was tested against the red noise spectrum at the 95 % (red dashed line), 90 % (blue dashed line) and 50 % (green dashed line) confidence levels. The severe droughts in the solar forcing run are shown with shaded bars and those that are also observed in the full forcing run are shown with red bars.
(a) (b)
(c)
(e) (f)
(d)
Figure 8. Same as Fig. 2 but for the 100-year high-pass filtered global sea surface temperature anomalies map of the six well-captured
droughts. The 100-year high-passed data were used because a strong warming in SSTs in the modern period may exaggerate the cold SST anomalies during the LIA.
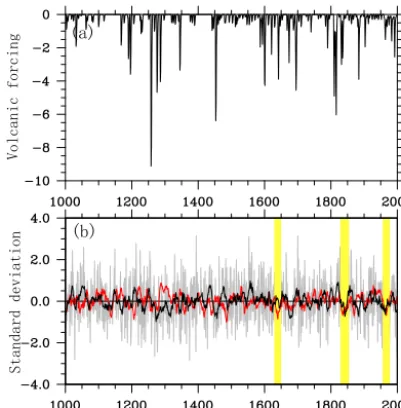
value of−6 W m−2in the next year (Fig. 8a). The response to these eruptions are evident; events in the full forcing run caused more than a 1-σ decrease in precipitation in 1644, 1835 and 1964 and more than a 2-σ decrease in 1643, which is large enough to explain observed droughts. As shown in Fig. 9b, the 1830–1853 and 1958–1976 droughts detected in the full forcing run are captured well in the volcanic forcing run, which strengthens the argument that these two events are forced by volcanic eruptions in the model.
4.3 Comparison with multiple model experiments
To further investigate whether the characteristics of severe persistent droughts over eastern China revealed by CCSM2.0 are robust across multiple model experiments, we also present results for multi-model comparisons using 5 simula-tions from the collection of experiments from the last millen-nium in the CMIP5 archive. Figure 10 clearly displays that
(a)
(b)
Year(AD)
Standard deviation
Volcanic forcing
Figure 9. Volcanic forcing series used by the model shown in
W m−2(a). Time series of standardized anomaly variations of rainy
season precipitation rate derived from the volcanic forcing run (b). Annual anomalies (gray curve) are shown along with smoothed ver-sions using a 10-year running average (black curve). Red curve presents the 10-year running mean time series of standardized anomaly variations of rainy season precipitation rate derived from the full forcing run. The droughts that occurred during 1631–1648, 1830–1853 and 1958–1976 are shown with shaded bars.
5 Discussion and conclusions
We have presented results from model simulations of se-vere persistent droughts over eastern China during the last millennium. On the decadal timescale, eastern China expe-rienced 10 major multiyear droughts during the last thou-sand years. Although two great droughts in the 16th century and one drought in the late 12th century are missed by the model and the reason why is still not clear, the CCSM2.0 forced by a variety of climate forcing during the last millen-nium was able to roughly simulate 6 of these 10 droughts, that is, the droughts of 1123–1152, 1197–1223, 1353–1363, 1428–1449, 1479–1513 and 1632–1645.
Our analysis suggests that the case for repeated occur-rences of severe persistent droughts, identified both in the proxy and modeled data, is caused by EASM weakening, and supports the suggestion that the land–sea thermal con-trast changes may be attribute to the reduced monsoon in eastern Asia during these periods. The wavelet analysis of the summer precipitation variability over eastern China re-veals that bidecadal variability (15–35 years) exists and was prominent throughout the last millennium. It dominates in the arid period of six well-captured droughts. A model-data intercomparison suggests that the bidecadal oscillation could be associated with internal variability of the climate system and the solar activities. It indicates that variations in solar
Figure 10. Comparisons between reconstructed and modeled rainy
insolation coupled with the remote impact of the internal dy-namics of climate modes are some of the major drivers lead-ing to persistent server drought over eastern China.
While the climate dynamics associated with the ENSO and its low-frequency counterpart PDO have been shown to ex-ert considerable, albeit intermittent, influences on monsoon rainfall over eastern China during the instrumental period, both our analyses of reconstructions and simulations does not reveal a clear role of the ENSO in causing these severe decadal droughts. The solar activities may be the ultimate driver of four severe persistent droughts (1129–1144, 1354– 1365, 1466–1491 and 1631–1648) over eastern China, as ev-idenced by the ability of the model to reproduce these when only the solar forcing are specified. However, due to three aspects: (1) the timing of the observed events and modeled ones have some overlap but the events do not occur exactly at the same time; (2) there is no significant correlation be-tween solar forcing and drought frequency in the proxy data; and (3) CMIP5 models driven by similar solar forcings do not display droughts during those periods that would indicate a robust response to the forcing, another possibility that these events may be related to internal variability cannot be ex-cluded. The factor which caused the droughts of 1186–1214 and 1435–1448 in the model is still not clear. The volcanic eruptions play a role as an amplifier during the period 1631– 1648 and caused the drought events of 1830–1853 and 1958– 1976 in the model.
Due to the uncertainties in the reconstructions, including forcing and precipitation and the models of chaotic compo-nents of internal variability, models could not reproduce the exact variability registered in the proxy data. Furthermore, the uncertainty due to structural differences, parametriza-tions, and different forcing and initial condition sets causes lack of consistency among multi-model ensembles. Finally, drought events that occurred over eastern China may have resulted from a series of complex climatic processes that are much more complicated than those we discussed here. Thus, the results presented here only allow a tentative conclusion.
Acknowledgements. The authors are deeply grateful to the editor and the two anonymous referees for providing a thorough review and constructive comments. Our manuscript was improved sig-nificantly thanks to their support. This work is supported by the National Basic Research Program of China (grant #2013CB955904, 2013CB955902, 2010CB950102), the National Natural Science Foundation of China (grant #41230524), 2013 Yunnan project for the introduction of advanced talents (grant #2013HA024), and the grant from the Office of Science (BER), US Department of Energy.
Edited by: H. Goosse
References
Ammann, C., Joos, F., Schimel, D., Otto-Bliesner, B., and Tomas, R.: Solar influence on climate during the past millennium: re-sults from transient simulations with the NCAR Climate System Model, P. Natl. Acad. Sci. USA, 104, 3713–3718, 2007. Barriopedro, D., Gouveia, C., Trigo, R., and Wang, L.: The 2009/10
Drought in China: Possible Causes and impacts on vegetation, J. Hydrometeorol., 13, 1251–1267, 2012.
Berger, A.: Long-term variations of daily insolation and quaternary climatic changes, J. Atmos. Sci., 35, 2362–2367, 1978. Bothe, O., Jungclaus, J. H., and Zanchettin, D.: Consistency of the
multi-model CMIP5/PMIP3-past1000 ensemble, Clim. Past, 9, 2471–2487, doi:10.5194/cp-9-2471-2013, 2013.
Buckley, B., Anchukaitis, K., Penny, D., Fletcher, R., Cook, E., Sano, M., Nam, L., Wichienkeeo, A., Minh, T., and Hong, T.: Climate as a contributing factor in the demise of Angkor, Cam-bodia, P. Natl. Acad. Sci., 107, 6748–6752, 2010.
Changnon, S., Changnon, J., and Hewings, G.: Losses caused by weather and climate extremes: a national index for the United States, Phys. Geogr., 22, 1–27, 2001.
Cheng, Q. and Zhou, T.: Multidecadal variability of North China aridity and its relationship to PDO during 1900–2010, J. Climate, 27, 1210–1222, doi:10.1175/JCLI-D-13-00235.1, 2014 CNMA – Chinese National Meteorological Administration: Yearly
charts of dryness/wetness in China for the last 500-year period, Chinese Cartographic Publishing House, Beijing, 1981. Crowley, T., Baum, S., Kim, K., Hegerl, G., and Hyde, W.:
Mod-elling ocean heat content changes during the last millennium. Geophys. Res. Lett., 30, 1932, doi:10.1029/2003GL017801, 2003.
Easterling, D., Meehl, G., Parmesan, C., Changnon, S., Karl, T., and Mearns, L.: Climate extremes: observations, modeling, and impacts, Science, 289, 2068–2074, 2000.
Fu, C.: Can human induced land-cover change modify the monsoon system? In: Steffan W, Jager J, Carson WJ, Bradshaw C (eds) Challenges of a changing earth, Springer, Berlin, 133–136, 2002. Fu, C.: Impacts of human-induced land cover change on East Asia
monsoon. Global Planet. Change, 37, 219–229, 2003.
Gao, C. C., Robock, A., and Ammann, C.: Volcanic forcing of climate over the past 1500 years: an improved ice core-based index for climate models, J. Geophys. Res., 113, D23111, doi:10.1029/2008JD010239, 2008.
Ge, Q., Wang, S., Wen, X., Shen, C., and Hao, Z.: Temperature and precipitation changes in China during the Holocene, Adv. Atmos. Sci., 6, 1024–1036, 2007.
Graham, N., Ammann, C., Cobb, K., Fleitmann, D., and Lutherbacher, J.: Support for global Climate reorganization dur-ing the “Medieval Climate Anomaly”, Clim. Dynam., 37, 1217– 1245, 2011.
Huang, R. and Wu, Y.: The influence of ENSO on the summer cli-mate change in China and its mechanism, Adv. Atmos. Sci., 6, 21–32, 1989.
Jang, J., Zhang, D., and Klaus, F.: Historic climate variability of wetness in East China (960–1992): a wavelet analysis, Int. J. Cli-matol., 17, 969–981, 1997.
Kiehl, J. and Gent, P.: The Community Climate System Model, ver-sion 2, J. Climate, 17, 3666–3682, 2004.
Lau, K. and Weng, H.: Coherent modes of global SST and summer rainfall over China: an assessment of the regional impacts of the 1997–98 El Niño, J. Climate, 14, 1294–1308, 2000.
Li, C. and Yanai, M.: The onset and interannual variability of the Asian summer monsoon in relation to land-sea thermal contrast, J. Climate, 9, 358–375, 1996.
Li, H., Dai, A., Zhou, T., and Lu, J.: Response of East Asian summer monsoon to historical SST and atmospheric forcing during 1950– 2000, Clim. Dynam., 34, 501–514, 2010.
Li, J., Xie, S. P., Cook, E. R., Morales, M. S., Christie, D. A., John-son, N. C., Chen, F., D’Arrigo, R., Fowler, A. M., Gou, X., and Fang, K.: El Nino modulations over the past seven centuries, Nat. Clim. Change, 3, 822–826, 2013.
Li, Q., Yang, S., Kousky, V., Higgins, R., Lau, K., and Xie, P.: Fea-tures of cross-pacific climate shown in the variability of China and US precipitation, Int. J. Climatol., 25, 1675–1696, 2005. Lin, X. and Yu, S.: Evidence of a 22-year Cycle of Drought in China
Related to the Hale Solar Cycle, J. Appl. Meteorol. Sci., 1, 43– 50, 1987.
Liu, J., Wang, B., Wang, H., Kuang, X., and Ti, R.: Forced response of the East Asian summer rainfall over the past millennium: re-sults from a coupled model simulation, Clim. Dynam., 36, 323– 336, 2011.
Liu, Y. and Ding, Y.: Influence of El Niño events on weather and climate in China, Acta Meteorol. Sin., 6, 117–131, 1992. MacDonald, G. M. and Case, R. A.: Variations in the Pacific decadal
oscillation over the past millennium. Geophys. Res. Lett., 32, L08703, doi:10.1029/2005GL022478, 2005.
Man, W., Zhou, T., and Johann, H.: Simulation of the East Asian Summer Monsoon during the Last Millennium with the MPI Earth System Model, J. Climate, 25, 7852–7866, 2012. Meehl, G. and Hu, A.: Megadroughts in the Indian monsoon region
and southwest North America and a mechanism for associated multidecadal Pacific sea surface temperature anomalies, J. Cli-mate, 19, 1605–1623, 2006.
Meehl, G. and Hu, A.: Mechanisms of drought in present and fu-ture climate. In: Program for the 33rd Annual Climate Diagnos-tics & Prediction Workshop/CLIVAR Drought Workshop, Lin-coln, 3 pp., 2008.
Menon, S., Hansen, J., Nazarenko, L., and Luo, Y.: Climate effects of black carbon aerosols in China and India, Science, 297, 2250– 2253, 2002.
Peng, Y., Xu, Y., and Jin, L.: Climate changes over eastern China during the last millennium in simulations and reconstructions, Quaternary Int., 208, 11–18, 2009a.
Peng, Y., Shen, C., Wang, W., and Xu, Y.: Response of rainy season precipitation over Eastern China to large volcanic eruptions, J. Climate, 23, 818–824, 2009b.
Polanski, S., Fallah, B., Prasad, S., and Cubasch, U.: Simulation of the Indian monsoon and its variability during the last millennium, Clim. Past Discuss., 9, 703–740, doi:10.5194/cpd-9-703-2013, 2013.
Qian, W., Hu, Q., Zhu, Y., and Lee, D.: Centennial-scale dry-wet variation in East Asia, Clim. Dynam., 21, 77–89, 2003.
Qian, W., Shan, X., Chen, D., Zhu, C., and Zhu, Y.: Droughts near the northern fringe of the East Asian summer monsoon in China during 1470–2003, Climatic Change, 110, 373–383, 2012. Seager, R., Kushnir, Y., Herweijer, C., Naik, N., and Velez, J.:
Mod-eling of Tropical Forcing of Persistent Droughts and Pluvials over Western North America: 1856–2000, J. Climate, 18, 4065– 4088, 2005.
Shen, C., Wang, W., Gong, W., and Hao, Z.: A pacific decadal os-cillation record since 1470 AD reconstructed from proxy data of summer rainfall over Eastern China, Geophys. Res. Lett., 33, L03702, doi:10.1029/2005GL024804, 2006.
Shen, C., Wang, W., Hao, Z., and Gong, W.: Exceptional drought events over Eastern China during last five centuries, Climatic Change, 85, 453–471, 2007.
Shen, C., Wang, W., Hao, Z., and Gong, W.: Characteris-tics of anomalous precipitation events over eastern China during the past five centuries, Clim. Dynam., 4, 463–476, doi:10.1007/s00382-007-0323-0, 2008.
Shen, C., Wang, W.-C., Peng, Y., Xu, Y., and Zheng, J.: Variabil-ity of summer precipitation over Eastern China during the last millennium, Clim. Past, 5, 129–141, doi:10.5194/cp-5-129-2009, 2009.
Sinha, A., Cannariato, K., Stott, L., Cheng, H., Edwards, R., Yadava, M., Ramesh, R., and Singh, I.: A 900-year (600 to 1500 A.D.) record of the Indian summer monsoon precipitation from the core monsoon zone of India. Geophys. Res. Lett., 34, L16707, doi:10.1029/2007gl030431, 2007.
Sinha, A., Stott, L., Berkelhammer, M., Cheng, H., Lawrence Ed-wards, R., Buckley, B., Aldenderfer, M., and Mudelsee, M.: A global context for megadroughts in monsoon Asia during the past millennium, Quaternary Sci. Rev., 30, 47–62, 2011.
Smith, R. and Gent, P.: Reference manual for the Parallel Ocean Program (POP); ocean component of the Community Climate System Model (CCSM-2), http://www.cesm.ucar.edu/models/ ccsm2.0.1/pop/ (last access: May 2014), 2002.
Solomon, S., Qin, D., Manning, M., Alley, R., Berntsen, T., Bind-off, N., Chen, Z., Chidthaisong, A., Gregory, J., Hegerl, G., Heimann, M., Hewitson, B., Hoskins, B., Joos, F., Jouzel, J., Kattsov, V., Lohmann, U., Matsuno, T., Molina, M., Nicholls, N., Overpeck, J., Raga, G., Ramaswamy, V., Ren, J., Rustic-ucci, M., Somerville, R., Stocker, T., Whetton, P., Wood, R., and Wratt, D.: Technical Summary, in: Climate Change 2007: The Physical Science Basis, in: Contribution of Working Group I to the Fourth Assessment Report of the Intergovernmental Panel on Climate Change, edited by: Solomon, S., Qin, D., Manning, M., Chen, Z., Marquis, M., Averyt, K., Tignor, M., and Miller, H., Cambridge University Press, Cambridge, United Kingdom and NewYork, NY, USA, 2007.
Steinhilber, F., Beer, J., and Fröhlich, C.: Total solar irradi-ance during the Holocene, Geophys. Res. Lett., 36, L19704, doi:10.1029/2009GL040142, 2009.
Sun, J. and Liu, Y.: Tree ring based precipitation reconstruction in the south slope of the middle Qilian Mountains, northeastern Ti-betan Plateau, over the last millennium, J. Geophys. Res., 117, D08108, doi:10.1029/2011JD017290, 2012.
Sung, M., Kwon, W., Baek, H., Boo, K., Lim, G., and Kug, J.: A possible impact of the North Atlantic Oscillation on the East Asian summer monsoon precipitation. Geophys. Res. Lett., 33, 4, L21713, doi:10.1029/2006gl027253, 2006.
Tan, L., Cai, Y., Yi, L., An, Z., and Ai, L.: Precipitation variations of Longxi, northeast margin of Tibetan Plateau since AD 960 and their relationship with solar activity, Clim. Past, 4, 19–28, doi:10.5194/cp-4-19-2008, 2008.
Vieira, L. E. A., Solanki, S. K., Krivova, N. A., and Usoskin, I.: Evolution of the solar irradiance during the Holocene, Astr. As-trophys., 531, A6, doi:10.1051/0004-6361/201015843, 2011. Wang, B., Wu, R., and Lau, K.: Interannual variability of the Asian
summer monsoon: contrasts between the Indian and the Western North Pacific-East Asian Monsoon, J. Climate, 14, 4073–4090, 2001.
Wang, S. and Zhao, Z.: An analysis of historical data of droughts and floods in the last 500 years in China, Acta Geogr. Sin., 34, 329–341, 1979.
Wang, S., Ye, J., and Qian, W.: Predictability of drought in China, in: Drought, a global assessment, edited by: Wilhite, D. A., Rout-ledge, London, 100–112, 2000.
Wang, Y., Cheng, H., Edwards, R., He, Y., Kong, X., An, Z., Wu, J., Kelly, M., Dykoski, C., and Li, X.: The Holocene Asian mon-soon: links to solar changes and North Atlantic climate, Science, 308, 854–857, 2005.
Wei, Y. H., Guo, P. W., and Liu, H. B.: Feasibility on Establish-ing GirdEstablish-ing Dataset of the Drought and Flood by Interpolation, Meteor. Disaster Reduc. Res., 3, 1–6, 2007.
Xu, Q.: The abnormal weather of China for summer 1980 and its re-lationship with the volcanic eruptions of Mount St. Helens, Acta Meteorol. Sin., 44, 426–432, 1986.
Xu, Q.: Abrupt change of the mid-summer climate in central east China by the influence of atmospheric pollution, Atmos. Envi-ron., 35, 5029–5040, 2001.
Yan, Z.: A Primary Analysis of the Process of the 1960s Northern Hemispheric Summer Climatic Jump, Chinese J. Atmos. Sci., 16, 111–119, 1992.
Yan, Z., Ye, D., and Wang, C.: Climatic jumps in the flood/drought historical chronology of Central China, Clim. Dynam., 6, 153– 160, 1992.
Yang, J., Gong, D., Wang, W., Hu, M., and Mao, R.: Affiliation, Extreme drought event of 2009/2010 over southwestern China, Meteorol. Atmos. Phys., 115, 173–184, 2012.
Yu, G., Sauchyn, D., and Li, Y.: Drought changes and the mecha-nism analysis for the North American Prairie, J. Arid Land, 5, 1–14, 2013.
Zhang, D.: The method for reconstruction of the dryness/wetness series in China for the last 500 years and its reliability, in: The reconstruction of climate in China for historical times, edited by: Zhang, J., Science Press, Beijing, 18–31, 1988.
Zhang, D.: Severe drought events as revealed in the Climate records of China and their temperature Situations over the Last 1000 Years, Acta Meteorol. Sin., 19, 485–491, 2005.
Zhang, D. and Liang, Y.: A long lasting and extensive drought event over China in 1876–1878, Adv. Atmos. Sci., 1, 91–99, 2010. Zhang, D. and Xue, Z.: Relationship between El Niño and
precipi-tation patterns in China since 1500 AD, J. Appl. Meteorol. Sci., 5, 168–175, 1994.
Zhang, D., Li, X., and Liang, Y.: Supplement of yearly charts of dry-ness/wetness in China for the last 500-year period, 1993–2000, J. Appl. Meteorol. Sci., 14, 379–389, 2003.
Zhang, D., Blender, R., and Fraedrich, K.: Volcanoes and ENSO in millennium simulations: global impacts and regional reconstruc-tions in East Asia, Theor. Appl. Climatol., 111, 437–454, 2013. Zhang, J. and Crowley, T. J.: Historical climate records in China
and reconstruction of past climates (1470–1970), J. Climate, 2, 833–849, 1989.
Zhang, P., Cheng, H., Edwards, R., Chen, F., Wang, Y., Yang, X., Liu, J., Tan, M., Wang, X., Liu, J., An, C., Dai, Z., Zhou, J., Zhang, D., Jia, J., Jin, L., and Johnson, K.: A test of climate, sun, and culture relationships from an 1810-year Chinese cave record, Science, 322, 940–942, 2008.
Zheng, J., Wang, W., and Ge, Q.: Precipitation variability and ex-treme events over eastern China during the past 1500 years, Terr. Atmos. Ocean. Sci., 17, 579–592, 2006.
Zhu, W. and Wang, S.: 80a-oscillation of summer rainfall over the east part of China and East Asia monsoon, Adv. Atmos. Sci., 18, 1043–1051, 2001.