www.atmos-meas-tech.net/5/429/2012/ doi:10.5194/amt-5-429-2012
© Author(s) 2012. CC Attribution 3.0 License.
Measurement
Techniques
Evaluation of Arctic broadband surface radiation measurements
N. Matsui1,2, C. N. Long4, J. Augustine2, D. Halliwell3, T. Uttal2, D. Longenecker1,2, O. Niebergall3, J. Wendell2, and R. Albee2,5
1Cooperative Institute for Research in Environmental Sciences, Boulder, Colorado, USA 2National Oceanic and Atmospheric Administration, Boulder, Colorado, USA
3Environment Canada, Regina, Saskatchewan, Canada 4Pacific Northwest Laboratory, Richland, Washington, USA 5Scientific Technology Corporation, Boulder, Colorado, USA Correspondence to: N. Matsui (nobuki.matsui@colorado.edu)
Received: 17 June 2011 – Published in Atmos. Meas. Tech. Discuss.: 2 August 2011 Revised: 30 January 2012 – Accepted: 14 February 2012 – Published: 24 February 2012
Abstract. The Arctic is a challenging environment for mak-ing in-situ surface radiation measurements. A standard suite of radiation sensors is typically designed to measure in-coming and outgoing shortwave (SW) and thermal infrared, or longwave (LW), radiation. Enhancements may include various sensors for measuring irradiance in narrower band-widths. Many solar radiation/thermal infrared flux sensors utilize protective glass domes and some are mounted on com-plex mechanical platforms (solar trackers) that keep sen-sors and shading devices trained on the sun along its di-urnal path. High quality measurements require striking a balance between locating stations in a pristine undisturbed setting free of artificial blockage (such as from buildings and towers) and providing accessibility to allow operators to clean and maintain the instruments. Three significant sources of erroneous data in the Arctic include solar tracker mal-functions, rime/frost/snow deposition on the protective glass domes of the radiometers and operational problems due to limited operator access in extreme weather conditions. In this study, comparisons are made between the global and component sum (direct [vertical component] + diffuse) SW measurements. The difference between these two quanti-ties (that theoretically should be zero) is used to illustrate the magnitude and seasonality of arctic radiation flux mea-surement problems. The problem of rime/frost/snow deposi-tion is investigated in more detail for one case study utilizing both SW and LW measurements. Solutions to these opera-tional problems that utilize measurement redundancy, more sophisticated heating and ventilation strategies and a more systematic program of operational support and subsequent data quality protocols are proposed.
1 Introduction
The radiative balance of the earth-atmosphere system is cru-cial for understanding atmospheric processes (Dines, 1917; Hunt et al., 1986; Kiehl and Trenberth, 1997; Le Treut et al., 2007; Trenberth et al., 2009) because it plays a piv-otal role in determining atmospheric circulations (Ohmura et al., 1998). The surface radiation budget is especially per-tinent to weather and climate, as the earth surface trans-forms about 60 % of solar radiation absorbed by the planet to heat (Ohmura et al, 1998). The Arctic has already shown its enhanced sensitivity to anthropogenic gas induced cli-mate changes (IPCC AR4, 2007), but because the actual mechanisms that produce climate change are surface pro-cesses, which are greatly affected by poorly understood Arc-tic clouds (see Solomon et al., 2008 for their concise and extensive historical account on Arctic cloud research), more extensive research on the arctic surface radiation budget (e.g., Dutton et al.,2006; Dong et al., 2010) and an extensive net-work of surface radiation measurements are needed. For ex-ample, Kay et al. (2008) showed that enhanced surface radi-ation due to the decreased cloud cover by 16 % from 2006 to 2007 alone could enhance surface melt by 0.3 m over the Western Arctic ocean. Sea-ice extent, permafrost active layer temperatures, seasonal snow cover and depth, glacier ad-vance/retreat rates and vegetation also influence arctic sur-face processes. Given that, (1) Arctic clouds and their ef-fects on radiative transfer and the surface radiation budget are poorly represented in models (Curry, 2000; Solomon et al., 2008), and (2) that satellite remote sensing algorithms cannot accurately retrieve arctic surface and cloud characteristics
430 N. Matsui et al.: Evaluation of Arctic broadband surface radiation measurements
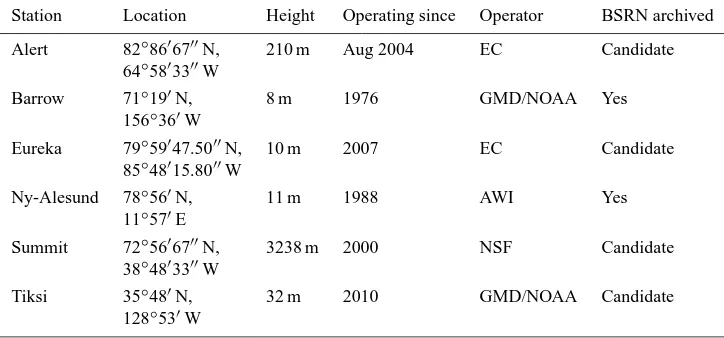
Table 1. Arctic stations with radiation instruments.
Station Location Height Operating since Operator BSRN archived
Alert 82◦8606700N, 210 m Aug 2004 EC Candidate 64◦5803300W
Barrow 71◦190N, 8 m 1976 GMD/NOAA Yes
156◦360W
Eureka 79◦59047.5000N, 10 m 2007 EC Candidate 85◦48015.8000W
Ny-Alesund 78◦560N, 11 m 1988 AWI Yes
11◦570E
Summit 72◦5606700N, 3238 m 2000 NSF Candidate 38◦4803300W
Tiksi 35◦480N, 32 m 2010 GMD/NOAA Candidate 128◦530W
(Randall et al., 1997), high-quality arctic surface radiation measurements are essential to the eventual understanding of these problems. In recognition of the importance of these measurements, a number of arctic observatories have in-stalled suites of broadband irradiance (radiation flux) sen-sors (hereafter radiation sensen-sors) for measuring the compo-nents of incoming and outgoing shortwave (SW) and long-wave (LW) radiation.
Radiation measurements at high latitudes have many diffi-culties associated with extreme weather conditions such as rime deposition and snow accumulation on the protective domes of the instruments, solar tracker failures, and calibra-tion temperature compensacalibra-tion (Lanconelli et al., 2011). In this paper, we report on unique challenges we have experi-enced in making surface radiation measurements at Barrow, Alaska and in Canada at Alert and Eureka. The suites of ra-diation sensors deployed at these stations are generally com-pliant with the standards of the Baseline Surface Radiation Network (BSRN) (McArthur, 2004). The BSRN is a cooper-ative worldwide network that provides continuous, research-quality surface radiation flux measurements. One of its key missions is to validate GCMs (e.g. Wild et al., 2001) and satellite retrievals of surface radiative processes (e.g. Zhou et al., 2007).
No scientific measurements, especially in the harsh arc-tic environment, are complete without the application of data quality control (QC) procedures to flag erroneous data. The BSRN recognizes the need for establishing data QC procedures using existing methods (informal re-port, ELEVENTH Baseline Surface Radiation Network, BSRN, Scientific Review and Workshop, Queenstown, New Zealand, 13–16 April 2010). Currently not all the BSRN-recommended quality control procedures are made centrally at the World Radiation Monitoring Center (Lanconelli et al., 2011). However, according to the BSRN, it is primarily the responsibility of the site scientist to supply the best data
possible to the archive. In response to that requirement we are in the process of implementing quality control procedures embodied by “QCRad,” which were developed by Long and Shi (2006), on the radiation measurements at Eureka (Matsui et al., 2010). The QCRad program is based on BSRN recom-mendations for data QC, but with significant improvements (Long and Shi, 2008). It consists of 19 tests that utilize aux-iliary data such as case and dome temperatures of the pyrge-ometers, station pressure, temperature, and relative humidity to gauge radiation measurements against both physical and climatological limits.
2 State of radiation data in the Arctic
Current arctic surface irradiance measurements are lacking and insufficient. Barrow and Ny-Alesund are the only sta-tions with decadal radiation records, starting 1976 and 1988 respectively (Table 1). Given the accumulation of decadal radiation records at a few sites and the addition of new arctic stations, we have finally begun to see climatological research on the arctic surface radiation budget (Dutton et al., 2006; Dong et al., 2010). This small step forward has prompted Sutter (2006) to call for homogenization (bias corrections over time) of arctic data and consistent calibration of radia-tion sensors for the four polar staradia-tions: Barrow, Ny-Alesund, Neumayer, and South Pole.
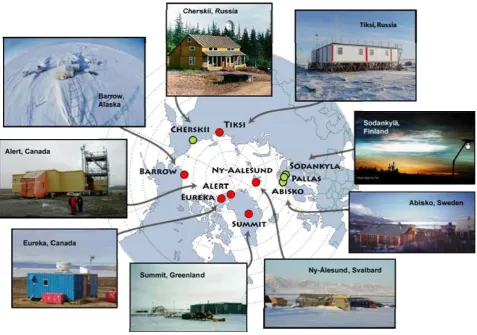
Currently, only six arctic stations have downward and up-ward radiation measurements. They are Alert (Nunavut, Canada), Barrow (Alaska), Eureka (Nunavut, Canada), Ny-Alesund (Norway), Summit (Greenland), and Tiksi (Russia) (Table 1). Ancillary instruments on the nearby towers sup-plement upward radiation measurements at Eureka and Tiksi. A list of operators for those stations is shown in Table 1. Of these, only Barrow and Ny-Alesund data have been archived by the BSRN. Figure 1 shows the polar projection map with
1
2
Figure 1.
Polar projection map with IASOA (International Arctic Systems for Observing the
3
Atmosphere) stations (Darby et al., 2009). Red circles mark those stations with radiation
4
instruments.
5
6
7
8
9
10
11
12
13
14
15
16
Fig. 1. Polar projection map with IASOA (International Arctic Systems for Observing the Atmosphere) stations (Darby et al., 2009). Red circles mark those stations with radiation instruments.
IASOA (International Arctic Systems for Observing the At-mosphere) stations (Darby et al., 2009), which is a network of value added arctic observatories. Red circles indicate sta-tions that have radiation sensors. Despite the recent addition of Tiksi, there remains a large geosampling gap in Russia. However, there have been various short-term ancillary radi-ation measurements in Russia such as those of the GEWEX Asian Monsoon Experiments (Yasunari, 2001). There also exists a network of Russian radiation sensors and the calibra-tion of those instruments against BSRN standard compliant instruments is underway in Tiksi (Uttal et al., 2010).
Likewise, less technically challenging but more estab-lished atmospheric state measurements in the Arctic also do not extend as far back as those at lower latitudes. Among the eight IASOA stations, Tiksi has the longest temperature and surface pressure record, dating back to 1933. In contrast, the global dataset of atmospheric state variables begins well before 20th century. For example, the Global Historical Cli-matology Network version 2 temperature database begins in 1850 (Peterson and Vose, 1997), and the International Sur-face Pressure Databank version 2.2 starts in 1768 (Yin et al., 2008).
3 Radiation measurements and the surface energy budget
The BSRN recommends that the primary measurement of to-tal solar downwelling irradiance should be the sum of the diffuse and direct horizontal components. Therefore, com-pliant measurements require a solar tracker (Fig. 2). Tracker-mounted instruments include a shaded pyranometer to mea-sure diffuse SW irradiance on a horizontal surface, and a pyrheliometer to measure direct SW irradiance normal to the sun’s beam. The BSRN also recommends a shaded pyrge-ometer to measure downwelling LW thermal infrared irradi-ance on a horizontal surface (Ohmura et al., 1998; McArthur, 2004). Shading the up-pointing pyrgeometer helps mitigate solar contamination of the downwelling atmospheric thermal LW measurement and errors associated with uneven dome heating. Shade disks mounted on the tracker enable the shaded measurements by blocking the direct sun. Upwelling global SW and LW irradiance measurements can be made from a short tower preferably poleward of the tracker and other measurement platforms to avoid shading of those ra-diometers, and in close proximity to the tracker location. For
432 N. Matsui et al.: Evaluation of Arctic broadband surface radiation measurements
Fig. 2. Solar tracker mounted surface radiation sensors in Tiksi, Russia. Shortwave measurements are made by GSW (global short-wave), DIR (direct), and DIF (diffuse) sensors.
redundancy, an unshaded pyranometer that measures global SW may be placed on the shade platform of the solar tracker (but not shaded) or on a separate stand nearby. Many vari-ants of BSRN radiation sensor suite implementations exist. For example, in Tiksi, Russia, two different types of shaded diffuse SW sensors are used, and the global SW sensor is situated nearby (Fig. 2).
Michalsky et al. (1999) have shown that in low sun and cold conditions the component sum methodology could lower the uncertainty by a factor of 2 or 3, with respect to a single pyranometer global SW measurement. Upper panels of Fig. 3 show global horizontal irradiance plotted over the component sum for Alert, Barrow, Eureka and BAO (Boul-der Atmospheric Observatory in Colorado) for 2008. For the purpose of illustration, the data shown are not quality con-trolled, and a 45-min running average is applied. Lower pan-els of Fig. 3 show the difference between the component sum and the measured global horizontal irradiance. Theoretically that difference should be zero. However due to harsh weather conditions and errors inherent to the global solar measure-ment by a single pyranometer, such as the cosine error of its sensor and thermal offset errors (Robinson, 1966; Gulbrand-sen, 1978; Dutton et al., 2001; Philipona, 2002) which are particularly relevant to arctic locations under clear skies, per-fect agreement is rarely achieved. These comparisons show that significant errors tend to occur preferentially in the early spring, especially in the arctic. Similar results were found for 2009 and 2010 but not shown. Of the arctic stations, Eureka shows the least disagreement. The purpose of showing the Colorado station in Fig. 3 is to illustrate the climatological differences between high- and mid-latitude stations, and also to show that arctic stations tend to have more measurement problems than those in less harsh environments.
Upwelling radiation and surface energy flux measure-ments are not required by the BSRN. The disadvantage of not having a full suite of radiation budget and surface energy flux measurements is illustrated by the following theoretical consideration.
Net surface irradiance is characterized by Eq. (1) where LWnet is the difference between its downwelling and
up-welling LW components, and SWnet is the difference
be-tween downwelling and upwelling SW components.
Rnet=LWnet+SWnet=(LW↓ −LW↑)+(SW↓ −SW↑). (1)
BSRN compliant stations may only satisfy Eq. (1) if they have ancillary upwelling radiation measurements. Addi-tional measurements of latent (QE), sensible (QH), and
ground conductive fluxes (QG) are necessary to fully
char-acterize the surface energy budget. Energy conservation dic-tates that the difference between the surface net radiation and surface energy fluxes is the energy that would be available for residual melting (QM), but that difference would also include
all measurement errors (ε).
Rnet + (QH +QE +QG) = QM +ε. (2)
Without coincident surface net radiation and energy flux measurements, it is impossible to definitively determine how the net radiation at the surface is utilized, which is what mod-els have to simulate correctly.
4 The flux tower in Eureka
Eureka is located on the Fosheim Peninsula of Ellesmere Island, Nunavut. There, NOAA monitoring instruments are collocated with a Canadian station called the Surface and Atmospheric Flux, Irradiance and Radiation Extension (SAFIRE) located at 79◦59047.5000N, 85◦48015.8000W. The SAFIRE building rooftop is instrumented with Environment Canada tracker-mounted radiometers that measure down-welling SW and LW irradiance (Fig. 4, left panel). The NOAA 10.5 m flux tower (Fig. 4, right panel), erected in 2007, is located about 500 m east of the SAFIRE building at 79◦59043.400N, 85◦46022.900W. The top of that tower is in-strumented with both up- and down-pointing global horizon-tal pyranometers (Kipp and Zonen CM22) and pyrgeometers (Eppley PIR). Thus Eureka has two sets of global SW and LW sensors that measure downwelling irradiance, and one set that measures upwelling irradiance. Maintenance of the tower-mounted radiometers in the arctic winter is extremely difficult and dangerous. Manual inspections of downwelling SW measurements show frequent erroneous data primarily due to riming. Unfortunately, the placement of downwelling sensors on the top of the tower was a logistical mistake and likely resulted in more bad data than if they were placed near the surface where they could have been more easily serviced. Figure 5 shows downwelling SW measurements from the Environment Canada solar tracker at Eureka and the
20
1
2
Figure 3.
GSW and DIF+DIR: Comparison of a) Alert, b) Barrow, c) Eureka and d) BAO
3
(Boulder Atmospheric Laboratory) in 2008. The top panels show GSW and the component
4
sum. The bottom panels show the difference between the component sum and GSW.
5
6
7
8
9
10
11
12
13
14
Fig. 3. GSW and DIF + DIR: Comparison of (a) Alert, (b) Barrow, (c) Eureka and (d) BAO (Boulder Atmospheric Laboratory) in 2008. The top panels show GSW and the component sum. The bottom panels show the difference between the component sum and GSW.
flux tower downwelling SW and LW measurements for 26 March 2010. The solar beam, depicted by the direct-normal measurement corrected to a horizontal surface, ap-pears to be blocked before 13:00 UTC, but after that time it dominates the diffuse SW, and appears to follow a co-sine response. This suggests strongly that we are looking at clear skies after 13:00 UTC on that day. The Environment Canada global measurement is greater than the component sum by about 40 Wm2prior to about 20:30 UTC, when, ac-cording to station records, their diffuse and global instrument domes were cleared of a light frost. This is not uncommon (especially for the global measurement) at low solar eleva-tions. After the cleaning, the magnitudes of both the dif-fuse and global measurements decrease, and consequently the component sum and global measurements better agree to within about 15 Wm−2. A frosted dome often acts as a reflector/diffuser that reduces the cosine losses and enhances the irradiance on the horizontal sensor. This effect is usually not as noticeable on a diffuse sensor that is shaded from the direct sun, but perhaps in this case the diffuse radiation field was non-isotropic. Because the Environment Canada diffuse and global SW measurements adjust downward after they are
cleared of snow and the direct SW remains unchanged indi-cates that the direct irradiance was the only good measure-ment prior to 13:00 UTC.
The magnitude of the NOAA tower global measurement is much greater than all other solar measurements throughout the day, indicating that it was greatly compromised by frost on its dome that could not be cleaned off because of its loca-tion at the top of the tower. Further, the extraterrestrial SW irradiance at Eureka peaks at about 300 Wm−2on 26 March.
Because the downwelling SW measurement from the tower on that day peaked at 350 Wm−2, and it is known that the day was cloud free after 13:00 UTC, it is safe to conclude that riming compromised the measurement of downwelling global SW irradiance on the tower.
Prior to 13:00 UTC, the downwelling solar measurements, including the direct beam, are quite a bit less than the clear-sky values afterwards. The downwelling IR time series shows enhanced values prior to 13:00 UTC that favor the ex-istence of overhead cloud cover during that period, suggest-ing clouds as the likely cause of the early mornsuggest-ing reduction of downwelling SW.
434 N. Matsui et al.: Evaluation of Arctic broadband surface radiation measurements
Fig. 4. SAFIRE rooftop is instrumented with tracker-mounted radiometers (left panel). At 10.5 m height, the flux tower is equipped with four radiometers (right panel).
Eureka GSW,Dir,Dif 20100326
6 12 18 0 6
hour (UTC) 0
100 200 300 400
W m^-2
GSW Tower GSW DIF DIR SUM
Eureka Tower LWD,LWU 20100326
6 12 18 0 6
hour (UTC) 100
150 200 250 300
W m^-2
Tower LW DOWN Tower LW UP
Fig. 5. Comparison between flux tower measurements of LWup, LWdown and global SW with SW DIF, DIR and their sum from SAFIRE measurements at Eureka on a mostly clear day, 26 March 2010.
5 Discussion
There are several strategies and practices regarding Arc-tic instrumentation that could lead to improved measure-ments. For example, there have been various creative solu-tions (many unpublished) invented by the well-experienced field workers in polar region such as extensive ventilator modifications during the SHEBA campaign (Horst, 2003).
Our suggestions here are not meant to be complete. It would be to our delight if these suggestions would invigorate fur-ther discussions among field operators and researchers that would lead to optimal local instrumentation strategies and better quality data.
5.1 Common sense strategy
Measurement improvement can be achieved by common sense strategies such as daily or sub-daily cleaning of the in-struments. Ideally the instruments should be checked on an hourly basis, as practiced at many meteorological stations, but where that regimen is impractical, they should be exam-ined daily, or on a subdaily basis if conditions favor riming. Remote stations should be checked at least weekly. If rim-ing issues are persistent, it should be noted in the log entries. This is exactly the procedure Environment Canada SAFIRE station operators followed on 26 March 2010.
5.2 Station design
Well-designed instrument placement is the key to success for accurate arctic irradiance measurements. Figures 3 and 5 show the benefit of well-attended measurements. The fact that the solar tracker is located on the rooftop of the SAFIRE building where operators reside and have easy access is an asset that should be considered in the design of Arctic ra-diation measurement stations. Radiometers that measure downwelling irradiance should never be placed where they are not easily accessible. If at all possible, ancillary down-pointing radiometers on the flux towers such as one in Eureka may supplement the tracker-mounted downwelling measure-ments to close the surface radiation budget, if (1) they are in
Fig. 6. Example solar tracker and its circuit box wrapped in the arctic-rated blanket.
reasonable proximity, and (2) the surface characteristics be-neath the tower are representative of the surrounding area. The same argument applies to surface heat flux measure-ments that, in combination with the surface radiation bud-get, would close the surface energy budget measurements at a station.
5.3 Instrument improvements
Erroneous data due to the tracker operation issues, power failures, and riming on the instrument domes are primary concerns for arctic radiation measurements. During the long polar winter, when the sun is below the horizon all day, site operators program the modern robotic solar trackers to a lower latitude where the solar beam is still trackable to keep the tracker moving and thus maintain the fluidity of the grease and moving parts (J. Wendell and R. Albee, personal communication, 2010). The active sun tracking option is turned off during this period. The tracker is re-programmed to the correct coordinates a few weeks before the polar sun-rise. Whether this procedure is necessary is a matter of de-bate. Solar trackers in arctic are usually equipped with an Arctic rated blanket to help retain the internally generated heat (Fig. 6). At NOAA/Global Monitoring Division an ex-periment was conducted in the cold chamber to test the ef-fectiveness of the blanket and a simulated power failure. A solar tracker was brought to the state of cold soak by be-ing powered off while the chamber temperature was dropped to−70◦C. After the power was restored, the tracker circuit box temperature was brought back to operational tempera-ture by the internal heater and the motors and mechanical gears were deemed operational (J. Wendell and R. Albee, personal communication, 2010). However, we are not cer-tain that the chamber environment sufficiently simulated ac-tual conditions of the early arctic spring. Tracker operation immediately before and during the polar sunrise requires fur-ther scrutiny.
Fig. 7. SPN-1 radiometer (upper left), ventilated Eppley PSP ra-diometer (lower left) and ventilated Eppley PIR pyrgeometer (upper right). A thin layer of frost on the PSP’s dome is clearly visible.
Having collocated redundant sensors could remedy some of the issues we have encountered in the Arctic. An example of such an arrangement is shown in Fig. 7. The top left corner of Fig. 7 shows the Delta-T Devices model SPN-1 radiome-ter (Myers, 2010) afradiome-ter a riming event at the Storm Peak Lab near Steamboat Springs, Colorado. With no moving parts, the SPN-1 radiometer utilizes seven small thermopile sensors with various degrees of shading to provide total and diffuse broadband SW measurements regardless of azimuthal orien-tation, from which direct SW is inferred. It has a built-in heating system that works down to−20◦C (in still air con-ditions) from Delta-T product sheet to keep dew, frost, rime, and snow off of the dome. The effectiveness of the inter-nal heating system is obvious in the picture. The SPN-1 is not as accurate as a class-1 pyranometer, or component sum measurements, however, the benefit of such redundant measurements is obvious when the tracker or the tracker-mounted sensors are not functioning optimally (e.g., due to frost or tracker misalignment). For example, pyrheliometers typically are not equipped with ventilators and thus are more susceptible to riming. During the ARM StormVEx campaign (Mace et al., 2010) at Storm Peak Lab, the measurement sys-tem included an SPN-1 and an Eppley PSP (Fig. 7). Figure 8 shows the comparison of those two radiometers’ measure-ments for 25 November 2010. That day was mostly clear, as confirmed by a Total Sky Imager (TSI) movie. The max-imum solar elevation was just above 28◦. The magnitude of the erroneously enhanced positive downwelling SW irradi-ance that was experienced at the Eureka flux tower due to riming was replicated in the Eppley PSP morning data on this date. Since the sky was mostly clear, the afternoon total SW irradiance should nearly match the curve in the morning, only showing small differences due to diurnal changes in wa-ter vapor and aerosol loading. However, the Eppley PSP data plotted versus the cosine of the solar zenith angle shows a looping pattern. The PSP values are too high in the morning, but later in the day after the frost on the Eppley PSP had dis-sipated, the two radiometers show better agreement. Clearly,
436 N. Matsui et al.: Evaluation of Arctic broadband surface radiation measurements
25 1
2 Fig. 8. Top panel: Comparison of SW by Eppley PSP and
SNP-1 measurements of global SW at Storm Peak Laboratory on 25 November 2010. Blue curve shows enhanced PSP-measured global SW during the first half of the day due to the frost on the dome as compared to the brown curve representing the SPN-1 total SW. Other data shown are downwelling LW (red), direct SW on a horizontal surface (yellow), PSP-measured diffuse SW (cyan) and SPN1-measured diffuse SW (black). Bottom panel: Eppley PSP global SW (dark blue line) and SNP-1 global SW (red line) versus the cosine of the solar zenith angle. Light blue curve is the SPN-1 measured diffuse SW.
even though it is less accurate under normal conditions, the frost and rime-free SPN-1 produced the more accurate data on that day than the class-1 instrument. The next task is to develop algorithms and procedures for choosing the “best” measurements at any given time to produce a useful “best estimate” for users.
The versatility afforded by new instruments such as the SPN-1, with its internal heating and ability to produce rea-sonable total and diffuse SW measurements, opens up a new possible deployment scenario for conditions where fielding a solar tracker is problematic or not feasible and/or riming poses a substantial problem. In those cases, the optimal sys-tem might consist of a standard SPN-1 for SW component measurements, a no-shading-pattern SPN-1 for the global SW horizontal measurements, and a heated ventilated PIR
Fig. 9. An Eppley pyrgeometer (PIR) in an arctic-rated ventilator.
(or CG-4) for the LW measurements. It must be noted that the no-shading-pattern SPN-1 is a new concept that has yet to be tested for riming resistance under harsh arctic condi-tions. Since, by design, conduction through the metal shad-ing pattern helps to more evenly distribute the heatshad-ing under the SPN-1 dome, some decrease in the ability to resist frost and riming in the no-shading-pattern SPN-1 may manifest itself. Nevertheless, the heating design obviously has an ad-vantage over no heating for arctic conditions.
Another possible area of improvement for cold-climate ra-diation measurements is proper and adequate heated ven-tilation (McArthur, 2004; Lanconelli et al., 2011). Fig-ure 9 shows an example of an arctic-rated ventilator: the Physikalisch-Meteorologisches Observatorium Davos (PMOD) model VHS with a heated coil under the sun shield and steep sides to enhance its snow shedding ability. Proper arctic-rated ventilation systems (e.g. PMOD or Kipp and Zo-nen) that reduce riming or the build-up of snow are a ne-cessity in the arctic environment for non-heated instruments. This is especially the case for the LW sensors because the downwelling IR signal resulting from partial to complete dome ice obscuration may be indistinguishable from legiti-mate signals from low level clouds (E. Dutton, personal com-munication, 2010). However, the amount of heating and how the heaters are placed in the ventilator can also contribute to increased IR loss errors in the pyranometer measurements, thus care must be taken in applying this type of ice mitiga-tion strategy.
6 Conclusions
Making surface radiation measurements in the harsh arctic environment is a challenging endeavor. Here we have tried to address problems facing the BSRN working group “Cold
Climate Issues” by identifying issues and providing
possi-ble solutions. However more work needs to be done. The ultimate goal is to prevent tracker aiming errors and contam-ination of the measurements by frost, ice, snow, and rime at all times. This might be achieved by a carefully designed solar tracker operation strategy, having adequate and well-designed radiometer heating and ventilation, and the use of redundant multi-variable radiometers for better data quality control, and the addition of new heated multi-variable ra-diometers with no moving parts that measure solar compo-nents, albeit with lesser accuracy, to cover periods when the solar tracker is inoperable or during periods of severe rim-ing. Perhaps, the incorporation of new instrument types may be required. Establishing viable data quality control, strict dome cleaning schedules, homogenization of the data, and consistent calibration procedures are also necessary for the success of the radiation measurements in the Arctic. Some of these practices will also benefit BSRN stations worldwide, regardless of their location. Last, the addition of upwelling irradiance measurements at stations where they do not exist, and surface latent, sensible, and ground heat flux measure-ments to arctic stations would lead to a better understanding of how residual energy at the surface is utilized. These valu-able additions, in turn, would give modelers of arctic surface processes the information they need to improve their models and ultimately lead to better understanding and forecasts.
Acknowledgements. The authors thank Dutton, E., and Michalsky, J. (NOAA/GMD) and McArthur, L. J. B. for their expertise, support and encouragement. We salute all the hard work by CANDAC and Environment Canada operators in Eureka. This work was supported by the NOAA SEARCH program and the Office of Biological and Environmental Research (OBER) of the US Department of Energy (DOE) as part of the Atmospheric System Research (ASR) Program.
Edited by: S. Slijkhuis
References
Curry, J. A., Hobbs, P. V., King, M. D., Randall, D. A., Minnis, P., Isaac, G. A., Pinto, J. O., Uttal, T., Bucholtz, A., Cripe, D. G., Gerber, H., Fairall, C. W., Garrett, T. J., Hudson, J., Intrieri, J., Jakob, M. C., Jensen, T., Lawson, P., Marcotte, D., Nguyen, L., Pilewskie, P., Rangno, A., Rogers, D. C., Strawbridge, K. B., Valero, F. P. J., Williams, A. G., and Wylie, D.: FIRE Arctic Clouds Experiment, B. Am. Meteorol. Soc., 81, 5–29, 2000. Darby, S. L., Dlugokencky, E., Schnell, R., Uttal, T., Vasel, B.,
Burkhart, J., Drummond, J., Fogal, P., Makshtas, A., Ma-trosova, L., Albee, R., and Zimov, S.: International Arc-tic Systems For Observing The ATtmosphere (IASOA): An
Overview Of International Polar Year Activities, Am. Meteo-rol. Soc., 10th Conference on Polar Meteorology and Oceanog-raphy, Madison, Wisconsin, extended abstract, iasoa.org/iasoa/ images/stories/darby ams iasoa extended abstract.pdf (last ac-cess: 17 February 2012), 19 May 2009.
Dines, W. H.: The heat balance of the atmosphere, Q. J. Roy. Mete-orol. Soc., 43, 151–158, 1917.
Dong, X., Xi, B., Crosby, K., Long, C. N., Stone, R. S., and Shupe, M. D.: A 10 year climatology of Arctic cloud fraction and ra-diative forcing at Barrow, Alaska, J. Geophys. Res., 115, 1–14, 2010.
Dutton, E. G.: Tenth session of the baseline surface radiation net-work (BSRN), WCRP informal report, 2008.
Dutton, E. G., Michalsky, J. J., Stoffel, T., Forgan, B. W., Hickey, J., Nelson, D. W., Alberta, T. L., and Reda, I.: Measurement of broadband diffuse solar irradiance using current commercial instrumentation with a correction for thermal offset errors, J. At-mos. Ocean Tech., 18, 297-314, 2001.
Dutton, E. G., Nelson, D. W., Stone, R. S., Longenecker, D., Car-baugh, G., Harris, J. M., and Wendell, J., Decadal variations in surface solar irradiance as observed in a globally remote network, J. Geophys. Res., 111, D19101, doi:10.1029/2005JD006901, 2006.
Gulbrandsen, A.: On the use of pyranometers in the study of spec-tral solar radiation and atmospheric aerosols, J. Appl. Meteorol., 17, 899–904, 1978.
Horst, T.: SHEBA FLUX-PAM Project Report, www.eol.ucar.edu/ isf/projects/sheba/rad.isff.html (last access: 17 January 2012), 2003.
Hunt, G. E., Kandel, R., and Mecherikunnel, A. T.: A history of pre satellite investigations of the earth’s radiation budget, Rev. Geophys., 24, 351–356, 1986.
IPCC, 2007: Summary for Policymakers, in: Climate Change 2007: The Physical Science Basis, Contribution of Working Group I to the Fourth Assessment Report of the Intergovernmental Panel on Climate Change, edited by: Solomon, S., Qin, D., Manning, M., Chen, Z., Marquis, M., Averyt, K. B., Tignor, M., and Miller, H. L., Cambridge University Press, Cambridge, UK and New York, NY, USA, 2007.
Kay, J. E., L’Ecuyer, T., Gettelman, A., Stephens, G., and O’Dell, C.: The contribution of cloud and radiation anomalies to the 2007 Arctic sea ice extent minimum, Geophys. Res. Lett., 35, L08503, doi:10.1029/2008GL033451, 2008.
Kiehl, J. T. and Trenberth, K. E.: Earth’s Annual Global Mean En-ergy Budget, B. Am. Meteorol. Soc., 78, 197–208, 1997. Lanconelli, C., Busetto, M., Dutton, E. G., Ko¨nig-Langlo, G.,
Ma-turilli, M., Sieger, R., Vitale, V., and Yamanouchi, T.: Polar base-line surface radiation measurements during the International Po-lar Year 2007–2009, Earth Syst. Sci. Data, 3, 1–8, 2011, http://www.earth-syst-sci-data.net/3/1/2011/.
Le Treut, H., Somerville, R., Cubasch, U., Ding, Y., Mauritzen, C., Mokssit, A., Peterson, T., and Prather, M.: Historical Overview of Climate Change, edited by: Solomon, S., Qin, D., Manning, M., Chen, Z., Marquis, M., Averyt, K. B., Tignor, M., and Miller, H. L., Cambridge University Press, Cambridge, UK and New York, NY, USA, 2007.
Long, C. N. and Shi, Y.: The QCRad Value Added Product: Surface Radiation Measurement Quality Con-trol Testing, Including Climatologically Configurable Limits,
438 N. Matsui et al.: Evaluation of Arctic broadband surface radiation measurements
Atmospheric Radiation Measurement Program (ARM) Techni-cal Report, ARM/Pacific Northwest National Laboratory, TR-074,, technical report, www.arm.gov/publications/tech reports/ doe-sc-arm-tr-074.pdf, last access: 20 January 2012, 69 pp., 2006.
Long, C. N. and Shi, Y.: An Automated Quality Assessment and Control Algorithm for Surface Radiation Measurements, Open Atmos. Sci. J., 2, 23–37, doi:10.2174/1874282300802010023, 2008.
Mace, J., Matrosov, S. Y., Shupe, M. D., Lawson, P., Hallar, G., Mc-Cubbin, I., Marchand, R., Orr, B., Coulter, R. L., Sedlacek, A., Avallone, L., Long, C. N., Widener, K. B., Bharadwaj, N., and Roeder, L. R.: STORMVEX: The Storm Peak Lab Cloud Property Validation Experiment Science and Operations Plan, ARM Technical Report, DOE/SC-ARM-10-021, ARM/Pacific Northwest National Laboratory, technical report, www.arm.gov/ publications/programdocs/doe-sc-arm-10-021.pdf (last access: 17 January 2012), 2010.
Matsui, N., Long, C., Niebergall, O., McArthur, B., Halliwell, D., Longenecker, D., Augustine, J., and Uttal, T.: Quaility con-trol of the Eureka flux tower radiation measurements by QCRad (progress report), power point presentation, CANDAC work-shop, Halifax, Nova Scotia, 2 November 2010.
McArthur, L. J. B.: World Climate Research Programme, Base-line Surface Radiation Network (BSRN) Operations Manual Ver-sion 2.1, WMO/TD-No. 879, WCRP/WMO, 2004.
Michalsky, J., Dutton, E., Rubes, M., Nelson, D., Stoffel, T., Wes-ley, Splitt, M., and DeLuisi, J.: Optimal Measurement of Surface Shortwave Irradiance Using Current Instrumentation, J. Atmos. Ocean. Tech., 16, 55–69, 1999.
Myers, D. R.: Comparison of direct normal irradiance derived from silicon and thermopile global hemispherical radiation detectors, Proc. SPIE, 7773, 77730G, doi:10.1117/12.859732, 2010. Ohmura, A., Dutton, E. G., Forgan, B., Frohlich, C., Gilgen, H.,
Hegner, H., Heimo, H., Konig-Langlo, G., McArthur, B., Muller, G., Philipona, R., Pinker, P., Whitlock, C. H., Dehne, K., and Wild, M.: Baseline surface radiation network (BSRN/WCRP): New precision radiometry for climate research, B. Am. Meteorol. Soc., 79, 2115–2136, 1998.
Peterson, C. T. and Vose, R. S.: An Overview of the Global Histor-ical Climatology Network Temperature Database, B. Am. Mete-orol. Soc., 78, 2837–2849, 1997.
Philipona, R.: Underestimation of solar global and diffuse radia-tion measured at Earth’s surface, J. Geophys. Res., 107, 4654, doi:10.1029/2002JD002396, 2002.
Randall, D., Curry, J., Battisti, D., Flato, G., Grumbine, R., Hakki-nen, S., Martinson, D., Preller, R., Walsh, J., and Weatherly, J.: Status of and outlook for large scale modeling of atmospheric-ice-ocean interactions in Arctic, B. Am. Meteorol. Soc., 79, 197– 219, 1997.
Solomon, A., Morrison, H., Persson, P. O. G., Shupe, M. D., and Bao, J.-W.: Investigation of microphysical parameterizations of snow and ice in Arctic clouds during M-PACE through model observation comparisons, Mon. Weather Rev., 137, 3110–3127, doi:10.1175/2009MWR2688.1, 2009.
Sutter M.: Surface Radiation and Climate at High Latitudes. Ho-mogenization and Analyses of Data from Arctic and Antarctic BSRN Site, Ph. D thesis, Swiss Federal Institute of Technology, 2006.
Trenberth, K. E., Fasullo, J. T., and Kiehl, J.: Earth’s global energy budget, B. Am. Meteorol. Soc., 90, 311–323, 2009.
Uttal, T., Makshtas, A., Danilov, A., Schnell, R. C., Reshet-nikov, A., Key, J., Knoplev, A., Romanofsky, V., and Laurila, T.: TiksiHydrometeorological Observatory Program of Re-search First Year Projects and Installations May 30, 2010 Version 1.0., iasoa.org/iasoa/images/stories/travels/tiksi% 20science%20plan%20english.pdf (last access: 17 Jan-uary 2012), 2010.
Wild, M., Ohmura, A., Gilgen, H., Morcrette, J. J., and Slingo, A.: Deficiencies in GCM-simulated downward longwave radiation inferred from surface observations, in: Current Problems in At-mospheric Radiation, edited by: Smith, W. L. and Timofeyev, Yu. M., A. Deepak Publ., Hampton, VA, 1231–1234, 2001. Yasunari, T.: GEWEX Asian Monsoon Experiment (GAME), J.
Meteorol. Soc. Jpn., 79, 241–605, 2001.
Yin, X., Gleason, B., Vose, R., Compo, G., and Matsui, N.: The International Surface Pressure Databank (ISPD) land compo-nent version 2.2, technical report, ftp://ftp.ncdc.noaa.gov/pub/ data/ispd/doc/ISPD22.pdf (last access: 17 January 2012), 2008. Zhou, Y., Kratz, D. P., Wilber, A. C., Gupta, S. K., and Cess, R. D.:
An improved algorithm for retrieving surface downwelling long-wave radiation from satellite measurements, J. Geophys. Res., 112, 1–13, 2007.