2013, Vol. 1, No. 4
Implementation of Multi-Objective Evaluation
Method in Public Debt Risk Management
Jelena Stankevičienė, Sergej Rosov
A B S T R A C T
Objective: The paper is devoted to propose a public debt risk assessment model, which allows predicting country's economic well-being trends. The proposed model evaluates different aspects of public debt-related structural indicators.
Research Design & Methods: Introduced debt risk assessment model uses MULTIMOORA multi-objective evaluation method. Study is based on the 2005-2010 European Union macroeconomic structural indicators.
Findings: The data analysis indicates EU's ability to cope with the increasing level of public debt and predict long term fiscal consequences.
Implications & Recommendations: Evaluation of research results enables to use multi-objective evaluation method to determine the risk of public debt.
Contribution & Value Added: A ranking index which shows early warning signs of fiscal indebtedness problems for European Union countries is introduced in the paper. Periodical use of proposed model would help to predict incoming recessions and to implement specific fiscal policies in time to prevent them.
Article type: research paper
Keywords: public debt; risk; MULTIMOORA; MOORA; structural indicators; European Union
JEL codes: G11, G14, G23
Published by Centre for Strategic and International Entrepreneurship – Krakow, Poland
Suggested citation:
INTRODUCTION
Public debt risk management topic is one of the most relevant for European authorities and society in general, because after the recent economic crisis many countries had big deficit in their economies, so that they took large loans from different financial institutions in order to cover their outstanding liabilities. Unfortunately, for some countries the interest rate was so high, so it was difficult for them to pay debt service for their loans. Under following circumstances their credit rating dropped down even more and investors decided that it is too risky for them to invest their money in government junk bonds.
The authors have focused on developing a greater understanding of the way in which public debt risk can be evaluated and managed.
Public debt risk management issues pose society more questions than answers. Moreover, existing methods give recommendations to the governments too late. The problem indicated in the paper is lack of appropriate model of public debt risk evaluation, which would help to understand which countries are in trouble in managing their sovereign debt liabilities. Risk of the sovereign debt to the European Union countries is the object of the following research. The paper is devoted to create integrated framework, which could produce more precise findings for further action on time.
The aim of this paper is to propose a new model for evaluation of public debt risk, which will be more precise than existing ones and will show trends for country economic wellbeing for a few years in advance.
The main tasks of the study are the following: (1) to identify macroeconomic structural indicators which have positive and negative effect on public debt; (2) by using MULTIMOORA method to evaluate for each EU country its indebtedness index, rank it and analyse received results; (3) to introduce a model of assessing the risk of indebted countries.
Risk of the sovereign debt is especially crucial in Eastern and Central European countries. Eastern and Central Europe countries are one of the 28 member states of the European Union and their situation has direct economic impact. Moreover, European Union during recent years was not stable in economic terms, so it is essential to make sure in future it will have stable growth.
LITERATURE REVIEW
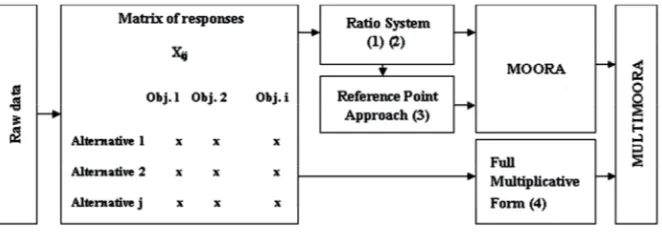
Scientific literature presents many different methods how to measure risk of the indebted countries and there is a debate which one is more accurate (relative to GDP, public revenues or exports). Singular ratios methods of calculating may be misleading in predicting future economic growth. That is why main idea of the following research is to introduce a new ranking measurement system, which is calculated separately from the three different methods. This method is called MULTIMOORA and it consists of three parts, namely Ratio System, Reference Point and Full Multiplicative Form.
social service, education, health, infra-structure improvement and defence etc. There are two types of borrowing: one is consumption based, while another is made for investment purposes. Sometimes authorities borrow money to carry out expansionary fiscal policies (i.e. cutting taxes or increase in spending) in order to improve economic activity of the country, decrease unemployment and stimulate economic growth. Excessive levels of debt resulting in higher interest rates can have opposite effects on real output (Alesina et al., 1992). There is a common believe of many economists that in certain circumstances sovereign debt may cause a productive aspects in the economy. For instance, investments in long-term projects may improve future economic situation of the country. On the other hand, governments usually use borrowed money to cover other needs. In following cases economists suggest authorities to cut existing spending or to increase taxes on economic booms to repay its liabilities incurred from recent economic slowdowns. Wood (2012) in his research found that in periphery countries the risk of debt default is being increased by current defensive policy settings and the policy of financing budget deficits by printing new money is likely to be more effective (than “quantitative easing” and current Eurozone policy) in raising demand, output and employment without adding unnecessarily to already high levels of public debt.
Scientists also argue that such governments, which borrow for consumption needs, may have in the future difficulties when they should repay their debts, because such liabilities do not bring any economic benefits. Indebted sovereigns in crises across the Eurozone have made debt restructuring an imperative. Thomas (2013) proposed that the debt sustainability with negotiated and consensual workouts can be achieved in the Eurozone with statutory constraints on enforcement action pending the settlement of debt workouts.
Right now most of the governments borrow money by issuing and selling government bonds to investors. Some countries sell their bonds on the local market, while others to investors from overseas. For example, Japan and Italy sell large amount of their bonds to domestic investors. Another example is the USA; it sells half of their debt on a federal level and other to international investors. During last financial crisis years some emerging economies borrowed money from large international organizations, such as IMF and World Bank with fair interest rates (Nelson, 2011). Usually government’s debt burden is calculated as a percentage of gross domestic product (GDP) of a specific country, which is quantitative measurement of country’s economy. It is most commonly used measure of indebtedness of the country, because it indicates relative debt burden of the government, since large economies may sustain more debt in total, compares with small economies.
Garcia & Rigobon (2004) studied the question of debt sustainability from a risk management perspective. They found that even though the debt could be sustainable in the absence of risk, there are paths in which it is clearly unsustainable. Furthermore, they showed that properties of the debt dynamics are closely related to the spreads on sovereign dollar denominated debt.
It is also very important to distinguish who hold a debt of the country: local or foreign investors. Some governments sell majority of their bond to the foreigners, while other to the residents. For example, Japan and Italy sells most of the bonds to the local investors, that is why it is not so risky for them to carry out such large proportion of public debt to GDP ratio. The part of debt which foreigners hold is called external public debt and it is usually riskier with comparison to internal public debt holders.
There are several possible ways in which public debt can negatively impact on long term growth of the country: higher interest rates increase future taxation, higher inflation and increased uncertainty about future prospects and policies. In addition, in the worst scenario of debt mismanagement, it might cause currency or banking crisis in the economy (Hemming et al., 2003). High level of sovereign debt also has adverse effect on fiscal policies, which can cause higher volatility of structural macroeconomic indicators and lower economic growth (Kumar & Woo, 2010).
Most of the theoretical researchers find a negative connection between government debt and economic growth (Rutkauskas, 2013). DiPeitro & Anoruo (2012) examined the impact of the size of government and public debt on real economic growth, for a panel of 175 countries around the world and indicated that both the size of government and the extent of government indebtedness have negative effects on economic growth and suggested that the authorities ought to take the necessary steps to curtail excessive government spending and public debts, in order to promote economic growth.
Economists argue that public debt is a burden for future generations. It comes from the lower income flows out of reduced stock of private capital. Moreover, interest rate increases in a non-linear form, what causes even higher difficulties for the government. Increase of public debt most probably will cause problems for next generations, but right now it may be advantageous for today’s generation. It is one of the most egoistic forms for financing government deficit in a long term. However, economists also argue that sometimes, when debt goes to the projects which will generate additional revenue, it may improve an economic growth in a long-run (Modigliani, 1961).
Taxes are usually used as a form to finance the debt service on interest rate by both internal and external debt. It has negative spill-over effect on lifetime consumption of citizens and amount of their savings. Furthermore, internal debt may decrease a capital stock from the substitution of public debt for physical capital (Diamond, 1965).
diminished and must be approaching the reference value at a satisfactory pace" (Commission…, 1992).
It is important to understand for what reason governments borrow money. USA and some other countries, for example, have a lot of war debts, which according to scientists are less problematic for economic growth and inflation in comparison to the debts made in the peace time. After war all manpower and resources are allocated to the civilian economy. Usually, spending a lot of money on war causes high amount of public debt which in a peace time, in a short period of time, reaches the same level as before. On the other hand, debt occurred in a peace time usually has a long term dynamics (Reinhart & Rogoff, 2010).
MATERIAL AND METHODS
Based on the literature review, the following integrated model for evaluation of public debt risk was constructed by the authors. The essence of the principle approach to quantifiable estimation of the integrated model for public debt risk management lies in formalisation of the methodology proposed by Brauers (2004, 2008), Brauers et al. (2010, 2011), Nelson et al. (2011), Reinhart and Rogoff (2010); as well as Lithuanian professors Kracka and Zavadskas (2011), Ginevičius and Podviezko (2013), Kildiene (2013), Balezentis and Balezentis (2011) and others.
Recently, new multi-objective method for optimization of various alternatives was introduced named as MOORA (Multi-Objective Optimization on the basis of Ratio Analysis). Following method guides to use matrix of responses of alternatives to specific objectives (Brauers & Zavadskas, 2006). In this research as alternatives will be used member states of the European Union (UE-27 countries) and as objects – different macroeconomic parameters. Later, by using Ratio System and Reference Point methods, ranks for each alternative for particular objective should be calculated. These methodologies will be briefly discussed below. Figure 1 shows in easy and understandable way a study model used in research and analysis.
Figure 1. Diagram of MULTUMOORA
Source: (Brauers & Zavadskas, 2012, p. 8).
efforts. Information must be collected for 9 objectives and for 27 alternatives in a period of 6 years (2005-2010).
The ratio system (RS) of MOORA method is based on matrix of responses which corresponds specific alternatives for specific objectives (xij), with:
xij – is the response of alternative j to objective i, i = 1, 2, . . . , n are the objectives,
j = 1, 2, . . . , m are the alternatives.
According to Van Delft and Nijkamp (1977), MOORA refers to a ratio system in which each response of an alternative on an objective is compared to a denominator, which is representative for all alternatives concerning that objective. For this denominator the square root of the sum of squares of each alternative per objective is chosen (Brauers & Zavadskas, 2006).
∑
=
= m j ij ij ijx
x
X
1 2 (1) where:xij – response of alternative j on objective i, j = 1, 2, . . . , m;m the number of alternatives,
i = 1, 2, . . . , n;n the number of objectives,
xij – a dimensionless number which represent the normalized response of
alternative j on objective i.
According to the characteristics of robustness, this formula in such context is the most robust one (Brauers & Zavadskas, 2006).
Responses of the alternatives on the objectives after normalization should belong to the interval from zero to one. Nevertheless, it also could be from minus one to one. It happens, when objectives have a negative dimensionless number (for example, inflation rate of the county). For optimization process these responses must be added in maximization context and subtracted in minimization context:
∑
−
∑
=
+ = = n g i ij g i ijj
X
X
Y
1 1
(2)
where:
i = 1, 2, . . . , g as the objectives to be maximized,
j = g+1, g+2, . . . , n as the objectives to be minimized,
Yj – the normalized rate of alternative j to all objectives (Brauers & Ginevicius,
2010).
case of maximization and lowest in case of minimization, accordingly. Then, for measuring the distance between alternatives and the reference point, the Tchebycheff Min-Max technique will be used (Karlin & Studden, 1966).
−
ij i i jX
r
) ( ) (
max
min
(3)where:
i = 1, 2, . . . , n are the objectives,
j = 1, 2, . . . , m are the alternatives,
ri – the i-th coordinate of the maximal objective reference point of
corresponding alternatives,
Xij – normalized objective iof alternative j(Brauers & Zavadskas, 2006).
MULTIMOORA method consists of MOORA and of the Full Multiplicative Form (discussed below) and up till now there are no other known approaches, which would satisfy seven (maximum) characteristics of robustness (Brauers & Zavadskas, 2010).
MULTIMOORA method (Ratio System, Reference Point approach, Full Multiplicative Form, nominal group technique and Delphi) firstly was introduced by Brauers in 2004. This method helps to deal with subjectivity issues, which arise from the employment of weights in other well-known multi-objective methods. Belgian professor Brauers and his colleague from Lithuania Zavadskas used these methods together. Because rank correlation methods and outranking methods were conflicting, hence, the normalization of raw data by Ratio System was presented (Brauers, 2004). Reference Point method uses the ratios achieved from the Ratio System method and becomes dimensionless. Ratio System and Reference Point methods together results in a MOORA method (Brauers & Zavadskas, 2006). The first usage of multiplicative function was reported by Miller and Starr (1969). Brauers and Zavadskas in 2010 created the MULTIMOORA method by combination of MOORA with the Full Multiplicative Form (Balezentis et al., 2010).
The full multiplicative form(FMF). Brauers & Zavadskas (2010) decided that MOORA can be updated by the Full Multiplicative Form. According to them, when objectives move in different directions it is important to distinguish between maximization and minimization pattern of the objectives. Hence, objectives after maximization should stay for numerator and objectives for minimization for denominator accordingly, as shown in the formula (4).
j j j
B
A
U
=
(4)∏
=
= n
i ij
j
X
U
1
(5)
where:
j = 1, 2, . . . , m; m the number of alternatives,
i = 1, 2, . . . , n;n being the number of objectives,
Xij – response of alternative j on objective i, Uj – overall utility of alternative j.
The total utilities (Uj), which is possible to get by multiplication of different
measurement units, become dimensionless.
∏
=
= i
g gi
j
X
A
1
(6)
where:
i = the number of objectives to be maximized.
∏
=
+ =
n
i
k kj
j
X
B
1
(7)
where:
n – i – the number of objectives to be minimized.
Thus MULTIMOORA method is created by combining MOORA methods (Ratio system and Reference Point approach) and the Full Multiplicative Form (Brauers & Zavadskas, 2010). In this research summarized ranking of three methods will be used to get final results for alternatives.
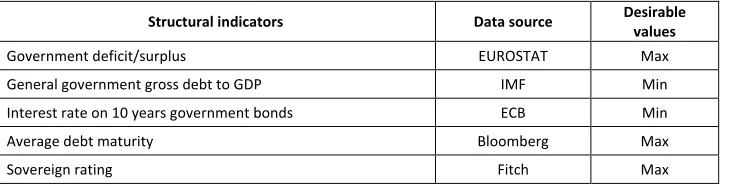
Table 1. Country risk parameters of indebtedness
Structural indicators Data source Desirable
values
Government deficit/surplus EUROSTAT Max
General government gross debt to GDP IMF Min
Interest rate on 10 years government bonds ECB Min
Average debt maturity Bloomberg Max
Sovereign rating Fitch Max
Source: own elaboration.
given for one or more countries, data was not available for every year related to research and data volatility was too high.
As it was already mentioned above, this study will analyse 5 structural indicators of EU countries chosen by authors. Table 1 shows information about these indicators: the name of structural indicator with its abbreviation, which will be used in research, the source where information came from and maximization and minimization rules, which will be used in computation of results.
The practical results of the research showed how well EU countries are able to manage their debts and what fiscal consequences it may cause them in a long term. These results could be a good guide for European institutions to take actions before it is too late to change anything.
RESULTS AND DISCUSSION
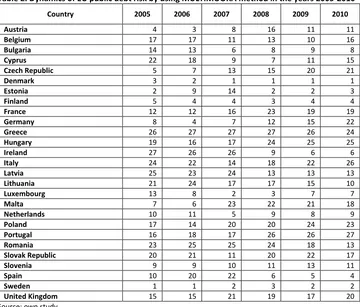
Separate analysis of each country is not the aim of the research. It is enough to show dynamics of a group of countries, because they share similar ranking and trends, but not without exceptions. Table 2 shows overall dynamics of public debt risk for all EU-27 countries. From the first look one can see that some countries were more stable concerning this issue, while others more volatile.
Table 2. Dynamics of EU public debt risk by using MULTIMOORA method in the years 2005-2010
Country 2005 2006 2007 2008 2009 2010
Austria 4 3 8 16 11 11
Belgium 17 17 11 13 10 16
Bulgaria 14 13 6 8 9 8
Cyprus 22 18 9 7 11 15
Czech Republic 5 7 13 15 20 21
Denmark 3 2 1 1 1 1
Estonia 2 9 14 2 2 3
Finland 5 4 4 3 4 4
France 12 12 16 23 19 19
Germany 8 4 7 12 15 22
Greece 26 27 27 27 26 24
Hungary 19 16 17 24 25 25
Ireland 27 26 26 9 6 6
Italy 24 22 14 18 22 26
Latvia 25 23 24 13 13 13
Lithuania 21 24 17 17 15 10
Luxembourg 13 8 2 3 7 7
Malta 7 6 23 22 21 18
Netherlands 10 11 5 9 8 9
Poland 17 14 20 20 24 23
Portugal 16 18 17 26 26 27
Romania 23 25 25 24 18 13
Slovak Republic 20 21 11 20 22 17
Slovenia 9 9 10 11 13 11
Spain 10 20 22 6 5 4
Sweden 1 1 2 3 2 2
United Kingdom 15 15 21 19 17 20
The volatility mostly was caused by the political or economic actions were undertaken in the specific countries.
Baltic States, for example, show positive dynamics in public debt rating over years. Only Estonia in comparison to Lithuania and Latvia has much better performance. Interesting factor is that situation in Baltic States over last years has not changed dramatically, but rating has increased. It happens because other European Union countries perform during these years even worse.
Nordic countries (Sweden, Finland and Denmark) are the leaders in sovereign debt risk ratings. It is the safest place for investors to buy government bonds from all over the Europe. Analysis shows us that in near future following countries will not have any financial problems.
Benelux countries along with Slovenia, followed by Austria and Germany demonstrate good results too. However, Belgium has first symptoms of danger, while Germany with Austria shows decline in their ratings for the last years. Most probably it happens because of implementation of financial assistance plans to indebted Eurozone states. According to the study, there exists a possibility that Germany in near future could lose its triple A rating and borrowing for them will be more expensive.
PIGS (Portugal, Italy, Greece and Spain) countries received the worst possible results. It is important to highlight that they had bad performance even before the crisis started, but they did nothing to prevent it, while Eastern bloc put more efforts into decreasing their public debt risk. Interesting results show us Spain with Ireland; by implementing special fiscal policies they managed from the year of 2008 to change their position from the losers to the partial winners by public debt risk.
Other countries of Central Europe have demonstrated a stable situation over 6 years on their ratings.
CONCLUSIONS
Research proved that it is possible to use MULTIMOORA methodology in order to rank countries by the risk of their public debt. It proofs that in future it is possible to use following model in order to predict economic recessions of countries in danger. If countries would take appropriate actions on time, they could save their economy.
By using in detail MULTIMOORA method and introduced new model was shown how accurate predictions might be in analysing riskiness of public debt. In addition, it demonstrates how MOORA and MULTIMOORA methods are working in practice and explains why following methodology is most robust in comparison to other multi-objective methods developed earlier.
Lithuania showed constant improvement on public debt liabilities. From 2005 till 2010 Lithuanian rank improved by 11 points. Study explains that it has happened not because of significant improvement of public debt management, but rather because of a dramatic economic slowdown in other European Union countries.
Ireland, for example till 2007 also was on last places, but correct actions made on time relatively saved economy from further recession and now it is located on 6th place by public debt risk.
Research showed that during the last 6 years absolute leaders on public debt risk were Nordic countries plus partly Luxemburg and Estonia. Following result suggests to risk-averse investors to buy government bonds of these countries. According to the model, it will be more safe even than to invest in Germany, France or United Kingdom.
Research would be more precise if data would cover not only European Union, but the whole world. In addition, more different structural indicators could be used for calculation of public debt risk in Eastern and Central European countries. It will make research more accurate. Furthermore, calculation of other multi-objective methods should be done and received results must be compared. Finally, more years should be analysed for making better predictions of further economic recessions in order to make appropriate actions on time, before it is too late.
REFERENCES
Adam, C. S., & Bevan D. L. (2005). Fiscal deficits and growth in developing countries. Journal of Public Economics, 4, 571-597.
Alesina, A., M. de Broeck, Prati, A., & Tabellini, G. (1992). Default risk on government debt in OECD Countries. Economic Policy: A European Forum, October, 427-463.
Balezentis, A., & Balezentis, T. (2011). An innovative multi-criteria supplier selection based on two-tuple MULTIMOORA and hybrid data. Economic Computation and Economic Cybernetics Studies and Research, 45(2), 37-56.
Balezentis, A., Balezentis, T., & Valkauskas, R. (2010). Evaluating situation of Lithuania in the European Union: structural indicators and MULTIMOORA method. Technological and Economic Development of Economy, 16(4), 578-602.
Brauers, W. K. M. (2004). Multiobjective optimization (MOO) in privatization. Journal of Business Economics and Management, 5(2), 59-66.
Brauers, W. K. M. (2008). Multi-objective decision making by reference point theory for a wellbeing economy. International Journal of Operations Research, 8, 89-104.
Brauers, W. K. M., & Ginevicius, R. (2010). The economy of the Belgian regions tested with MULTIMOORA. Journal of Business Economics and Management, 11(2), 173-209.
Brauers, W. K. M., & Zavadskas E. K. (2010). Project management by MULTIMOORA as an instrument for transition economies. Technological and Economic Development of Economy,
16(1), 5-24.
Brauers, W. K. M., & Zavadskas E. K. (2010). Robustness in the MULTIMOORA model, the case of Tanzania. Transformations in Business and Economy, 9(3), 67-83.
Brauers, W. K. M., & Zavadskas, E. K. (2006). The MOORA method and its application to privatization in a transition economy. Control and Cybernetics,35(2), 445-469.
Brauers, W. K. M., & Zavadskas, E. K. (2011). MULTIMOORA optimization used to decide on a bank loan to buy property. Technological and Economic Development of Economy, 17(1), 174-188. Brauers, W. K. M., & Zavadskas, E. K. (2012). Robustness of MULTIMOORA: a method for
Brauers, W. K. M., Balezentis, A., & Balezentis, T. (2011). MULTIMOORA for the EU member states updated with fuzzy number theory. Technological and Economic Development of Economy,
17(2), 259-290.
Brauers, W. K. M., Ginevicius, R., & Podvezko, V. (2010). Regional development in Lithuania considering multiple objectives by the MOORA method. Technological and Economic Development of Economy, 16(4), 613-640.
Commission of the European Communities. (1992). Treaty on European Union, Luxemburg: Office for Official Publications of the European Communities.
Diamond, P. (1965). National debt in a neoclassical growth model. American Economic Review,
55(5), 1126-1150.
DiPeitro, W. R., & Anoruo, E. (2012). Government size, public debt and real economic growth: a panel analysis. Journal of Economic Studies, 39(4), 410-419.
Garcia, M., & Rigobon, R. (2004). A Risk Management Approach to Emerging Market’s Sovereign Debt Sustainability with an Application to Brazilian Data. NBER Working Paper No. 10336.
National Bureau of Economic Research.
Ginevičius, R., & Podviezko, A. (2013). The evaluation of financial stability and soundness of Lithuanian banks. Ekonomska Istraživanja, 26(2), 191-208.
Hemming, R., Kell, M., & Schimmelpfenning, A. (2003). Fiscal Vulnerability and Financial Crises in Emerging Market Economies. Occasional Paper 218, International Monetary Fund.
Karlin, S., & Studden, W. J. (1966). Tchebycheff Systems: with Applications in Analysis and Statistics. New York: Interscience Publishers.
Keeney, R. L., & Raiffa, H. (1993). Decisions with Multiple Objectives. Preferences and Value Tradeoffs. Cambridge University Press.
Kildiene, S. (2013). Assessment of Opportunities for Construction Enterprises, In: European Union Member States Using the MULTIMOORA Method. 11th International Conference on Modern Building Materials, Structures and Techniques, Procedia Engineering 57, 557-564.
Kracka, M., & Zavadskas, E. K. (2013). Panel building refurbishment elements effective selection by applying multiple-criteria methods. International Journal of Strategic Property Management 17(2), 210-219.
Kumar, M. S., & Woo, J. (2010). Public Debt and Growth. IMF Working Papers, No. 10/174. Miller, D. W., & Starr, M. K. (1969). Executive Decisions and Operations Research. 2nd Edition,
Englewood Cliffs, NJ: Prentice-Hall.
Modigliani, F. (1961). Long-run implications of alternative fiscal policies and the burden of the national debt. Economic Journal, 71(284), 730-755.
Nelson, R. M. (2011). Sovereign Debt (SD) in Advanced Economies: Overview and Issues for Congress. DIANE Publishing.
Nelson, R. M., Belkin, P., & Mix, D. E. (2010, April). Greece's debt crisis: Overview, policy responses, and implications. Library of Congress Washington DC Congressional Research Service. Reinhart, C. M., & Rogoff, K. S. (2009). This Time Is Different: Eight Centuries of Financial Folly.
Princeton, NJ: Princeton University Press.
Reinhart, C. M., & Rogoff, K. S. (2010). Growth in a time of debt. American Economic Review, 100(2), 573-578.
Thomas, D. (2013). Sovereign debt restructuring in the Eurozone: a Polanyian reading of private law enforcement. Studies in Law, Politics, and Society, 62, 135-160.
Van Delft, A., & Nijkamp, P. (1977). The use of hierarchical optimization criteria in regional planning. Journal of Regional Science, 17, 195-205.
Wood, R. (2012). Delivering economic stimulus, addressing rising public debt and avoiding inflation, Journal of Financial Economic Policy, 4(1), 4-24.
Authors
Jelena Stankevičienė
Professor at the Department of Finance Engineering at Vilnius Gediminas Technical University (Lithuania). Her main research topics include assets and liability management, regulation of financial institution, financial management for value creation, value engineering.
Sergej Rosov
Master graduate of the Faculty of Business Management at Vilnius Gediminas Technical University (Lithuania). His research interests concentrate on the following topics: investment management, finance management, international economics and accounting.
Correspondence to:
Prof. Jelena Stankevičienė, PhD Vilnius Gediminas Technical University
Faculty of Business Management Saulėtekio al. 11, LT-10223 Vilnius, Lithuania