ISSN (Online): 2320-9364, ISSN (Print): 2320-9356
www.ijres.org Volume 3 Issue 1 ǁ Jan. 2015 ǁ PP.48-64
Decision Support System for Energy Saving Analysis in
Manufacturing Industry
D. O. Fakorede
1, A. I. Babatunde
2,S. A. OJOMU
31
Department of Mechanical Engineering, Cross River University of Technology, Calabar-Nigeria 2Edo State Agricultural Development Programme Benin city-Nigeria.
3Department of Electrical & Electronic Engineering, Cross River University of Technology, Calabar-Nigeria
ABSTRACT
Nowadays the attempts to optimize energy efficiency and environmental impact are increasingly present in all activity areas and specifically in manufacturing industry. An innovative approach to achieve these optimizations lies in advanced combination of decision support technologies and Knowledge Management. A benchmarking energy saving tool (decision support tool) was carried out in four (4) different years, 2007 to 2010 in Niger mills limited, located in Calabar to generate energy intensity and energy intensity index of the period. The result obtained for energy intensity in 2007 was 2.30GJ/m3, Energy intensity for 2008 was 2.30GJ/m3, Energy intensity for 2009 was 2.40GJ/m3, and energy intensity for 2010 was 2.30GJ/m3. This result shows that for the period of these four years, that the energy consumed is in an average range of 2.30GJ/m3. That if the productivity increase as the result of increase in production, the energy intensity will increase to 2.40GJ/m3 or there about as the case maybe as a result of increase in production.Keywords: optimization, intensity, innovative, decision, energy, improvement.
I.
INTRODUCTION
Since the beginning of industrial age, Energy has and still playing a very important role in development. The growth in the world economy has been driven by the increased use of energy and it will remain prevalent in future. Between 1970 and 2005, primary energy production world-wide grew by 84%. In 2005, fossil fuels account for 85% of all energy produced and industrial sector was the largest user of energy, accounting for 33% of total en ergy used. Within that sector, manufacturing accounts for about 73% of industrial energy use (Evans, 2003).
The Improvement in the world standard of living has been dependent in large part on the increase use of fossil fuels to generate energy. However, It is becoming clear that the growth in their use cannot continue indefinitely at its present rate, as it contribution to the ecosystem is at a high negative side. More seriously, environmental and climate change are having a detrimental effect on our world and approximately one-third of global energy demand and CO2 emissions is attributable to manufacturing industry. These increasing energy
problems worldwide are raising awareness of impact of energy use upon our environment, and this is a clear need to address energy saving potentials in manufacturing industries. Also there is need to analyze on-site the management of energy within the factory, with the goal to optimize it. The need to adapt quickly to business trends imposed by increases in energy demand should be factories major concerns, thus targets for energy savings can be set by indexing the results of production analysis and by defining a decision support system during decision making.
Decision support system as an innovative approach have found utility in the deregulated energy markets of Europe, as is evidenced in research into ways of measuring efficiency and utility of decision support models using stochastic models (Lahdelma et al, 2006). Some of the uses of Decision Support Systems (DSS) in energy modeling in Europe are for determining the optimum price of energy, and also for determining how much excess energy capacity is required to service periods of peak energy demand. DSS is used for planning not only where to locate energy generating infrastructure, but also for determining how much energy is produced, whether or not to build capacity in excess of the local demand, the environmental costs of building energy infrastructure at specific locations, and so on. However, energy planning in Africa, specifically Nigeria, is not as sophisticated. And to date, there are not many instances of DSS technology in use for the planning of any aspect of electric energy generation.
Decision support approach for efficient energy flow
can be either refurbishment or retrofit. The term refurbishment implies the necessary modifications in order to return a plant to its original state, while retrofit includes the necessary actions that will improve the plant‟s energy and/or environmental performance.
The state of practice procedure for the improvement of a factory‟s energy efficiency in its operational phase follows four steps:
Figure: 1 Procedure for the improvement of energy efficiency in its operational phase
Step 1:plant’s analysis. The main purpose of this step is to evaluate the characteristics of the energy systems and the patterns of energy use for the building. The building characteristics can be collected from the mechanical/ electrical drawings and/or from discussions with plant‟s operators. The energy use patterns can be obtained from a compilation of utility bills over several years. Analysis of the historical variation of the utility bills allows the energy auditor to determine if there are any seasonal and weather effects on the plant‟s energy use.
Step 2: Walk-through survey. Potential energy saving measures is identified in this part. The results of this step are important since they determine whether the plant warrants any further energy auditing work. Some of the tasks involved in this step are:
Identification of the customer concerns and needs;
Checking of the current operating and maintenance procedures;
Determination of the existing operating conditions of major energy use equipment (lighting, heating ventilation and air-conditioning systems, motors, etc.);
Estimation of the occupancy, equipment and lighting (energy use density and hours of operation).
Step 3: Creation of the reference building. The main purpose of this step is to develop a base-case model, using energy analysis and simulation tools, that represents the existing energy use and operating conditions of the plant. This model is to be used as a reference to estimate the energy savings incurred from appropriately selected energy conservation measures.
Step 4: Evaluation of energy saving measures. In this step, a list of cost-effective energy conservation measures is determined using both energy saving and economic analysis. A predefined list of energy conservation measures is prepared. The energy savings due to the various energy conservation measures pertinent to the plant using the baseline energy use simulation model are evaluated. The initial costs required to implement the energy conservation measures are estimated. The cost-effectiveness of each energy conservation measure using an economic analysis method (simple payback or life cycle cost analysis) is assessed.
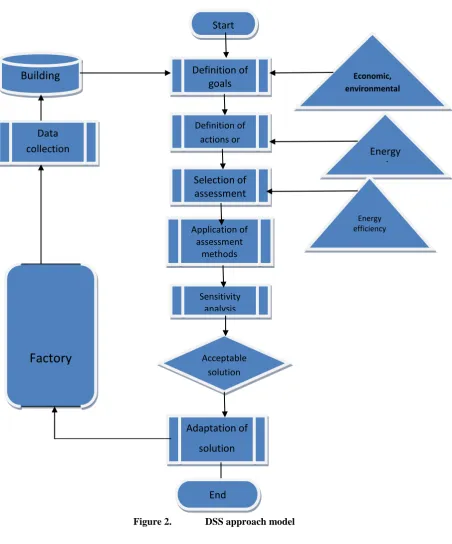
Regardless of the dwelling‟s phase (design or operational), energy efficiency and sustainability in the plant is a complex problem. This is attributed mainly to the fact that plants consist of numerous subsystems that interrelate with each other. Therefore plant‟s sustainability is reached by taking the necessary decisions that are optimum for the overall system. This implies a decision support approach with the following steps:
Criteria
main
categories
Plant
analysizing
Walk-
through
survey
Creation of
reference
building
Evaluation
of energy
Identification of the overall goal in making a decision, subsidiary objectives and the various indices or criteria against which option performance may be measured (objective function);
identification of the alternative options or strategies;
Assessment of each option and/or strategy performance against the defined criteria;
Weighting of objectives or criteria;
Evaluation of the overall performance;
Evaluation and ranking of options;
Sensitivity analysis.
Figure 2. DSS approach model
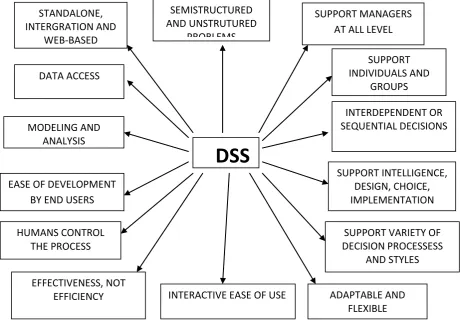
The roles of DSS
The functions and qualities of a DSS can be summarized as follows: • Semi-structured and unstructured problems definition and resolution
Start
Definition of
goals
Definition of actions or
scenarios
Selection of
assessment
methods
Application of assessment
methods
Sensitivity analysis
Acceptable solution
Adaptation of
solution
Building
data
Data
collection
Factory
Economic, environmental
goals
Energy
saving
measures
Energy efficiency improvement
methods
• Supports managers at all levels • Supports individuals and groups • Interdependent or sequential decisions
• Supports intelligence, design, choice, implementation • Supports a variety of decision processes and styles • Adaptable and flexible
• Interactive ease of use • Effectiveness, not efficiency • Humans control the process • Ease of development by end user • Modeling and analysis
• Data access
• Standalone, integration and web-based
The functions of the most interest for the study are the ones dealing with modeling and analysis.
Figure 3. Diagram of DSS roles
Methods of data sourcing through DSS
Traditionally, the decision makers of Niger mill are seen as the focal point of organizational choices. It therefore become very important to understand how decision makers arrive at the choices they make. The solution of a problem is not only a factor of the information available on the subject matter, but the knowledge from the information, experience in resolving similar issues, and learning ability were far more important factors in making good decisions rather than the quantum of available information. Literature is strewn with instances of operational, marketing, strategic and tactical failings within businesses with an abundance of information, that were corrected by adopting key decision support systems principles. Thus, the follow subsystem of DSS was adopted in this research:
a. Data Management Subsystem b. Model Management Subsystem c. User Interface (Dialog) Subsystem d. Knowledge based Management Subsystem
INTERACTIVE EASE OF USE
ADAPTABLE AND
FLEXIBLE
SEMISTRUCTURED
AND UNSTRUTURED
PROBLEMS
DATA ACCESS
MODELING AND
ANALYSIS
EASE OF DEVELOPMENT
BY END USERS
HUMANS CONTROL
THE PROCESS
DSS
SUPPORT INTELLIGENCE,
DESIGN, CHOICE,
IMPLEMENTATION
SUPPORT VARIETY OF
DECISION PROCESSESS
AND STYLES
EFFECTIVENESS, NOT
EFFICIENCY
INTERDEPENDENT OR
SEQUENTIAL DECISIONS
STANDALONE,
INTERGRATION AND
WEB-BASED
SUPPORT MANAGERS
AT ALL LEVEL
SUPPORT
INDIVIDUALS AND
a. Data management subsystem encompasses all the activities geared towards the administration of data systems, the representation of data and the channels of interaction between data and the end user (or model user). A lack of „good‟ data, or information could pose major problems to decision making, as the ability of the information available to sustain the decision and to yield a certain projected (positive) outcome is based on the good quality of the information (or the information source).
b. Model management subsystem involves the templates and structures that describe how data, and processes flows, and are utilized for the purpose of achieving targets and goals. The model gives formalization to the decision process, and removes the arbitrariness and ad hoc representation that would otherwise describe the process. Decisions should not occur in a vacuum, and even in well articulated and thought-out processes, the choices to be made must conform to the underlying objectives that are being pursued. Therefore, with a data subsystem providing the assortment of choices, the model could be likened to a filtration system through which such choices are strained in order to get the most efficient and optimal outcomes.
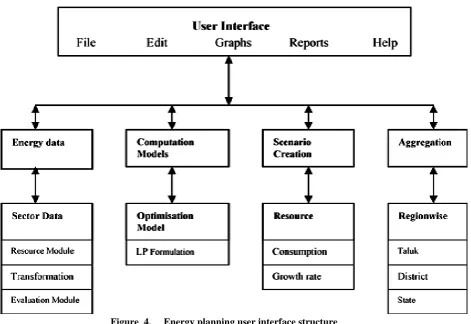
c. User interface and dialog subsystem attempts to depict and translate the real world intentions and conceptualization of the user into computer graphical and textual notation. The effective interface should offer the user perspectives of the real world equivalents connected with the actions being carried out.
Figure 4. Energy planning user interface structure
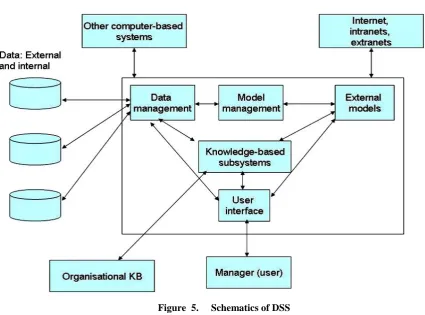
d. Knowledge based subsystem, which functions as a fulcrum for the other subsystems. It is said that the world today is moving away for an information society towards a knowledge society in which knowledge forms the major component of any human activity. Economic, social, cultural, and all other human activities become dependent on a huge volume of knowledge and distilled information. Knowledge has thus become the major source of creative impetus. The knowledge based subsystem functions on both an intuitive and technical dimension – technical because the available knowledge would influence the 23 programming approach towards designing a model, and intuitive because the information from available data is internalized by decision maker to arrive at what constitutes knowledge in any given instance.
Figure 5. Schematics of DSS
DSS modeling approach
A model for decision support is a template upon which decision variables are applied so as to derive an optimal result of how certain tasks should be carried out. The objective of many decision support systems is to optimize processes and practices in some ways. This is usually achieved by using techniques like Fuzzy sets, Bayesian nets, mixed integer programming or linear programming to derive better outcomes for a chosen task or activity.
In the case of Niger Mills which have multi-criteria energy problems, a multi-objective criteria modeling is used to analyze such problems. A decision support system for energy analysis would have as criteria the requirement to maximize energy output, to maximize the spread of energy resources used, and to minimize costs. A satisfying solution for a decision model would be one that fits the needs of all the contending criteria as best as possible.
Mathematical programming is a technique for solving problems involving maximization or minimization, subject to constraints on resource, capacity, supply, demand, and such other criteria. AMPL is a language for programmatically specifying such optimization problems. It provides an algebraic notation that is very close to the way that you would describe a problem mathematically, so that it is easy to convert from a familiar mathematical description to AMPL.
The selection of AMPL as utility for describing the core model of this study is borne out of the ease of translation of the mathematical expressions defining the problem into an equivalent program expression. The pattern of DSS construction flows from a constructive model design to a preferential model design which is then subject to the intuitive and experiential manipulation of the modeler. In that guise, the constructive model (core model) will be described using AMPL.
Ultimately, the goal will be to describe a generic model incorporating as many energy sources as can be motivated from available resource information, at minimal energy generating cost and with maximum energy output levels; and secondarily to accommodate various combinations and a scenarios of energy source, expenditure level and output targets as suits the particular intentions of decision makers.
Multi-objective criteria modelling
A basis for dimensioning decision models that would be suitable for this discussion is the expected outcomes resultant from the model. The classic decision optimization formula is:
y = f (x) x∈ Xo
rationality. This formulation reduces very elegantly under linear computation to a bounded valuation that satisfies the mathematical condition, resolving into a model
y = f (x) Rn y Rm
Where, Rn and Rm are sets of bounded possible variables and outcomes.
Decision making towards energy utilization at Niger mills, aims at reaching an outcome that is acceptable. The concept leans on the theory of bounded rationality, which states that humans have a limited capacity to assimilate and process all factors that can be considered in reaching some decision or conclusion. Rather than attempt to review and satisfy all possibilities, rational possibilities are highlighted, within the cognitive limitations of the decision maker, and these are targeted at for optimization. In summary, it can be stated that:
Optimization of decisions, especially in the face of uncertainties, is very difficult and requires support using models
Decision models do not replace decision, they only enhance the quality
Multi criteria models create conflicts of interest; the conflicts are best resolved by settling for satisfying rather than optimizing solutions.
II.
METHODOLGY
The methodology adopted for evaluating the project problem and prescribing a solution to the problem stated in the previous section adopts as much as is possible the precepts for a scientific research as described by Christian Dawson (Dawson, 2005). For our specific task, the problem domain lies within the field of computer science, but it can be seen from the review of literature that the application domain of decision support systems cuts across many subject and industry areas. This chapter explains the research design, data collection and model specification raised on the study.
Research design
Research design is the starting bonnet is carrying out actual research work. Research design according to Careenelel (1992) is design to the specification of methods and procedures employed for acquiring the information needed to source problems. It addressed planning of scientific inquiry designing a strategy for finding out something and specifies precisely what the researchers want to find out and the best way to do it.(Babbic, 1986 and Crano et al 1986). This study employed the analytical and descriptive research methods.
Data collection
Information and knowledge gathering is done from review of Niger mills completed in June 2010. The data collected from the plant are used in this report to company, and the feedback was used to formulate the data tables that were used as input for the A Mathematical Programming Language (AMPL) model. The gathered information is then used to motivate an objective. The model for the solution of the function is described using AMPL, and the data is formatted in AMPL format. A hypothesis is described using the AMPL model as its basis, and then the AMPL program is run and the outcomes are compared with the null hypothesis. The result is analyzed and compared with prevailing performance information on energy generation and resource utility, and based on the analysis the hypothesis is accepted or rejected.
Description of the system
The floor area of the factory is 44100m3 the major sources of energy are electricity from power holding company of Nigeria (PHCN) and also through generated plants. There are 2 mills in the milling house; one is the wheat, and the maize mill. The capacity of the wheat mill is 1000 tones per 24 hours but the mill is only used for about 16hours per day while the capacity of the maize mill is 200 tonnes per day but only used for 8hours per day.
The system input materials are wheat and maize grains while the output (product) materials are bread flour at ratio of 0.25, 0.5 of wheat offal‟s (brans), 0.75 of pasta semolina and ratio of 1 for macaroni. The operations including in the system are energy associated with fuels and lubricants and energy used for all administrative and other non-production functions (Smith, D. 1998).
The data collected include the following:
Production output from 2007 – 2010
Table 1. Monthly Energy Consumption and Production output for 2007
MONT H
ELECTRI CITY
(GJ)
DIESEL (GJ)
PETROL (GJ)
LUBRICAN T (GJ)
TOTAL (GJ)
AMOUNT (N)
TOTAL PRODUCTIO
N (TONNES)
JAN 1420.24 7505.25 726.48 9651.97 32,173,233.3 16,895.34
FEB 1341.65 6911.61 805.88 80.15 9139.29 30,464,300 16,024.32
MARCH 1123.13 5628.48 1125.01 7876.62 26,255,400 14,8014.21
APRIL 1058.70 5535.07 803.79 7397.56 24,658,533.3 13,154.14
MAY 1019.90 6179.76 589.46 7789.12 25,963,733.3 14,001.21
JUNE 1245.48 6876.23 661.78 49.21 8832.69 29.442,300 15,361.40
JULY 1321.12 6594.67 601.15 8516.94 28,389,800 14,695.24
AUGUS T
1414.46 6214.01 590.67 8219.14 28,389,800 14,376.64
SEPT 925.78 5426.95 642.05 6994.78 27,397,133.3 13,021.41
OCT 1214.28 5680.61 976.12 7871.01 23,315,933.3 14,826.87
NOV 1428.32 5725.23 699.18 16.40 7869.13 26,230,433.3 13,015.35
DEC 1575.23 6940.14 836.25 17.40 9368.84 31,229,466.7 16,342.22
TOTAL 15,088.29 75,218.0 1
9,057.82 162.98 99,527.09 331,756,966.7 175,727.95
Table 2. Monthly Energy Consumption and Production output for 2008 MONTH ELECTRI
CITY (GJ)
DIESEL (GJ)
PETROL (GJ)
LUBRICA NT (GJ)
TOTAL (GJ)
AMOUNT (N)
TOTAL PRODUCTI
ON (TONNES)
JAN 1824.25 7215.35 785.13 9824.73 32,749,100 16,321.30
FEB 1536.24 6538.12 933.60 9007.96 30,026,533.33 16,873.24
MARCH 1214.56 5814.92 1331.92 8361.40 27,871,333.33 14,542.16
APRIL 1028.35 5518.24 1320.46 7867.05 26,223,500 14,480.75
MAY 1001.22 5608.56 1152.78 8762.56 29,208,533 14,245.11
JUNE 1658.25 4685.25 1255.39 24.59 7623.48 25,411,600 13,987.20
JULY 1321.59 4859.66 1137.80 61.39 8380.44 27,934,800 13,678.27
AUGUST 1674.32 4975.84 1371.80 8021.96 26,739,866.67 14,735.16
SEPT 975.24 6253.05 949.72 8178.01 27,260,033.3 14,813.48
OCT 1531.52 4895.06 1208.92 7635.39 25,451,300 13,124.19
NOV 1321.52 5510.23 989.97 16.20 7837.92 26,126,400 14,432.23
DEC 1815.21 5650.16 889.92 16.20 8371.49 27,904,966.7 14,786.53
Table 3. Monthly Energy Consumption and Production output for 2009
MONTH ELECTRI CITY
(GJ)
DIESEL (GJ)
PETROL (GJ)
LUBRICA NT (GJ)
TOTAL (GJ)
AMOUNT (N)
TOTAL PRODUCTIO
N (TONNES)
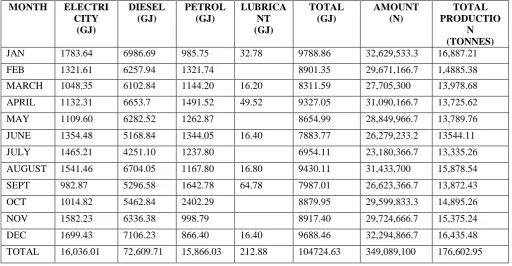
JAN 1783.64 6986.69 985.75 32.78 9788.86 32,629,533.3 16,887.21
FEB 1321.61 6257.94 1321.74 8901.35 29,671,166.7 1,4885.38
MARCH 1048.35 6102.84 1144.20 16.20 8311.59 27,705,300 13,978.68
APRIL 1132.31 6653.7 1491.52 49.52 9327.05 31,090,166.7 13,725.62
MAY 1109.60 6282.52 1262.87 8654.99 28,849,966.7 13,789.76
JUNE 1354.48 5168.84 1344.05 16.40 7883.77 26,279,233.2 13544.11
JULY 1465.21 4251.10 1237.80 6954.11 23,180,366.7 13,335.26
AUGUST 1541.46 6704.05 1167.80 16.80 9430.11 31,433,700 15,878.54
SEPT 982.87 5296.58 1642.78 64.78 7987.01 26,623,366.7 13,872.43
OCT 1014.82 5462.84 2402.29 8879.95 29,599,833.3 14,895.26
NOV 1582.23 6336.38 998.79 8917.40 29,724,666.7 15,375.24
DEC 1699.43 7106.23 866.40 16.40 9688.46 32,294,866.7 16,435.48
TOTAL 16,036.01 72,609.71 15,866.03 212.88 104724.63 349,089,100 176,602.95
Table 4. Monthly energy consumption and production output for 2010
MONTH ELECTRI CITY
(GJ)
DIESEL (GJ)
PETROL (GJ)
LUBRIC ANT
(GJ)
TOTAL (GJ)
AMOUNT (N)
TOTAL PRODUCTIO
N (TONNES)
JAN 1638.46 7237.07 887.57 9763.10 32,543,666.7 16,985.30
FEB 1312.16 5852.83 1223.21 35.36 8388.20 27,960,666.7 14,987.65
MARCH 1123.13 4521.13 1312.08 32.74 7989.08 26,630266.6 13,324.32
APRIL 1048.35 5078.12 1351.79 8458.26 24,827,400 13,515.74
MAY 1245.84 5694.31 1236.87 16.40 8193.42 23,978‟066.7 12,415.63
JUNE 1564.21 5915.69 1222.06 8731.96 29,106,533.3 15,895.47
JULY 1241.46 5487.77 1315.40 30.27 8074.90 26,916,333.3 14,885.22
AUGUST 842.78 6464.44 1108.75 16.40 8462.37 28,207,900 13,431.22
SEPT 1541.64 6009.10 1412.92 8963.66 29,878,866.7 15,975.64
OCT 1104.28 5208.48 1143.81 49.18 8505.75 25,019,166.6 14,448.56
NOV 1528.23 4699.66 1125.53 8353.42 27,844,733.3 13,773.67
DEC 1658.34 6466.31 878.45 80.74 9083.84 30,279,466.6 16,672.85
TOTAL 15,848.88 66,664.91 14,188.40 261.09 99,993.28 333,310,933,3 17,631.28
Benchmarking and Energy-Saving Tool (BEST) for manufacturing industry
practice” technologies for each major manufacturing process. The Benchmarking and Energy Savings Tool is a process-based tool based on commercially available energy-efficiency technologies used anywhere in the world applicable to the flour industry. No actual flour facility with every single efficiency measure included in the benchmark will likely exist; however, the benchmark sets a reasonable standard by which to compare for plants striving to be the best. The energy consumption of the benchmark facility differs due to differences in processing at a given flour facility. The tool accounts for most of these variables and allows the user to adapt the model to operational variables specific for the flour facility. BEST compares a facility to international or domestic best practice using an energy intensity index (EII) which is calculated based on the facility‟s energy intensity and the benchmark energy intensity. The EII is a measurement of the total production energy intensity of a flour facility compared to the benchmark energy intensity as in the following equation:
𝐸𝐼𝐼 = 100 𝑃𝑖×𝐸𝐼𝑛𝑖
𝑃𝑖 ×𝐸𝐼,𝐵𝑃𝑛𝑖 = 100 𝐸𝑡𝑜𝑡
𝑃𝑖×𝐸𝐼,𝐵𝑃𝑛𝑖 ---( eqn 3.1)
Where
𝐸𝐼𝐼 = energy intensity index
𝑛 = number of products to be aggregated
𝐸𝐼 = actual energy intensity for products
𝐸𝑙𝑖,BP = best practice energy intensity for products
𝑃𝑖 = production quantity for product i (each product).
𝐸𝑡𝑜𝑡 = total actual energy consumption for all products
The EII is then used to calculate the energy efficiency potential at the facility by comparing the actual plant's intensity to the intensity that would result if the plant used "reference" best technology for each process step. By definition (see equation 1), a plant that uses the benchmark or reference technology will have an EII of 100. In practice, actual flour plants will have an EII greater than 100. The gap between actual energy intensity at each process step and the reference level energy consumption can be viewed as the technical energy efficiency potential of the plant. Results are provided in terms of primary energy (electricity includes transmission and generation losses in addition to the heat conversion factor) or final energy (electricity includes only the heat conversion factor). BEST also provides an estimate of the potential for annual energy savings (both for electricity and fuel) and energy costs savings, if the facility would perform at the same performance level as the benchmark or “reference” flour plant. All intensities are given as comprehensive intensities. Comprehensive electricity intensity is equal to the total electricity consumed per tonne of flour produced. Similarly, comprehensive fuel intensity is equal to the total fuel consumed per tonne of flour produced, based on the raw materials input (wheat and maize grains).
III.
RESULT
This chapter focuses on the result and discussion of the findings, due to the presentation of data collection from the researched based.
Data presentation and calculation
From the data presented in the previous chapter, we computed the total summary of energy consumed through the years;
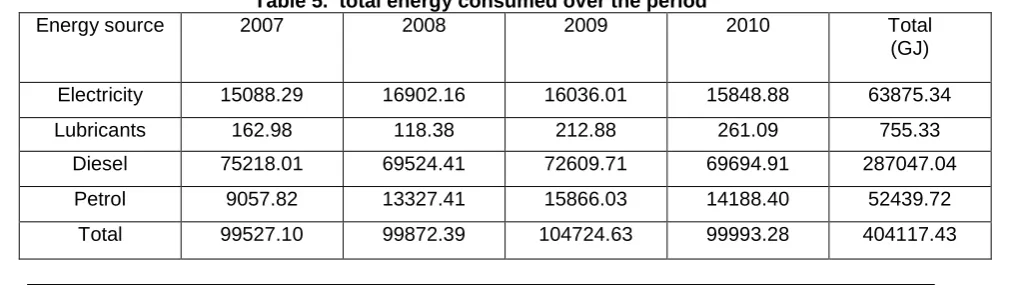
Total Energy Consumed:
This is the summation of the amount of electricity; lubricants, diesel and petrol used after conversion to energy and are shown in the table below:
Table 5. total energy consumed over the period
Energy source 2007 2008 2009 2010 Total
(GJ)
Electricity 15088.29 16902.16 16036.01 15848.88 63875.34
Lubricants 162.98 118.38 212.88 261.09 755.33
Diesel 75218.01 69524.41 72609.71 69694.91 287047.04
Petrol 9057.82 13327.41 15866.03 14188.40 52439.72
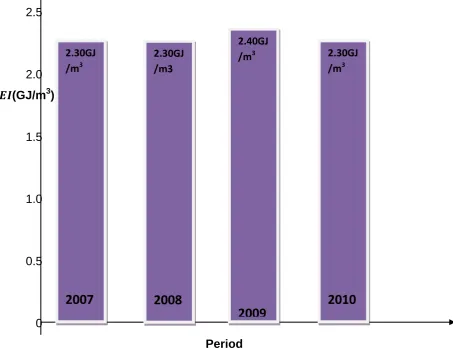
Intensity of energy:
This is defined as the ratio of annual energy consumed in GJ to the factory floor area in m3.
To calculate the intensity of energy for the period of 4years i.e. 2007 – 2010 using the intensity formula:
Intensity of energy (𝐸𝐼) (GJ/m3) = 𝑇𝑜𝑡𝑎𝑙 𝑒𝑛𝑒𝑟𝑔𝑦 𝑐𝑜𝑛𝑠𝑢𝑚𝑒𝑑 (𝐺𝐽 )𝑓𝑙𝑜𝑜𝑟 𝑎𝑟𝑒𝑎 (𝑚3) --- (eqn 4.1)
Where the surface area was given to be 44100m2, so that the energy intensity for 2007 will be:
Energyinten = 99527.10
44100 = 2.26 =2.30GJ/m 3
Intensity of energy for 2008:
Energyinten = 99872.39
44100 = 2.26=2.30GJ/m 3
Intensity of energy for 2009:
Energyinten = 104724 .63
44100 = 2.36=2.40GJ/m 3
Intensity of energy for 2010: Energyinten =
99993.28
44100 = 2.267=2.30GJ/m 3
Plotting a graph with the relationship of the intensity of energy to the period of years
Fig 4.1. Intensity of energy for period of four years
2.5
2.0
𝑬𝑰
(GJ/m
3)
1.5
1.0
0.5
0
Period
After calculating the intensity of energy for the period of 2007 – 2010, we look at the energy intensity index of each year using the benchmarking energy saving model, which is represented mathematically as:
𝐸𝐼𝐼 = 100 𝑃𝑖 × 𝐸𝐼 𝑛 𝑖
𝑃𝑖 × 𝐸𝐼, 𝐵𝑃𝑛
𝑖 = 100
𝐸𝑡𝑜𝑡 𝑃𝑖 × 𝐸𝐼, 𝐵𝑃𝑛
𝑖
2.30GJ
/m
32007
2.30GJ
/m3
2008
2.40GJ
/m
32009
2.30GJ
/m
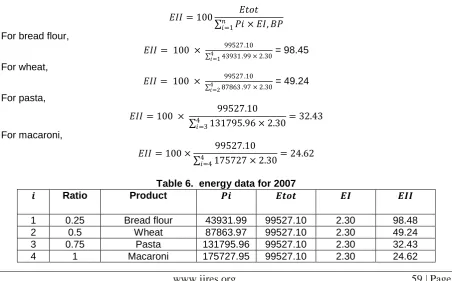
3Using the formula to generate the energy intensity index for 2007 Where; 𝐸𝑡𝑜𝑡 = 99527.10GJ
𝑃𝑖 = ?
𝐸𝐼,BP=2.30GJ/m2
n= no of product aggregated = 4 (Bread flour + wheat, pasta semolina + macaroni). Assuming bread flour = 𝑖 =1, wheat = 𝑖 = 2, pasta = 𝑖 = 3, macaroni = 𝑖 = 4
Calculating for production quantity of bread flour(𝑃𝑖), when 𝑖 = 1, recall 𝑖 =1 (bread flour) was produce at 0.25 ratio.
Therefore, 𝑃𝑖 = total production of products in 2007 × 0.25 = 175727.95 × 0.25 = 43931.99bags
Production quantity for wheat (𝑖 = 2) When 𝑖 = 2, recall 𝑖 = 2 was produce at 0.5 ratio
𝑃𝑖 = total production of products in 2007 × 0.5 = 175727.95 × 0.5 = 87863.97bags
Production quantity for pasta (𝑖 = 3) When 𝑖 = 3, and was produce at 0.75 ratio
𝑃𝑖 = total production of products in 2007 × 0.75 = 175727.95 × 0.95 = 131,795,96bags
Production quantity for macaroni (𝑖 = 4) When 𝑖 = 4, and produce at 1 ratio
𝑃𝑖 = total production of products in 2007 × 1 = 175727.95 × 1 = 175727.95
Inputting the data into the equation to get the energy intensity of each product in 2007
𝐸𝐼𝐼 = 100 𝐸𝑡𝑜𝑡
𝑃𝑖 × 𝐸𝐼, 𝐵𝑃 𝑛
𝑖=1
For bread flour,
𝐸𝐼𝐼 = 100 × 4 43931 .9999527.10
𝑖=1 × 2.30 = 98.45
For wheat,
𝐸𝐼𝐼 = 100 × 4 87863 .9799527 .10
𝑖=2 × 2.30 = 49.24
For pasta,
𝐸𝐼𝐼 = 100 × 99527.10 131795.96 × 2.30 4
𝑖=3 = 32.43
For macaroni,
𝐸𝐼𝐼 = 100 × 99527.10 175727 × 2.30 4
𝑖=4 = 24.62
Table 6. energy data for 2007
𝒊 Ratio Product 𝑷𝒊 𝑬𝒕𝒐𝒕 𝑬𝑰 𝑬𝑰𝑰
1 0.25 Bread flour 43931.99 99527.10 2.30 98.48
2 0.5 Wheat 87863.97 99527.10 2.30 49.24
3 0.75 Pasta 131795.96 99527.10 2.30 32.43
Therefore, the total energy intensity index for the year 2007 is the sum total of all the energy intensity index of each product;
98.45+49.24 + 32.43 + 24.62 = 𝟐𝟎𝟒. 𝟕𝟒 Using the formula to calculate the energy intensity index for 2008 Where, 𝐸𝑡𝑜𝑡=99872.39GJ
𝐸𝐼, BP=2.30GJ/m 3
𝑃𝑖=? n =4
Calculating for production quantity of bread flour(𝑃𝑖), when 𝑖 = 1, recall 𝑖 =1 (bread flour) was produce at 0.25 ratio
𝑃𝑖 =176019.62 × 0.25 = 44004.91bags
For wheat,
When 𝑖 = 2, 0.5 ratio
𝑃𝑖 = 176019.62 × 0.5 = 88009.81bags
For pasta,
When 𝑖 = 3, 0.75 ratio
𝑃𝑖 = 176019.62 × 0.75 = 132014.72bags
For macaroni
When 𝑖 = 4, 1 ratio
𝑃𝑖 = 176019.62 ×1 = 176019.62bags
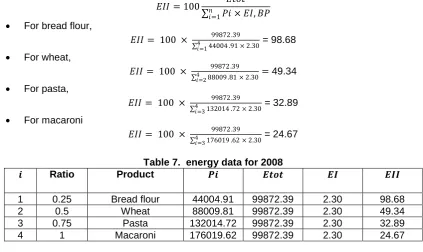
Inputting the data into the equation to get the energy intensity of each product in 2008
𝐸𝐼𝐼 = 100 𝐸𝑡𝑜𝑡
𝑃𝑖 × 𝐸𝐼, 𝐵𝑃 𝑛
𝑖=1
For bread flour,
𝐸𝐼𝐼 = 100 × 4 44004 .9199872.39
𝑖=1 × 2.30 = 98.68 For wheat,
𝐸𝐼𝐼 = 100 × 4 88009 .8199872.39
𝑖=2 × 2.30= 49.34 For pasta,
𝐸𝐼𝐼 = 100 × 4 132014 .7299872.39
𝑖=3 × 2.30 = 32.89 For macaroni
𝐸𝐼𝐼 = 100 × 4 176019 .6299872.39
𝑖=3 × 2.30 = 24.67
Table 7. energy data for 2008
𝒊 Ratio Product 𝑷𝒊 𝑬𝒕𝒐𝒕 𝑬𝑰 𝑬𝑰𝑰
1 0.25 Bread flour 44004.91 99872.39 2.30 98.68
2 0.5 Wheat 88009.81 99872.39 2.30 49.34
3 0.75 Pasta 132014.72 99872.39 2.30 32.89
4 1 Macaroni 176019.62 99872.39 2.30 24.67
Therefore, the total energy intensity index for the year 2008 is the sum total of all the energy intensity index of each product;
Using the formula to calculate the energy intensity index for 2009 Where, 𝐸𝑡𝑜𝑡=104724.63GJ
𝐸𝐼, BP=2.40GJ/m 3
𝑃𝑖=? n =4
Calculating for production quantity of bread flour(𝑃𝑖), when 𝑖 = 1, recall 𝑖 =1 (bread flour) was produce at 0.25 ratio
𝑃𝑖 = total production of products in 2009 × 𝑟𝑎𝑡𝑖𝑜
𝑃𝑖 = 176602.95 × 0.25 = 44150.5𝑏𝑎𝑔𝑠
For wheat 𝑖 = 2, 𝑎𝑡 0.5 𝑟𝑎𝑡𝑖𝑜
𝑃𝑖 = 176602.95 × 0.5 = 88301.5
For pasta, 𝑖 = 3, 𝑎𝑡 0.75 𝑟𝑎𝑡𝑖𝑜
𝑃𝑖 = 176602.95 × 0.75 = 132452.2𝑏𝑎𝑔𝑠
For macaroni, 𝑖 = 4, 𝑎𝑡 1 𝑟𝑎𝑡𝑖𝑜
𝑃𝑖 = 176602.95 × 1 = 176602.95𝑏𝑎𝑔𝑠
Inputting the data into the equation to get the energy intensity of each product in 2009
𝐸𝐼𝐼 = 100 4 𝐸𝑡𝑜𝑡𝑃𝑖×𝐸𝐼,𝐵𝑃
𝑖=1
For bread flour,
𝐸𝐼𝐼 = 100 × 104724.63 44150.5 × 2.40 4
𝑖=1
= 98.80
For wheat,
𝐸𝐼𝐼 = 100 × 104724.63 88301.5 × 2.40 4
𝑖=2 = 49.42
For pasta,
𝐸𝐼𝐼 = 100 × 4 104724 .63132452 .2×2.40
𝑖=3 =32.94
For macaroni,
𝐸𝐼𝐼 = 100 × 104724.63 176602.95 × 2.40 4
𝑖=4
= 24.71
Table 8. Energy data for 2009
𝒊 Ratio Product 𝑷𝒊 𝑬𝒕𝒐𝒕 𝑬𝑰 𝑬𝑰𝑰
1 0.25 Bread flour 44150.5 104724.63 2.40 98.80
2 0.5 Wheat 88301.5 104724.63 2.40 49.42
3 0.75 Pasta 132452.2 104724.63 2.40 32.94
4 1 Macaroni 176602.95 104724.63 2.40 24.71
Therefore, the total energy intensity index for the year 2009 is the sum total of all the energy intensity index of each product;
=98.8+49.42+32.94+24.71=205.87
Using the formula to calculate the energy intensity index for 2010 Where, 𝐸𝑡𝑜𝑡=99993.28GJ
𝐸𝐼, BP=2.30GJ/m 3
Calculating for production quantity of bread flour(𝑃𝑖), when 𝑖 = 1, recall 𝑖 =1 (bread flour) was produce at 0.25 ratio
𝑃𝑖 = total production of products in 2009 × 𝑟𝑎𝑡𝑖𝑜
𝑃𝑖 = 176311.28 × 0.25 = 44077.82𝑏𝑎𝑔𝑠
For wheat 𝑖 = 2, 𝑎𝑡 0.5 𝑟𝑎𝑡𝑖𝑜
𝑃𝑖 = 176311.28 × 0.5 = 88155.64𝑏𝑎𝑔𝑠
For pasta, 𝑖 = 3, 𝑎𝑡 0.75 𝑟𝑎𝑡𝑖𝑜
𝑃𝑖 = 176311.28 × 0.75 = 132233.46𝑏𝑎𝑔𝑠
For macaroni, 𝑖 = 4, 𝑎𝑡 1 𝑟𝑎𝑡𝑖𝑜
𝑃𝑖 = 176311.28 × 1 = 176311.28𝑏𝑎𝑔𝑠
Inputting the data into the equation to get the energy intensity of each product in 2010
𝐸𝐼𝐼 = 100 4 𝐸𝑡𝑜𝑡𝑃𝑖×𝐸𝐼,𝐵𝑃
𝑖=1
For bread flour,
𝐸𝐼𝐼 = 100 × 99993.28 44077.82 × 2.30 4
𝑖=1
= 98.63
For wheat,
𝐸𝐼𝐼 = 100 × 99993.28 88155.64 × 2.30 4
𝑖=2 = 49.32
For pasta,
𝐸𝐼𝐼 = 100 × 4 132233 .46×2.3099993.28
𝑖=3 =32.88
For macaroni,
𝐸𝐼𝐼 = 100 × 99993.28
176311.28 × 2.30 4
𝑖=4
= 24.66
Table 9. Energy data for 2010
𝒊 Ratio Product 𝑷𝒊 𝑬𝒕𝒐𝒕 𝑬𝑰 𝑬𝑰𝑰
1 0.25 Bread flour 44077.82 99993.28 2.30 98.63
2 0.5 Wheat 88155.64 99993.28 2.30 49.32
3 0.75 Pasta 132233.46 99993.28 2.30 32.88
4 1 Macaroni 176311.28 99993.28 2.30 24.66
Therefore, the total energy intensity index for the year 2010 is the sum total of all the energy intensity index of each product;
= 98.63+49.32+32.88+24.66 =205.49
From the data derived after calculating the energy intensity index of each year, the table below was derived. We can actually know the energy efficiency potential of the plant. Recall that the benchmark energy saving tool stress that in practice, the 𝐸𝐼𝐼 must be greater than 100.
Table 10. Energy intensity index for each year.
𝑬𝑰𝑰 204.74 205.56 205.87 205.49
Using the data above, we plot a graph on the relationship of the 𝐸𝐼𝐼 to the period
225 Fig 4.2. Energy intensity index for the period
200 204.74 205.56 205.87 205.49
𝑬𝑰𝑰
150
100
Ref. point
50
0
2007 2008 2009 2010
(period)
IV.
DISCUSSION
From the result of the above analysis obtain from the period shows a slight change in the energy intensity (EI) and energy intensity index (EII). 2009 was discovered to be the most efficient due to high rate of un-efficient use of energy during the production phase of that year.
In the year 2010, it was observed to be the most efficient from the benchmarking evergy saving tool (BEST) due to it‟s lest rate of EII.
Due to the possible variation in the energy usage, decision-makers in Niger mill can base on the result analysis compare the performance information derived to generate an hypothesis either accepted or rejected.
V.
CONCLUSION
The research concludes that Decision Support Systems are assuming a bigger and more critical role in business decision making and resource management. From the analysis at the previous chapter, a DSS approach to solving problems must begin with an in-depth analysis of the whole energy system. As such the decision making is premised on the synthesis of data and information; such synthesis being achieved using an optimizing or satisfying model. The AMPL tool (benchmarking or energy saving tool) an energy model offers a quick-to-learn and deploy tool for achieving the optimization goals that affect decision making when planning to invest in energy capacity expansion. The results from the analysis show that the model generates values that are better than the default state and would serve as a good decision support resource.
VI.
RECOMMENDATION
Every manufacturing firm should take advantage of these analytical tools (DSS) used to resolve decision–making problems in the operations and scheduling of various energy generating or consumption facilities of plant.
The schedule must meet their respective energy commitment and maximize the economic returns from the operations of their facilities.
A decision support based approach should be used in the energy sector to enable the manager‟s choice of decision.
VII.
ACKNOWLEDGEMENT
Our profound gratitude goes God Almighty.
REFERENCES
[1.] Baumhogger, F., et al. (1998). MESAP, Version 3.1 Germany: Institution of Energy Economics and the Rational use of energy (IER); P.1-511.
[2.] Climaco, J., et al (1995) “A multiple objective linear programming model for power generation expansion planning.
International journal of energy research, Vol. 19, 419- 432.
[3.] Cormio, C., et al (2003). A regional energy planning methodology including renewable energy sources and environmental constricts. Renew sustain energy, Rev. 2003.7:99-130.
[4.] Dag, H., et al (2005): Modelling and optimization of electricity, steam and district heating production for a local Swedish utility. European Journal of operational Research. In press.
[5.] Dawson, C. (2005); Projects in computing and information systems: A student‟s Guide, Pearson press.
[6.] D. kolokotsa , et. Al.(2009) “Decision support methodologies on the energy efficiency and energy management in buildings, Vol. 3, pages 121-146.
[7.] D. stokic, (2006), Ambient Intelligence in manufacturing industry; control system point of view, the 8th IASTED conference on control and Applications, CA 2006, Montreal, May,2006.
[8.] Evans, L. B. (2003). Saving energy in manufacturing with smart technology, vol. 6. No 2.
[9.] Georgilakis, P. (2006), “State-of-the-Art of Decision support systems of the choice of Renewable Energy sources for Energy supply in isolated regions”, int. journal of Didtributed Energy Resources, Vol. 2, no.2,pp.129-150,2006.
[10.] Gongs.s, c.w,Haldi, P.A(2003). Dynamic formulation of top- down and bottom-up merging energy policy model. Energy policy. 2003, 31, 1017-31.
[11.] Han and Kamber (2001). Data mining concept and Techniques, San Diego, CA, Academic press. http://en.m.wikipedia.org/wiki/Decision_Support_system.
[12.] Henk, G. Sol et al. (1987). Expert systems and artificial intelligence in decision support system. Proceedings of the second mini Euro-conference, Lunteren, the Netherlands, 17-20 November 1985
[13.] Holsapple,C.W and A.B whinstone (1996). Decision support system: A Knowledge- Based Approach. St paul west publishing. ISBN 0-324-03578.0.
[14.] Homer, Homer Energy / National Renewable Energy Laboratory.[computer software]. Available :http://www.ceere.org/rerl/rerlhybrid power.html(URL)
[15.] Hoog, D. T and Hoobs, B. F(1993). An integrated resource planning model considering customer value, emissions and regional economic impact energy, vol 18, 1153 -1160.
[16.] Industrial energy audits (http://smartenergy./v/indexphp?Option=com-content&view=article&id=12&item id=13&lang=en) [17.] M. Hersh,(1999) “sustainable Decision making: the role of Decision system”, IEEE Trans. on man and cybermetic-part c.
applications and Reviews, vol.29,no.3,pp.395-408
[18.] Nakayama, H., (1994), Aspiration level approach to interactive multi-objective programming and its applications, working paper 94-112 international institute for applied systems analysis, (IIASA)
[19.] Power, D.J.,(2002).”Decision support systems:- concepts and resources for managers. Westport, conn. Quorum books. [20.] Ramachandra, T. V, (2007). “Regional integrated energy plan; centre for application of science and technology to rural areas
(ASTRA), Bangalore 560 012, India.
[21.] R. Allen., (1996). Decision Support System for power system operations Management. [22.] Smith, C.D (1998); efficient electricity use, 3rd edition. Pergamon press, inc oxford.
[23.] The Hybrid power system simulation model, Renewable Energy Research Laboratory.(Hybrid2 computer software). Available :http://www.ceere.org/rerl/rerlhybridpower.html(URL)
[24.] Wessels, J. and Wierzbicki, A., (1993), user-oriented methodology and technique for decision analysis and support, vol.397 lectures in economics and mathematical systems, springer-verlag, Berlin.
[25.] Wierzbicki, A,(1997), “on the role of institution in decision making and some ways of multi-criteria aid of institution, journal of multi-criteria decision analysis, vol6 pp. 65-72.