Study of Response of Gravity Dam under
Earthquake Acceleration
Mr. Arun. K. S Mr. S. Raghuraman
P.G Student Assistant Professor
Department of Civil Structural Engineering Department of Civil Structural Engineering RVS Technical Campus, Coimbatore RVS Technical Campus, Coimbatore
Abstract
Gravity dam is a huge artificial structure to confine and keep back the flowing water mainly for the generation of electricity. The huge capital outlay required for the dam construction coupled with the devastating effect it can have on life and property in case of failure, is a cause of great concern. Thus it is essential to ensure the safety of the dam in the design, pre-construction and post construction stages. The response of the dam under seismic loading is a combined effect of the interaction among dam, reservoir and foundation. The present code for the design of dam considers 0.1g as the maximum value of earthquake acceleration. This study involves the finite element modelling of gravity dam subjected to earthquake acceleration having maximum amplitude of 0.5g in software ANSYS 12.0 and finding out the type of failure, the dam likely to suffer. The effect of the cross section in resisting the failure is also studied.
Keywords: gravity dam, dam-foundation-reservoir, seismic analysis
________________________________________________________________________________________________________
I. INTRODUCTION
The dynamic analysis of a concrete gravity dam is a reasonably complex problem. The response of a dam subjected to dynamic loading is a combined effect of the interaction among dam, reservoir and foundation systems. Concrete dams are constructed as Monoliths separated by transverse contraction joints, oriented normal to the dam axis. These vertical joints extended from the foundation to the top of the dam and from the upstream face to the downstream face. Certain assumptions are made in the analysis of gravity dam like materials in the foundation and body of dam is isotropic and homogeneous. At the time of an earthquake, besides the normal forces, namely, self-weight, water pressure and silt, inertia and hydrodynamic forces act on a dam. The inertia force is the product of mass and acceleration and this force is acting in the direction opposite to that of ground motion. The horizontal inertia force acts from upstream to downstream as well as from downstream to upstream. Similarly the vertical inertia force acts from downward to upward as well as from upward to downward direction. Acceleration downward decreases the weight. Hence the dam is designed for the worst combination that is for the horizontal and vertical inertia forces. The inertia effect between the dam and reservoir causes the hydrodynamic forces on the dam. The direction of forces is opposite to the earthquake acceleration, but the acceleration changes sign in practice. Hence the force could be either pressure or suction. The codes provisions are given in IS 457-1957, IS 6512-1984 and for earthquake resistant design part IS 1893-1984 are still following. Many of the existing dams in Kerala are designed several years ago with minimal consideration of extreme earthquake loading conditions. The recent earthquakes points that, due importance should be given for earthquake loading while designing any structure. Hence the general behaviour of dams is to be evaluated critically.
II. ANALYSIS MODEL & EARTHQUAKE ACCELERATION
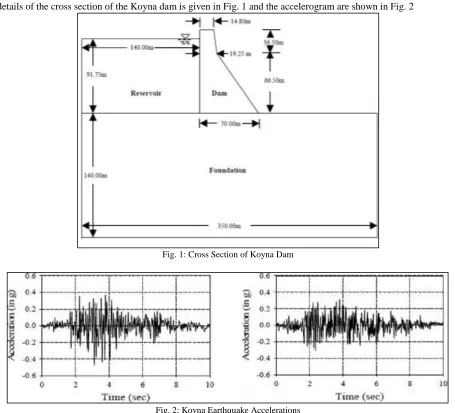
The Koyna dam situated in Maharashtra is taken for the current study. This dam was affected by the Koyna Nagar earthquake of 1967 having the maximum amplitude of acceleration of 0.5 g, which is so far the maximum value recorded in India. This dam is 103 m high and 70 m wide at its base. The depth of the reservoir at the time of the earthquake was 91.75m. Following the work of other investigators, the no overflow monolith of the dam is assumed to be in the plane stress condition. First order and plane stress elements have been used to model the dam body. The dam is assumed to rest on a 350 x 140 m foundation. The bottom of the foundation is assumed to be fixed and the foundation is considered to be in the plane strain condition. First order and plane strain elements have been used for modelling the foundation. Symmetric boundary conditions have been used at the ends of the foundation block to simulate the unbounded nature of the foundation. The reservoir is assumed to be 140 m in length, and first-order acoustic elements in ANSYS have been used for the reservoir. PLANE182 element is used to model foundation & dam and FLUID29 is used for modelling the reservoir.
accelerogram of Koyna Nagar earthquake is used for the seismic analysis. Self-weights of the structure, water pressure by modelling the reservoir are the other loads considered.
The details of the cross section of the Koyna dam is given in Fig. 1 and the accelerogram are shown in Fig. 2
Fig. 1: Cross Section of Koyna Dam
Fig. 2: Koyna Earthquake Accelerations
III. MODELS USED IN THE STUDY
To show the influence of foundation interaction as well as reservoir interaction on the response of the dam, three different models have been considered.
Model 1: Only the dam structure fixed at its base.
Model 2: The dam with the foundation fixed at its bottom.
Model 3: The entire dam-reservoir-foundation system.
These three models have been analyzed in time domain using the Koyna earthquake acceleration records as the input motion. For model 1, the dam is assumed to be fixed at its bottom and for other two models the fixity is provided at the bottom of the foundation. Symmetric boundary condition in x axis is provided at the ends of the foundation and also at the unrestrained end of the reservoir to imply the unbounded nature.
The seismic analysis is carried out on these models and the maximum response quantities deflection, stress x, y, shear stress xy&vonMises stress are found and compared. The results are given in the Table 1:
Table – 1 SeismicAnalysisResults
RESPONSES MODEL 1 MODEL 2 MODEL 3
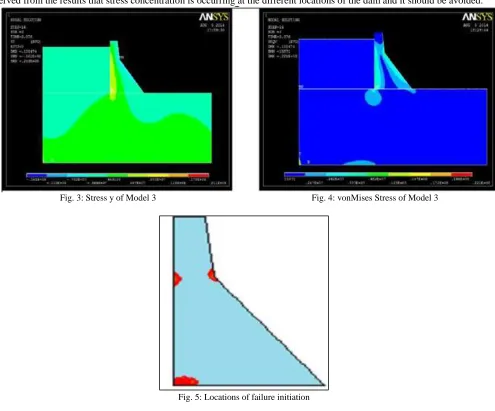
The responses are high for the models 2 & 3, which means that the foundation is inevitable in the analysis of gravity dams. Due importance should be given for the foundation in analysis. Among the tensile stresses, the stress y & the compressive stress i.e., vonMises stress, are found to be maximum for the model 3 and the contour plot of the stresses of model 3 is shown in fig.3 & fig.4. The compressive stress developed in the dam is less compared to the strength of the material of the dam. So the dam is safe in compression. But, the tensile stress developed is really high compared to the tensile strength of the material of the dam. Thus, the failure of the dam is due to tension. The locations where the damages are initiated are shown in the fig. 5. It can be observed from the results that stress concentration is occurring at the different locations of the dam and it should be avoided.
Fig. 3: Stress y of Model 3 Fig. 4: vonMises Stress of Model 3
Fig. 5: Locations of failure initiation
IV. MODIFIED MODELS
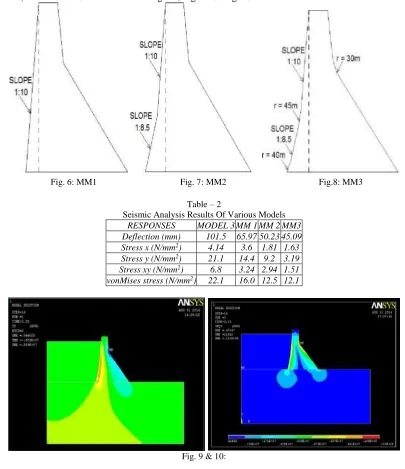
The analysis of the original section of the dam revealed that the section fails by tension during the earthquake having maximum amplitude of 0.5g. So the actual section of the dam is modified. The upstream side was vertical originally, and modification is done for the upstream side. Slope is provided for the upstream side, thereby increasing the base width of the actual section. The width of the base is gradually increased and the analyses were carried out and the results were compared. When the slope reached 1:10 (Fig.6), the dam becomes safe up to a depth of 69 meters from the top. This section is designated as modified model 1, MM1. Further modification is done for the MM1 up to a height of 34m from the heel. When the new slope became 1:8.5 (Fig.7), the dam section becomes safe for all the locations where there is no problem of stress concentration. This section is designated as modified model 2, MM2. To avoid the problem of stress concentration, changes in the slopes were carried out by providing gentle curves and curvature is also provide at the heel region (Fig.8). This final section is designated as modified model 3, MM3.
V. RESULTS AND DISCUSSIONS
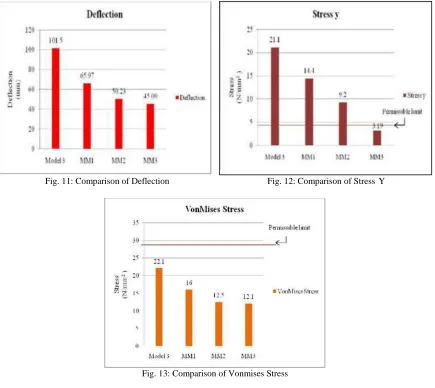
section. The provision of slope removes the problem of stress concentration. The results of MM3 show that the maximum compressive stress developed in the section is less than the compressive strength of the material of the dam. Also the tensile strength developed in the section is less than the permissible value of tensile stress. Hence the section becomes safe in both compressions as well as in tension. The contour plot of the maximum tensile & compressive stress of the modified model 3 is shown in the Fig.9 & Fig.10. The comparison of the deflection, stress y (tensile stress), &vonMises stress (compressive stress) of the Model 3, MM1, MM2 & MM3 is shown in the Fig. 11, Fig. 12 & Fig. 13.
Fig. 6: MM1 Fig. 7: MM2 Fig.8: MM3
Table – 2
Seismic Analysis Results Of Various Models
RESPONSES MODEL 3 MM 1 MM 2 MM3
Deflection (mm) 101.5 65.97 50.23 45.09 Stress x (N/mm2) 4.14 3.6 1.81 1.63 Stress y (N/mm2) 21.1 14.4 9.2 3.19 Stress xy (N/mm2) 6.8 3.24 2.94 1.51 vonMises stress (N/mm2) 22.1 16.0 12.5 12.1
Fig. 9 & 10:
VI. CONCLUSIONS
The actual section of the Koyna dam was modelled along with its foundation & reservoir and the seismic analysis was carried out. It was found to be unsafe in tension. So, the actual cross section of the Koyna dam is modifiedand the analysis was carried out. The main conclusions are,
Foundation has a significant effect on the stress development of the dam & should be given dueimportance during the analysis of gravity dams.
Actual section of the Koyna dam is safe in compression
Tensile failure is occurring at following areas
Downstream side where change of slope occurs
Upstream face just below the level of reservoir
To prevent failure, the cross section has to be modified.
With the increase in width of the base, the response quantity reduces.
Gentle curve in place of sharp corners prevents the stress concentration.
When the modified model 3 is provided, the section becomes safe in both compression and tension for an earthquake having maximum acceleration of 0.5g.
Fig. 11: Comparison of Deflection Fig. 12: Comparison of Stress Y
Fig. 13: Comparison of Vonmises Stress
REFERENCES
[1] A. K. Chopra and P. Chakrabarti, “The Earthquake Experience at Koyna Dam and Stresses in Concrete Gravity Dams”, Journal of Earthquake Engineering
& Structural Dynamics, Vol. 1, No. 2, pp. 151- 164, 1972.
[2] P. E. Skrikerud and H. Bachmann, “Discrete Crack Modeling for Dynamically Loaded,Unreinforced Concrete Structures”, Journal of Earthquake
Engineering & Structural Dynamics, Vol. 14, No. 2, pp. 297315, 1986.
[3] P. Droz, “ModeleNumerique du Comportement Non-lineaireD'ouvrages Massifs en Beton Non Arme”, Thesis No: 682, Department of Civil,
EcolePolytechniqueFederale de Lausanne, Switzerland, 1987
[4] M. L. Ayari. and V. E. Saouma, “A Fracture Mechanics Based Seismic Analysis of Concrete Gravity Dams Using Discrete Cracks”, Engineering Fracture
Mechanics, Vol. 35, No. 1-3, pp. 587-598, 1990.
[5] Gan Lei and ShenZhenzhong, “Dynamic characteristics analysis and seismic safety evaluation for Madushan Gravity dam”, IEEE, Vol. 12, pp 366-396,
2001.
[6] RajibSarkar, D.K. Paul and L. Stempniewski, “Influence of reservoir and foundation on the nonlinear dynamic response of concrete gravity dams”, Journal
of Earthquake Technology, Vol. 44, pp 377-389, June 2007.
[7] Gaurva Verma, Dr.M.K.Verma, Dr.R.K.Tripathi, “Dynamic Analysis of Hirakud Dam Due to Seismic Forces”, International Journal of Scientific and