(www.dvpublication.com) Volume 2, Issue 2, 2017
60
STRUCTURAL, MECHANICAL, OPTICAL, THERMAL,
ELECTRICAL STUDIES OF A NONLINEAR OPTICAL SINGLE
CRYSTAL: GAMMA GLYCINE USING LITHIUM BROMIDE AS
AN ADDITIVE
K. Lilly Mary Eucharista*, C. Krishnan** & P. Selvarajan***
* Department of Physics, Sri Meenakshi Government Arts College for Women (Autonomous), Madurai, Tamilnadu
** Department of Physics, Arignar Anna College, Aralvoymoli, Tamilnadu *** Department of Physics, Aditanar College of Arts and Science, Tiruchendur, Tamilnadu
Cite This Article: K. Lilly Mary Eucharista, C. Krishnan & P. Selvarajan, “Structural, Mechanical, Optical, Thermal, Electrical Studies of a Nonlinear Optical Single Crystal: Gamma Glycine Using Lithium Bromide as an Additive”, International Journal of Advanced Trends in Engineering and Technology, Volume 2, Issue 2, Page Number 60-70, 2017.
Abstract:
Single crystals of gamma glycine, an organic nonlinear optical material were grown by slow evaporation method from aqueous solutions of lithium bromide. Good optical quality single crystals were grown within a period of 3 weeks. The grown crystals were colorless and transparent. The solubility of the grown crystals has been estimated for various temperatures. The XRD study reveals that the grown crystal crystallizes in the hexagonal crystal system and corresponding lattice parameters were determined.The reflection planes of the sample were confirmed by the powder X-ray diffraction study and diffraction peaks were indexed. Fourier transform infrared (FTIR) study was used to confirm the presence of various functional groups in the grown crystal. The optical spectral analysis of the grown crystal has been performed by UV-Vis-NIR spectroscopy and the band gap energy was found out.Second harmonic generation (SHG) for the materials of this work was confirmed using Nd:YAG laser. The thermal stability of the crystal was studied by thermo gravimetric analysis (TGA) and differential thermal analysis (DTA).The dielectric constant and the dielectric loss were measured for varying frequencies under different temperatures. The impedance measurements were performed as a function of temperature.
Key Words: Crystal Growth, Growth from Solutions, Nonlinear Optical Material & Characterization
1. Introduction:
The synthesis of novel and efficient frequency conversion materials has resulted in the development of semi organic materials, which possess large nonlinearity, high resistance to laser induced damage, low angular sensitivity and good mechanical stability [1, 2]. Amino acids are interesting organic materials for NLO applications as they contain zwitterions, which create hydrogen bonds. Amino acids have two or more types of coordination atoms and can act as various bridging ligands [3, 4].Amino acids and their complexes belong to a family of organic materials that have been considered for photonic applications [5]. Photonic crystals which prohibit the propagation of light for frequencies within a band gap, have enabled exciting new ways to control light and construct integrated optical devices. Glycine is the simplest amino acid. Unlike other amino acids, it has no asymmetric carbon atom and is optically inactive. It has three polymeric crystalline forms α, β and γ [6-8]. The α-form of glycine crystallizes in centrosymmetric structure hence it does not exhibit second harmonic generation, whereas β and γ forms crystallizes in noncentrosymmetric crystal structure. The β- form of glycine is unstable. The γ- form of glycine exhibit second harmonic generation and the conversion efficiency is reported to 1.5 times greater than that of KDP [9]. Some complexes of glycine with inorganic salts are Lithium Sulphate [10], Sodium Nitrate [11], Potassium Sulphate [12], and Zinc Chloride [13] that forms NLOsemiorganic crystals. The present paper deals with the growth of gamma-glycine by slow evaporation technique and characterization by single crystal X-ray Diffraction (XRD), Fourier Transform Infrared (FTIR) spectrum, UV analysis, NLO, Thermal studies and microhardness test.
2. Experimental Methods:
(www.dvpublication.com) Volume 2, Issue 2, 2017
61
for various temperatures. The solubility curve of gamma-glycine is shown in Fig.1. From the curve, it is observed that the solubility of gamma-glycine sample in water linearly increases with temperature, exhibiting a high solubility gradient and positive temperature coefficient.This shows the slow evaporation technique is the appropriate method and the solvent is suitable for the growth of gamma-glycine crystal.
30 32 34 36 38 40 42 44 46 48 50 52
25 30 35 40 45 50 55 60
Solu
bi
lit
y (g
/10
0ml)
Temperature (oC)
Figure 1: Solubility Curve of Gamma- Glycine Crystal
2.2 Crystal Growth: In order to grow single crystal of gamma-glycine in accordance with the solubility data, saturated solution was prepared and it was continuously stirred about two hours to ensure homogeneous concentration and temperature throughout the volume of the solution. Then the solution was filtered using a high quality 4micron Whatmann filter paper to remove extraneous solid colloidal particles.To obtain big single crystals,the bottom seed growth tecnique was adopted.The prepared saturated solution was taken in a beaker and covered by perforated cover for controlled evaporation and kept in a undisturbed condition.The seed crystals of gamma-glycine were obtained by spontaneous nucleation.The supersaturation of the solution was found by observing the first crystal formed at the bottom of the glass beaker due to slow evaporation of the solvent.The super saturated solution of gamma-glycine was transferred into another beaker and kept at room temperature.The defect-free seed crystals were placed in the supersaturated solution and the solution was allowed to evaporate. Good quality of stable, transparent and colorless crystals was harvested within a period of 2 weeks.The size of the grown crystal is 7 x 5 x 3 mm3.The photograph of the grown crystal is displayed in Figure 2.
Figure 2: Photograph of gamma-glycine crystal
3. Characterization Techniques:
(www.dvpublication.com) Volume 2, Issue 2, 2017
62
rcorded in the range of 4000-400cm-1.The gamma-glycine crystal was tested for the microhardness property using a Vickers microhardness tester with diamond indenter.The dielectric constant (εr) and the dielectric loss(tanδ) of gamma-glycine crystal of known dimension were carried out using a precision LCR meter with frequency range of 10 to 100 Hz at different temperatures ranging from 308-373 K. The thermogravimetric analysis and differential thermal analysis (TG/DTA) curves were recorded by employing Perkin Elmer thermal analyzer in nitrogen atmosphere at a heating rate of 10°C/min. and the temperature from 40°C to750°C for the grown crystal.The SHG test for the grown gamma-glycine crystals was performed by the powder technique of Kurtz and Perry[16].Bulk resistance and dc conductivity of the grown crystal were determined from Nyquist plot.
4. Results and Discussion:
4.1 X-Ray Diffraction Studies: Single crystal X-ray diffractometric analysis reveals that gamma-glycine crystal belongs to the hexagonal system which is recognized as non-centrosymmetric and thus satisfying one of the basic and essential requirements for the SHG activity of the crystal.The lattice parameter values are a=b=7.018(3)Å,c=5.471(6)Å, α=β=90o, γ=119.90oand volume=234.3(1)Å3. Powder XRD study was also carried out to check the correctness of the data and to identify the diffraction planes of grown crystal.Powder XRD pattern of gamma-glycine crystal is shown in Fig.3. The sharp Bragg peaks of powder XRD pattern were indexed using the TREOR software package following the procedure of Lipson and Steeple[17].Specific well-defined peaks at 2θ values indicate high crystallinity of the grown crystal.
10 20 30 40 50 60 70 80
0 2000 4000 6000 8000 10000 12000 14000 16000
400
220
003
211
210
201
200
110
111
101
010
100
001
In
te
ns
ity
(c
ps
)
2 (deg)
Figure 3: Powder X-ray diffraction pattern of gamma-glycine crystal
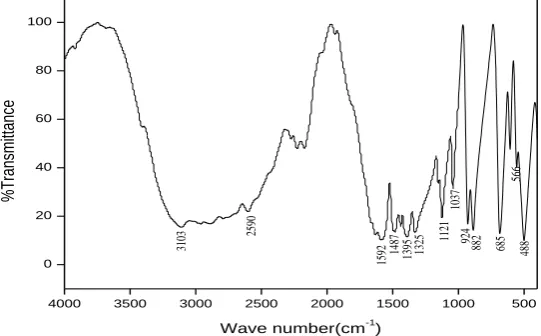
4.2 Fourier Transform Infrared Analysis: The functional groups of gamma-glycine crystals involved in vibration frequency have been identified using FTIR spectroscopy. The grown gamma-glycine FTIR spectrum was taken between wave number 400cm-1 and 4000 cm-1. The recorded spectrum is shown in fig 4
4000 3500 3000 2500 2000 1500 1000 500
0 20 40 60 80 100
566
488
685
882
924
1037
1121
1325
1395
1487
1592
2590
3103
%Tra
nsm
ittan
ce
Wave number(cm-1)
(www.dvpublication.com) Volume 2, Issue 2, 2017
63
Glycine exists as zwitterions in which the carboxyl group present as carboxylate ion and the amino group exist as ammonium ion.Transmission is due to the carboxylate group of free glycine. The stretching type of vibrations of hydrogen bond gives rise to several bands in the region of 3110-2604cm-1 inthe FTIR spectrum.The transmission peaks for the NH3+ group of free glycine are observed at 3175,2614, 1507 and1110cm-1 respectively[18]. In gamma-glycine system, NH3+ group of free glycine are shifted to 3110, 2604, 1592 and 1121 cm-1 respectively. Peak at 2155 cm-1 is due to the combination of NH3+ asymmetric stretching and torsional oscillation. Peaks at 1487, 1374, 1044,938,679 and 496 cm-1 are attributed to CH2, O-O, C-N,CH2,,C-O-O and C-C-O groups respectively.
Table 1: Comparison of FTIR bands of gamma-glycine with Glycine
Wave number (cm-1)
Assignments Glycine Gamma-Glycine
3175 3110 NH3+ stretching
2614 2604 CH stretching
2122 2155 Combination of NH3
+ asymmetric
stretching and torsional oscillation
1507 1592 NH3+ symmetric bending
1445 1487 CH2bending
1333 1374 C-O-O symmetric stretching
1110 1121 NH3+ rocking
1033 1044 C-N stretching
910 938 CH2 rocking
694 679 C-O-O bending
504 496 C-C-O bending
4.3 Optical Property: The transmission range and cut-off wavelength of single crystals are important factors for optical applications.To find the transmission range of gamma-glycine, the optical transmission spectrum of the gamma-glycine for the wavelength between 190 and1100nm was recorded using Perkin Elmer Lambda UV-Vis-NIR spectrometer.The transmittance spectrum of gamma-glycine crystal is shown in Fig.5.
200 400 600 800 1000 1200
0 20 40 60 80 100
%
Tran
smitt
an
ce
Wavelength (nm)
Figure 5: UV-Vis-NIR spectrum of gamma-glycine crystal
1 2 3 4 5 6
0 10 20 30 40
50 E
g = 5.22eV
h
(www.dvpublication.com) Volume 2, Issue 2, 2017
64
1 2 3 4 5 6
0.0 0.5 1.0 1.5 2.0 2.5 3.0
Eg= 4.334
h
h(eV)
Figure 6: Plot of (a) (αhν )2 versus hν giving direct band gap (b) (αhν)1/2versus hν giving indirect band gap The transmission for entire visible region with the lower cut-off wavelength at 241nm suggests that the material is quite suitable for SHG generation and other related optoelectronic applications. The good transmission of the crystal in the entire visible region suggests the suitability of the grown crystal for second harmonic device fabrication [19].
The dependence of optical absorption coefficient on photon energy helps to study the band structure and the type of transition of electrons.The optical absorption coefficient (α) was calculated from transmittance using the following relation,
α = log (1/T) (1) WhereTis the transmittance and d is the thickness of the crystal.
The optical band gap of the gamma-glycine single crystal was determined from the absorption spectrum using the near-band edge absorption relation,
(αhν)n = A(h𝜈 –Eg) (2)
Where A-the optical transition dependent constant, Eg– optical energy band gap, ν – the frequency of incident beam, h- Planck’s constant, n- characterizes thetransition. For direct allowed and forbidden transitions, n=2 and 2/3 respectively, and n=1/2 and 1/3 for indirect allowed and forbidden transitions respectively.
The analysis of equation (2) showed that, n=2 and ½ fitted for the as grown gamma-glycine single crystals sample confirming direct and indirect allowed transition. Figure 6(a) and 6(b) shows the plot of (αhν)2against hν and (αhν)1/2 against hν respectively for gamma-glycine crystals. The intercept of the straight line on the photon energy axis gives the direct band gap value 5.22eV and indirect band gap value 4.334 eV.
4.4 Second Harmonic Generation Test: Second harmonic generation (SHG) is also called a frequency doubling in nonlinear optics in which photons interacting with a nonlinear material are effectively combined to form new study of NLO efficiency has been carried out by modified experimental set up of Kurtz and Perry [20]. The crystal was grind into a homogenous powder and densely packed between two transparent glass micro capillary tubes. An intensity of Nd: YAG laser(λ=1064nm) with input pulse of 1.9mJ was passed through an IR reflector and then directed on the micro crystalline powdered sample packed in a capillary tube.The SHG behavior was confirmed from the output of the laser beam having green light emission. The second harmonic output signal of 50 mV was obtained for gamma-glycine crystal. The output signal obtained for the reference material was 75 mV for the same input pulse of 1.9 mJ. Thus the relative measured output from the sample with respect to KDP crystal shows that SHG efficiency of the gamma-glycine crystal is 0.633 times as that of the KDP crystal. Thus the grown gamma-glycine sample has good NLO property.
(www.dvpublication.com) Volume 2, Issue 2, 2017
65
100g, further increase in load create the cracks on the surface of the crystal due to the release of internal stresses produced by indentation [26].
20 30 40 50 60 70 80 90 100 110 35
40 45 50 55 60 65 70
H
(
kg
/ mm
2)
Load (gm)
Figure 7: Variation of hardness number with load for gamma-glycine crystal
1.56 1.58 1.60 1.62 1.64 1.66 1.68 1.70 1.72 1.74 1.3
1.4 1.5 1.6 1.7 1.8 1.9 2.0
Lo
g
(p
)
Log (d)
Figure 8: Plot of log(P) versus log(d) for gamma-glycine crystal
The relation between the load and size of indentation is given by Mayer’s law P=adn, where n is the work hardening coefficient or Mayer’s index, d is the recovered indentation in mm,a is a constant and P is the load [27]. The plot of log(P) against log(d) is a straight line, which is shown in Fig.8. The slope of the straight line gives the work hardening coefficient(n). The work hardening coefficient for the grown crystal is found to be 4.0723. From careful observations on various material, Onitsch pointed out that for hard materialsn lies between 1 and 1.6 and for soft materials it is above 1.6 [28]. Based on the above fact, it is obvious that gamma-glycine crystal belongs to soft material category.
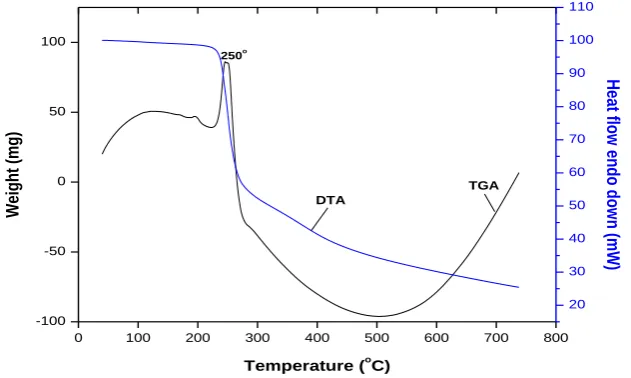
4.6 TG/DTA Analysis: The thermo gravimetric analysis (TGA) and the differential thermal analysis (DTA) give information regarding phase transition and different stages of decomposition of the crystal system [29]. The TG/DTA curves for gamma-glycine crystal were recorded for the range of temperature from 40-750oC in nitrogen atmosphere at the heating rate of 10oC/min using the instrument Perkin Elmer STA 6000 thermal analyzer.The initial mass of the material was taken to be 9.460mg. The thermo gravimetric analysis and differential thermal analysis (TG/DTA) of gamma-glycine crystal are displayed in Fig.9. The sample is stable upto 233oC. The grown crystal gamma-glycine exhibits a single stage of decomposition. The first weight loss occurs at 233oC.The decrease in mass may be due to the thermal decomposition of elements present in the sample.The mass changes in the TG curve are confirmed by DTA peaks shown in figure Fig.9.This shows that the grown crystal is thermally stable and makes it suitable for possible applications in lasers where the crystal is required to withstand high temperatures.
0 100 200 300 400 500 600 700 800
-100 -50 0 50 100
Temperature (oC)
Weig
ht
(mg)
20 30 40 50 60 70 80 90 100 110
250o
TGA DTA
Heat
fl
ow
en
do
d
ow
n
(mW)
(www.dvpublication.com) Volume 2, Issue 2, 2017
66
4.7 Dielectric Studies: Crystals with high transparency and large defect-free size were selected and used for the dielectric measurements. The dielectric constant (εr) and the dielectric loss (tan δ) were measured for varying frequencies (102 -106 Hz) under different temperatures (35-100oC). The observations were made while cooling the samples. The values of dielectricconstant (ԑr)and the dielectric loss (tanδ) are found to be increases with increase in temperature and decreases with increase in frequency(Fig.10 and 11).This can be explained on the basis of polarizationand conduction processes.The high values of dielectric constant at low frequencies may be due to the presence of all the four polarizations namely space charge,oriental,ionic and electronic polarizations and its low value at high frequencies may be due to the loss of all these polarizations.It is observed that space charge polarization is dominant and electronic and ionic polarizations are not very much active in low frequency region[30, 31].The low value of dielectric loss (tan δ) at high frequency reveals the high optical quality of the crystals with lesser defects, which is the desirable property for NLO applications [32].
2.0 2.5 3.0 3.5 4.0 4.5 5.0 10
20 30 40 50 60 70 80
Diele
ct
ric Con
st
an
t
r
log (f)
373 K 353 K 343 K 333 K 323 K 308 K
Figure 10: Variation of dielectric constant with frequency for gamma-glycine crystal
2.0 2.5 3.0 3.5 4.0 4.5 5.0 0.2
0.3 0.4 0.5 0.6 0.7 0.8 0.9
Diele
ct
ric L
os
s (
ta
n
)
log (f)
373 K 353 K 333 K 323 K 308 K
Figure 11: Variation of dielectric loss with frequency for gamma-glycine crystal
The increase in dielectric constant (ԑr) with temperature is generally attributed to crystal expansion, electronic and ionic polarizations and the presence of crystal defects [33, 34].
(www.dvpublication.com) Volume 2, Issue 2, 2017
67
Figure 12: SEM image of gamma-glycine crystal
The crystalline or chemical composition of the grown crystal was examined by energy dispersive X-ray analysis (EDAX) spectrometer. The EDAX spectrum is resulting from the electron back scattering. Further the obtained spectrum of energy versus relative counts of the X-rays gives the qualitative and quantitative information about the elements present in the testing sample. Fig.13. shows the EDAX spectrum of gamma-glycine. The weight percentages of O and Br as obtained from EDAX analysis are given in table 2.
Figure 13: EDAX Spectrum of gamma-glycine crystal Table 2: EDAX Quantification table
Element Weight % Atomic %
O K 42.32 78.56
Br L 57.68 21.44
Total 100 100
4.9 Impedance Analysis: Complex impedance spectroscopy is a powerful technique to investigate the electrical properties and process of the materials. This technique is based on analyzing the ac response of a system to a sinusoidal perturbation, and subsequent calculation of impedance and related parameters as a function of frequency of the perturbation. The motion of charges could occurs dipole reorientation, space charge formalism and charge displacement. The impedance measurements on a material give us data having both resistive (real part) and reactive (imaginary part) components. The frequency dependent properties (electrical properties) of a material are often represented in terms of complex impedance Z* and which is related as
Z* (ω) =Z’- jZ”
where Z’ and Z” are the real and imaginary components of impedance. The complex impedance of the electrode/insulator/electrode capacitor can be demonstrated as the sum of the single RC circuit with parallel combination. In this work, the measurements on impedance of the grown gamma-glycine crystals were carried out using an impedance analyzer (Model: IM 6 ZAHNER/Germany-Electrochemical Workstation) to find the impedance, bulk resistance, grain boundary resistance, DC conductivity and relaxation time of the samples.
The variation of real part of impedance (Z’) and the imaginary part of impedance (Z”) with frequencies at temperatures 30, 50, 70 and 900C are shown in figures 14 and 15.
(www.dvpublication.com) Volume 2, Issue 2, 2017
68
Fig.15. shows the variation of imaginary part of impedance (Z”) with frequency at different temperatures. This plot is suitable for evaluation of the relaxation frequency of most resistive contribution. The relaxation frequency can be obtained either from the plot of Z” against frequency or semicircles from the Nyquist plot. The peak broadening on increasing temperature suggests the presence of temperature dependent relaxation processes in the compound [36]. The relaxation process may be due to the presence of immobile species at low temperature and defects at higher temperature.
0 1 2 3 4 5
0 20000 40000 60000 80000 Z'(koh m) logf
300C 500C 700C 900C
Figure 14: Variation of real part of impedance (Z’) as a function of frequency for gamma-glycine crystal
0 1 2 3 4 5
0 1 2 3 4 5 6 7 8 9 10 11 12 13 14 15 16 17 18 Z"(ko hm ) log(f)
500C
300C
700C
900C
Figure 15: Variation of imaginary part of impedance (Z”) as a function of frequency for gamma-glycine
crystal
Fig.16. shows the Nyquist plot (complex impedance spectrum) of gamma-glycine crystal at different temperatures and this graph explains the transport response function. From the graph, one partial semicircular arc has been observed and this depicts the bulk effect. This bulk effect arises due to the parallel combination of bulk resistance (Rb). The value of bulk resistance (Rb) at different temperatures has been obtained from the intercept of the semicircular arc on the real axis (Z’).These values are given in table 3.From fig.16. It is clear that the value of Rb decreases with rise in temperature. This shows the negative temperature coefficient of resistivity (NTCR) behavior like that of a semiconductor.
0 20 40 60 80
4 6 8 10 12 14 16 18 Z"(k oh m) Z'(k ohm)
300C 500C
0 1 2 3 4 5 6 7
0.0 0.2 0.4 0.6 0.8 1.0 1.2 1.4 1.6 1.8 2.0 Z"(k oh m) Z'(k ohm) 700C
900 C
Figure 16: a) Nyquist plot for gamma-glycine crystal (30˚ &50˚) b) Nyquist plot for gamma-glycine crystal (70˚ & 90˚)
Table 3: The value of bulk resistance of gamma-glycine crystal
Temperature (oC) Bulk resistance Rb(kΩ)
30 51.05
50 25.23
70 6.248
(www.dvpublication.com) Volume 2, Issue 2, 2017
69
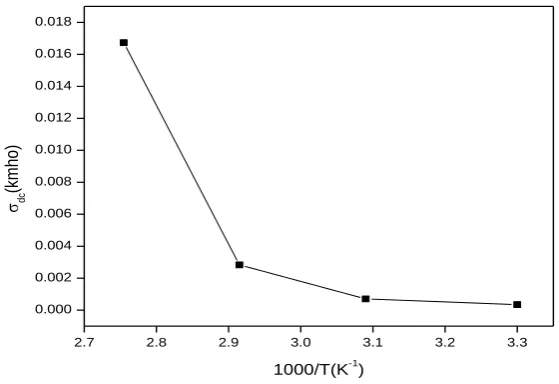
The dc conductivity (ζdc) of the crystal is calculated using the formula ζdc =d/RbA
Where A is the area of crystal surface and d is the thickness of the crystal. It is observed that the dc conductivity increases with temperature.Fig.17.shows the variation of ζdc against 103/T. The value of bulk conductivity of the material is evaluated from the complex impedance plots of the sample at different temperatures. At higher temperature, the conductivity versus temperature response is more or less a straight line and can be explained by a thermally activated transport of Arrhenius type: ζdc =ζ0exp(-Ea/kBT) ,where ζ0, Ea and kB represent the pre-exponential term, the activation energy of the mobile charge carriers and Boltzmann’s constant, respectively. At lower temperature, a small deviation from the linear behavior of conductivity has been noticed and can be attributed to Mott’s hopping type phenomena [37]. The dc activation energy of the material has been estimated to 0.002333eV.
2.7 2.8 2.9 3.0 3.1 3.2 3.3
0.000 0.002 0.004 0.006 0.008 0.010 0.012 0.014 0.016 0.018
dc
(km
ho
)
1000/T(K-1)
Figure 17: Variation of dc conductivity with inverse of temperature
5. Conclusion:
Optically good quality single crystal of gamma-glycine of size 7 x 5 x 3 mm3 has been grown by slow evaporation technique at room temperature. The solubility of gamma-glycine crystal was estimated for water solvent at different temperatures. Single crystal XRD confirmed that the grown crystal belongs to the hexagonal system.The functional groups present in the crystal are confirmed by FTIR analysis.The optical transmittance spectral studies confirm that the crystals have very good transmittance in the entire visible region, with the lower UV cut-off around 241nm.The powder SHG test confirms that the efficiency of gamma-glycine is nearly 0.633 times as that of KDP crystals.Vickersmicro hardness value was calculated in order to understand the mechanical stability of the grown crystal.The thermal behavior of the crystals has been investigated by TGAandDTA analysis.The dielectric studies prove that the sample has low dielectric constant and dielectric loss values at high frequency. The real and imaginary parts of the impedance are found to be decreasing with increase of frequency for glycine crystal. From the Nyquist plot, the dc conductivity of the gamma-glycine crystal was calculated. The nonlinearity, transparency and thermal stabilities make this crystal suitable for SHG andopto-electronic device applications.
6. Acknowledgments:
The authors are thankful to the supported work from the various research centers such as St.Joseph College (Trichy), M.K. University (Madurai), SAIF (Cochin), IISc (Bangalore).The authors are also grateful to the management of S.T. Hindu College,Nagercoil,Arignar Anna College, Aralvoymoli and the staff members of Sri Meenakshi Govt.Arts College for Women, Madurai.
7. References:
1. H.O. Marcy, L.F. Warren, M.S. Webb, C.A. Ebbers, S.P. Velsko, G.C. Kennedy, Appl.Opt., 1992, 31, 5051-5060.
2. S. Ledoux, J. Zyss, J. Int., Nonlinear Opt. Phys., 1994, 3, 287-316.
3. Y. Yukawa, Y. Inomata, T. Takeuchi, Bull.Chem. Soc. Jpn. 1983, 56, 2125-2128.
4. Y. Yukawa, N. Yasukawa, Y. Inomata, T.T akeuchi, Bull. Chem. Soc. Jpn., 1985, 58, 1591-1592. 5. B. Narayana Moolya, A. Jayaramo, M. R. Suresh Kumar, S. M. Dharmaprakash, J. Crystal growth 280
(2005) 581-590.
6. J. P. Legros, A. Kvick, Acta Crystallogr. B 36 (1980) 3052-3062.
(www.dvpublication.com) Volume 2, Issue 2, 2017
70
8. L. J. W. Shimon, M. Lahav, L. Leiserowitz, New J. Chem 10 (1986) 723.
9. B. Narayana Moolya, A. Jayaramo, M. R. Suresh Kumar, S. M. Dharmaprakash, J. Crystal growth 280 (2005) 581-590.
10. T. Balakrishnan, K. Ramamurthi, Cryst. Res. Technol. 2006, 41, 1184-1188. 11. M. Narayan Bhat, S.M. Dharmaprakash, J. Cryst Growth., 2002, 235, 511-516.
12. Ra. Shanmugavadivu, G. Ravi, A. Nixon Azariah, J. Phys. Chem. Solids.2006, 67, 1858- 1861. 13. T. Balakrishnan, K. Ramamurthi, Mater. Lett, 2008, 62, 65-68.
14. P. Selvarajan, J. Glorium, Arul Raj, S. Perumal, J. Cryst. Growth, 31(2009)3835-3840.
15. A. Shanthi, C. Krishnan, P. Selvarajan, Spectrochimica Acta Part A: Molecular and Bio molecular Spectroscopy 122 (2014) 521 – 528.
16. S. K. Kurtz, T. T. Perry, J. Appl. Phys, 39(1968)3798-3814.
17. H. Lipson, H. Steeple, Interpretation of X-Ray Powder Diffraction patterns, fifth ed. Macmillan, New York, 1970.
18. R. Sankar, C. M. Ragahvan, R. Mohan Kumar, R. Jayavel, J. Cryst Growth., 309 (2007) 30 - 36. 19. N. Vijayan, R. Ramesh Babu, R. Gopalakrishnan, S. Dhanushkodi, P. Ramasamy, J. Cryst. Growth,
236, 407 (2010).
20. S. G. Regith, C.Krishnan, Mater. Lett. 106 (2013) 87 – 89.
21. J. H. Westbrook, Report 58- RL-2033 of the G.E.Research Laboratory, USA, 1958. 22. W. Mott, Micro Indentation hardness Testing, Butterworth, London, 1956.
23. P. V. Raja Shekar, D. Nagaraju, V. Ganesh, K. Krishna Rao, Cryst. Res. Technol, 44 (2009) 652-656. 24. J. Mary Linet, S. Jerome Das, Physica B 405(2010)3955- 3959.
25. B. Helina, P. Selvarajan, A. S. J. Lucia Rose, Phys. Scripta, 85 (2012) 055803-055808. 26. J. B. Charles, F. D, Gnanam, J. Matter. Sci. 29 (1993) 1395-1397.
27. E. Mayer, Z. Phys. 9(1908)66-74.
28. E. M. Onitsch, Mikroscopia, 2(1947) 131-151.
29. F. Q. Meng, M. K. L U, Z. H. Yang and H. Zeng, Matter. Lett. 33 (1998) 265. 30. P. Selvarajan, B. N. Das, H. B. Gon, K. V. Rao, J. Matter Sci, 29(1994) 4061-4064.
31. N. V. Prasad, G. Prasad, T. Bhimasankaran, S. V. Suryanarayana, G. S. Kumar, Indian J. Pure Appl. Phys, 34 (1996) 639-643.
32. C. Balarew, R. Dushlew, J. Solid State Chem, 55 (1984) 1 - 6. 33. K. V. Rao, A. Samukula, J. Appl. Phys, 36(1995)2031-2038.
34. A. S. J. Lucia Rose, P. Selvarajan, S. Perumal, Spectrochimica Acta Part A 81(2011)270-275. 35. J. Plocharski, W. Wieczoreck, Solid State Ionics 28-30 (1988) 979-982.
36. A. K. Jonscher, Nature 267 (1977) 673-679.