Page 199 www.ijiras.com | Email: [email protected]
Nutritional Status Of Elderly Persons: A Comparison Between
Institutionalized And Non – Institutionalized Elderly Persons In
Nairobi City County, In Kenya
Dr. Judy W. Mugo
Department of Population and Reproductive Health School of Public Health, Kenyatta University, Nairobi,
Kenya
Prof. Judith N. Waudo
Department of Food, Nutrition and Dietetics, School of Applied Human Sciences, Kenyatta University,
Nairobi, Kenya
Prof. Vincent Onywera
Department of Recreation Management and Exercise Science, School of Applied Human Sciences
Kenyatta University, Nairobi, Kenya
Dr. Ochieng George Otieno
Department of Health management and Informatics School of Public Health, Kenyatta University, Nairobi,
Kenya
I. INTRODUCTION
The population of older persons is increasing at a very rapid rate, all over in the world. It was about 200 million in 1950, rose to 606 million in the year 2000 and is projected to reach 1.2 and 2.0 billion in 2025 and 2050 respectively. In Africa, the population of older persons, 60 years and above is currently estimated to be 42 million and is projected to reach between 205 to 212 million by the year 2050. One of the biggest increases in population ageing in Africa is expected to
occur in Kenya where it is projected that by 2050, there will be a 470% increase in the number of older persons who will represent approximately 10% of the Kenyan population (1). Malnutrition poses a huge economic cost to society. The malnourished elderly are more likely to require health and social services, have more hospitalizations, and cause a burden on caregivers. Without comprehensive and coherent frameworks guiding nutrition of the old in Kenya, substantial resources and efforts continue to be wasted (2). Despite significant medical advances, under nutrition among the Abstract: Malnutrition has been recognized as a common problem among the elderly persons and is associated with certain diseases and impaired functioning. Little is known about Nutritional Intake and Nutritional care among the Elderly Persons. This study determined the nutritional status of the Institutionalized elderly Persons and compared with that of the elderly Persons Living in non-institutions. The MNA questionnaire was used to measure the Nutritional Status of the Elderly Persons. Two hundred and seventy elderly men and women who met the inclusion criteria were sampled, 135 from 4 Institutions and 135 from Non-Institutions. Data were coded and entered using EPI Info version 9 and were
analyzed using SPSS version 17. There was a significant relationship between gender and MUAC (2 = 12.745, df = 2, p =
0.002) with the mean MUAC measure among women (0.77 4.13) being higher than that of men (0.75 0.388), t = 4.446, df = 268, p = 0.714. There was a significant relationship between the place of residence and self-view of nutritional status by the elderly (χ2 =6.737, df = 2, p=0.034) with those in the non-institution having a better self-view of their nutritional status. These findings will lighten the social protection burden of the elderly, a move in tandem with African modern socialization from Socialistic to Individualistic societies, fueled by migration and urbanization by young employable persons in economic pursuit as well as reduce on disease burden among the elderly.
Page 200 www.ijiras.com | Email: [email protected] elderly remains a significant and highly prevalent public
health problem of developing countries. The overall prevalence is 22.6%. Nearly 40% of hospitalized elderly and 50% of those in rehabilitation facilities are malnourished, and 86% are either malnourished or at risk for malnutrition. Up to 67% of elderly in nursing homes are malnourished or at risk for malnutrition (2).
II. MATERIALS AND METHODS
THE STUDY DESIGN
The study adopted a Comparative Cross Sectional Study Design in determining the Body Mass Index, Intake of Protein Markers, Mode of feeding, Opinion on Nutrition and Health status, Number of meals consumed, Fluid Intake, Consumption of 3 or more prescription drugs and Appetite and Weight Loss among the Elderly Persons.
STUDY POPULATION
In line with the UN definition of Older Persons (3), the study population comprised of both men and women aged 60 years and above. The respondents age was determined by use of their National Identity cards in which their date of birth is stated and the care-givers. For the elderly persons who could not remember and did not have their National Identity cards, their date of birth was deduced from dates of important historical and social events as applied by the Registrar of births and deaths in Kenya (1).
INCLUSION AND EXCLUSION CRITERIA
The study included elderly men and women aged 60 and above years living in 4 Institutions of the elderly and Non-Institutions in four divisions in Nairobi City County, who had lived in the Institution or with their family members for the last one year. It excluded subjects with cancer, end-age renal disease/terminal illnesses, those receiving Artificial/Parenteral nutrition, cognitive impairment and those attending day care centers of the elderly.
SAMPLING TECHNIQUE
This study did a census of four institutions of the elderly who consented to participate in the study. The Institutions management provided a list of the elderly persons in their Institutions which was used to purposefully identify those who did not meet the Inclusion criteria and eliminate them from the list of potential respondents. Proportionate to size sampling was done in each of the four Institutions of the elderly and a sample of 57 respondents was achieved for Mji wa Huruma in Runda, 11 for Nyumba ya Wazee in Ruaraka, 42 in the Kariobangi Cheshire home and 25 in Mother Teresa home in Huruma. Every 4th elderly person in each of the remaining Institutions list was systematically sampled. Purposeful and Convenient sampling techniques were used to sample Social welfare officers in each of the sampled Institutions (4).
For the Non-institutionalized elderly persons, a list of elderly persons living in Huruma, Kariobangi North, Kawangware and Gumba divisions was obtained with the assistance of Social Workers and Community health volunteers from the respective chiefs. In order to ascertain if the elderly persons met the inclusion criteria, a brief interview was done in the household with either the elderly person or their care-giver. Thirty four elderly Persons were sampled from each of the four divisions and where 2 or more elderly persons were residing in one household, the older elderly person would be conveniently sampled (5).
LOGISTICAL AND ETHICAL CONSIDERATIONS
Prior to the study, approval was sought from Kenyatta University Ethical Clearance Committee (KU/R/COMM/51/167) and research Authorization sought from the National Council for Science, Technology and Innovation (NACOSTI) (NCST/RCD/14/013/299). All participants were informed about the objectives of the study and informed consent was obtained before the non-Institution and Institutions interviews and taking the anthropometric measurements. Participants were informed about their right to discontinue his/her participation from the study at any point of data collection. Informed consent was also sought from the elderly and their care –givers, both at Non-institutions and in Institutions and confidentiality was maintained on all the information and data collected. Nutritional and health counseling was given to all the elderly participants and the care-givers of those who were found to be malnourished or at risk of malnutrition with an aim of improving their Nutritional status.
STRENGTHS AND WEAKNESSES OF THE STUDY
The weaknesses of the study stem from the fact that the respondents participating in the study were all drawn from Nairobi County and were therefore not representative of the whole country. The Inclusion and the Exclusion Criteria was based on the elderly persons subjective reporting of their health conditions. The strengths of the Study were that data was collected by use of the Modified Barthel Index and the Mini Nutritional assessment tools, Standard Universal tools whose validity and Reliability has been tried and tested. These tools were Pre-tested in the Thogoto home for the aged and the Kikuyu town Surbabs after which they were reviewed and domesticated to the Kenyan Context.
ITEMS OF INVESTIGATION
Page 201 www.ijiras.com | Email: [email protected] DATA COLLECTION
Nutritional status was assessed using the Mini Nutritional Assessment (MNA), which is a generic way of estimating the ratio of lean body mass to fat percentage in the body. The complete MNA includes 18 items and the score distribution is between 0 (zero) and 30. A score less than 17 points indicates malnutrition; scores between 17 and 23.5 indicate „at risk of malnutrition‟, and a score _24 indicates a well-nourished state. However for the elderly who were not able to stand on the bathroom scale, their BMI was established by the use of MUAC, where a MUAC < 23.5 cm is likely to have a BMI of < 20 kg/m2 and if the MUAC measure was less than 32.0 cm, the BMI was likely to be > 30 kg/m2 (6)
DATA ANALYSIS
Descriptive analyses were performed to report the distribution of the data and presented as frequencies and percentages n (%), and discrete and continuous data presented as mean. Univariate tests of differences between the nutritional status and residence of the elderly were perfomed using Pearson‟s ²-test and independent t-tests.
III. RESULTS AND DISCUSSION
CHARACTERISTICS OF ELDERLY PERSONS IN NAIROBI COUNTY
The total number of respondents was 270. One hundred and thirty five (50%) of the participants were living in non-institutions whereas 135 (50%) were living in non-institutions of the elderly. Majority of the participants 140 (51.7%) were female. The youngest elderly was aged 60 years and the oldest 113 years. The mean age was 70.53 11.336. The average height of the elderly was 157.31 11.211cm and an average weight of 52.904 8.064. There was no significant relationship between age, gender and place of residence (χ2 = 2.394, df = 4, p= 0.664; χ2 =6.432, df = 4, p= 0.169) respectively. According to the National Council for Population and Development, the life expectancy of all the elderly has been rising for females, with a woman who reaches the age of 55 expecting to live for another 24 years. However the male pattern rose and begun to decline (7). A similar study carried out in Venezuela found that the average age of the institutionalized group was 77.3+/- 7.5 years old and 69.5+/- 7.6 years old for the free-living elderly group (8).
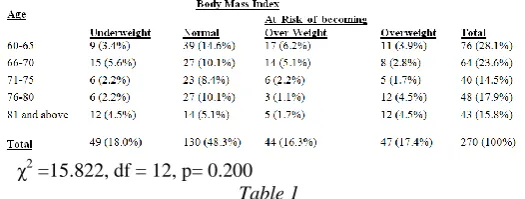
Body Mass Index by Age of the Elderly
χ2 =15.822, df = 12, p= 0.200 Table 1
There were more women (41.7%) at risk of being overweight compared to men (23.8%). Only 9.5% of the men
were underweight, compared to 16.7% of women who were found to be underweight. The results showed that there was no significant relationship between the BMI and gender (χ2 =1.958, df = 3, p= 0.581)
The majority of the elderly both at Institutions and Non-institutions were of a normal BMI (46.3%) and only 17.7% were overweight, with 20.5% of the elderly in Non-institutions being overweight. There was no relationship between BMI and institutionalization of the elderly (χ2 = 1.831, df = 3, p= 0.608). %). The elderly develop malnutrition due to a number of factors. These factors make the elderly vulnerable and susceptible to malnutrition as a result of decreased physical, psychological and or social functions (2). The risk of the elderly suffering from malnutrition is low in healthy elderly persons and it is therefore important to have the elderly nutritional status regularly monitored (8).
Body Mass Index and Protein Intake Markers Body Mass Index
t = 8.663, df = 268, p = < 0.001
Table 2: Body Mass index and Protein Intake markers of the Institutionalized and Non-institutionalized Elderly Persons
The underweight phenomena among the elderly could be attributed to eating difficulties, difficulties in chewing due to poor dental status as well as dry mouth, red mucus membranes and oral sores which can greatly affect eating and the nutritional status of elderly people (9). More women (41.70%) were at risk of being overweight, compared to men (23.8%). This could be because there is a tendency among the elderly to gain fat mass, which increases the risk of obesity, cardiovascular disease and Non insulin dependent Diabetes. Only 9.5% of the elderly men were underweight, compared to 16.7% of women who were found to be underweight. Majority (46.3%) of the elderly were of a normal BMI. These results are similar to the research findings of Guigoz in 2006 who found that among the community – dwelling elderly people in Sweden, the prevalence of malnutrition was only 2%, compared to the Institutionalized elderly people who had 21% prevalence of malnutrition (10).
PROTEIN INTAKE
Page 202 www.ijiras.com | Email: [email protected] ADLs and general body strength (11). There was a significant
relationship between the residence of the elderly and intake of proteins. Concerns about the detrimental effects likely to result from increased consumption of proteins such as poor bone health, renal function, cardiovascular function and neurological function are unfounded. Intake of 1.5 g of protein/kg/day or 15-20% of the total caloric intake by the elderly is ideal for those elderly who may wish to improve on their health and function levels (12).
MODE OF FEEDING AND RESIDENCE OF THE ELDERLY PERSONS
Majority of the elderly were able to feed themselves without any problem (72.4%) while only 6.7% were unable to feed without assistance. The institutions of the elderly had the lowest number of elderly who were unable to feed without assistance. There was no significant relationship between the mode of feeding and the residence of the elderly (χ2 =.157, df = 2, p= 0.925). The elderly living in institutions of the elderly who were underweight and had difficulties in feeding themselves accounted for 60.2%. These may be the elderly who did not receive enough assistance during mealtimes and about one-third of these elderly leave more than two-thirds of their meals un consumed (13). The significant relationship between age and mode of feeding could be attributed to the degenerative effects of aging, where the more elderly one got, the more dependent they are likely to become. These could further be explained by the variations that occurred between age and mode of feeding (13).
χ2=0.639, df = 3, p= 0.887
Table 3: Opinion of the elderly Persons on their Nutritional and Health status
There was a significant relationship between the place of residence and self-view of nutritional status by the elderly (χ2 =6.737, df = 2, p=0.034) with those in the Non-institution having a better self-view of their nutritional status by a mean of 1.23 ± 0.828 compared to 1.01 ± 0.787 in the institution, t = 1.984, df = 268, p = 0.048. Self-perception of health status and the BMI was correlated and the highest population of elderly in institutions (47.4%) who were found to be at risk of becoming over weight reported to view their health status as being better than that of their colleagues in the Institutions. About 15.8% of those at risk of being overweight felt that they were not as good. There were no elderly overweight elderly in the Institution who thought that they had better health status than their colleagues. More women (37.6%) than men (29.7%) felt that their health status was not as good compared to other elderly people. There was no significant relationship between
self-views of health status and gender or between self-view of health status and place of residence. In a similar study conducted by Bales in 2009, more than half of the participants, (54% n=314) perceived themselves as healthy, 50% (n=139) among women and 57.8% (n=175) among men. Both similarities and differences were found in women‟s and men‟s self perceived health. Irrespective of how they perceived their health, no cognitive impairment was found among women or men (14)
NUMBER OF MEALS CONSUMED
The mean number of meals consumed by the Institutionalized elderly (1.88 ± .325) was higher than that of the elderly in Non-institutions (1.49 ± 0.603), t = 6.370, df = 268, p < 0.001.
Figure 1: Number of Meals Consumed by Residence of the elderly Persons
More males (73.2%) were able to consume at least three meals per day compared to 69.8% of the women. There was no significant relationship between the two genders. There was a significant relationship between the number of meals consumed and the place of residence of the elderly. Ortega et al., 1998 (15) found that women subjects who took 2-3 meals per day showed greater body mass indices and a greater proportion were overweight/obese compared to those who took 4-5 meals per day. This could be because reported energy intakes tend to be lower than the measured intakes (11).
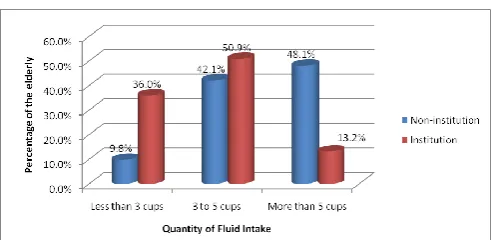
FLUID INTAKE BY RESIDENCE OF THE ELDERLY
Figure 2: Fluid Intake by Residence of the Elderly Persons
Page 203 www.ijiras.com | Email: [email protected] and therefore not able to spend appropriate time with each
elderly in order to assist in eating and drinking during the mealtimes (16). Simple measures such as opening the bottle for the elderly or drawing drinking water for them into a cup or a glass can affect the health of the resident elderly.
CONSUMPTION OF MORE THAN 3 PRESCRIPTION DRUGS BY RESIDENCE OF THE ELDERLY PERSONS
Figure 3: Consumption of more than 3 Prescription Drugs by Residence of the Elderly
There was no significant association between taking more than 3 prescription drugs and the residence of the elderly. The consumption of medication may lead to distortion in the way nutrients are absorbed, digested and expelled from the body. This may lead to changes in food choices and malnutrition (17). A similar study conducted by Saeidlou et al., in 2011 indicated that older people in institutions who take an average of 3 or more different medications a day have a higher risk of malnutrition. This is because medications like anticonvulsants, diuretics, and antidepressants may change taste perception (18). Bischoff-Ferrari et al., 2009 reported that a lot of medications are known to affect directly the sense of smell and taste. Some of these medications include calcium channel blockers, lipid-lowering drugs and anti-inflammatory drugs (19).
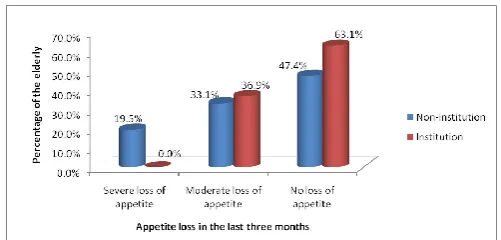
APPETITE LOSS IN THE LAST THREE MONTHS BY RESIDENCE OF THE ELDERLY PERSONS
Figure 4: Appetite Loss in the last three months by Residence of the Elderly Persons
There was a significant relationship between loss of appetite and gender of the elderly (χ2 =6.98, df= 2, p=0.030) with more males reporting decline in food intake compared to the women. The mean decline in food intake by men was 1.55 ± 0.652, while that of women was 1.36 ± 0.674, t = 2.230, df = 268, p = 0.027. Majority of the elderly had no decline in food intake in the last three months. The majority of these (63.5%)
were men compared to 47.4% of the women. This decrease in food intake could be due to changes in taste thresholds and decreasing of olfaction, leading to decreased food intake in the elderly (20). Eight point seven percent of the men had severe loss of appetite in the last three months compared to 10.9% of the women.
Figure 5: Weight Loss in the last three Months by Residence of the Elderly Persons
There was a significant relationship between weight loss in the last three months and the type of residence for the elderly (χ2 = 9.175, df = 3, p= 0.027), with the elderly in the institutions having lost more weight (1.84 ± 1.007) compared to the non-institutionalized elderly (1.75 ± 1.094), t = 0.669, df = 268, p = 0.504. Weight loss among the elderly is the gold standard measure of a nutritional problem in the aging population. A weight loss of 5% in any period up to a year is a clear indication of a problem, which could be poor nutrient intake or absorption, age –related loss of muscle mass (Sarcopenia), severe Osteoporosis, loss of fat and muscle mass (Cachexia) and dehydration (11). More males (39.2%) reported to have had no weight loss in the last three months compared to 33.9% of the women. However, it was more males (12.8%) who reported greater weight loss (greater than 3 kg) compared to 7.9% of women. There was no significant relationship between weight loss in the last three months and the gender of the elderly.
It may take longer to reverse weight loss and achieve weight gain among the elderly than it would among younger people. This is because ageing may change the metabolic response to any kind of nutritional treatment that may be given. Another challenge is as a result of the multifactorial causes of malnutrition which makes individual elderly not respond in the same way to nutritional treatment (21).
IV. CONCLUSION
Page 204 www.ijiras.com | Email: [email protected] consumed in the Non-institutions. The mean fluid intake in a
Non-institution was higher than in the Institutions. A higher number of elderly persons living in the Institutions were not taking 3 or more prescription drugs compared to 27.8% of the Non-institutions. The mean decline in food intake by men was higher than that of women. The elderly in the institutions reported more weight loss than those in the Non-institutions.
ACKNOWLEDGEMENT
I would like to acknowledge the important role and assistance accorded to me by my family, research assistants, the elderly persons who participated in the study and their care-givers as well as the management of Mji wa Huruma home for the elderly, Kariobangi Cheshire, Nyumba ya Wazee and Mother Teresa homes of the elderly. May the Lord bless you all. Finally I would like to thank the National Council for Science, Technology, Innovation (NACOSTI) and the German Academic Exchange Service (DAAD), for sponsoring this entire work.
CONFLICT OF INTEREST
The authors declare that “there is no conflict of interest regarding the publication of this article.”
REFERENCES
[1] Kenya National Commission on Human Rights (2007). Growing old in Kenya: Making it a positive experience. Nairobi: KNCHR.
[2] Cheserek, M. J., Tuitoek, P. J., Waudo, J. N., Msuya, J. M., & Kikafunda, J. K. (2012). Anthropometric characteristics and nutritional status of older adults in the Lake Victoria Basin of East Africa: region, sex, and age differences. South African Journal of Clinical Nutrition, 25(2), 67-72.
[3] DeSA, U. N. (2013). World population prospects: the 2012 revision. Population Division of the Department of Economic and Social Affairs of the United Nations Secretariat, New York.
[4] Government of Kenya (2009). Kenya Policy Draft on Older Persons and Aging
[5] Kothari, C. R. (2004). Research methodology: Methods and techniques. New Age International.
[6] Who, J., & Consultation, F. E. (2003). Diet, nutrition and the prevention of chronic diseases. World Health Organ Tech Rep Ser, 916(i-viii).
[7] National Coordinating Agency for Population and Development (NCAPD). 2011. State of Kenya Population 2011. Kenya‟s 41 Million People: Challenges and Possibilities.
[8] Díaz N, Meertens L, Solano L, Peña E (2005) Nutritional characterization by anthropometrics of institutionalized and non-institutionalized elderly Venezuelan.
[9] Morley, J. E. (2002). Nutrition in the elderly. Current opinion in gastroenterology, 18(2), 240-245.
[10]Johansson, Y. (2009). Self-perceived health and nutritional status among home-living older people: a prospective study (Doctoral dissertation, Linköping University Electronic Press).
[11]World Health Organization. (2002). Keep fit for life: meeting the nutritional needs of older persons. In Keep fit for life: meeting the nutritional needs of older persons.. World Health Organization.
[12]Wolfe, R. R., Miller, S. L., & Miller, K. B. (2008). Optimal protein intake in the elderly. Clinical nutrition, 27(5), 675-684.
[13]Xia, C., & McCutcheon, H. (2006). Mealtimes in hospital–who does what?. Journal of clinical nursing, 15(10), 1221-1227.
[14]Bales, C. W., & Ritchie, C. S. (Eds.). (2009). Handbook of clinical nutrition and aging. New York, NY, USA:: Humana Press.
[15]Ortega, R. M., Redondo, M. R., Zamora, M. J., Lopez-Sobaler, A. M., Quintas, M. E., Andres, P., ... & Requejo, A. M. (1997). Relationship between the number of daily meals and the energy and nutrient intake in the elderly. Effect on various cardiovascular risk factors. Nutricion hospitalaria, 13(4), 186-192.
[16]Garcia, M. E. (2001). Dehydration of the elderly in nursing homes. Nutrition Noteworthy, 4(1).
[17]Brownie, S. (2006). Why are elderly individuals at risk of nutritional deficiency?. International journal of nursing practice, 12(2), 110-118.
[18]Saeidlou, S. N., Merdol, T. K., Mikaili, P., & Bektaş, Y. (2011). Assessment of the nutritional status and affecting factors of elderly people living at six nursing home in Urmia, Iran. International Journal of Academic Research, 3(1), 173-181.
[19]Bischoff-Ferrari, H. A., Dawson-Hughes, B., Staehelin, H. B., Orav, J. E., Stuck, A. E., Theiler, R., ... & Henschkowski, J. (2009). Fall prevention with supplemental and active forms of vitamin D: a meta-analysis of randomised controlled trials. Bmj, 339, b3692. [20]Rolls, B. J. (1999). Do chemosensory changes influence
food intake in the elderly?. Physiology & behavior, 66(2), 193-197.