138703-2525-IJET-IJENS © June 2013 IJENS I J E N S
Abstract---- A waveguide irradiation system is a convenient way of investigating interaction of biological bodies or specimens inside their surrounding host materials, with microwave fields. Such a system can be used in a number of applications, such as irradiation of insects inside host bodies, investigation of tumor treatment inside healthy or infected tissues, and the like. This paper describes how finite difference time domain (FDTD) computational method can be used to determine specific absorption rate (SAR) and electric field strength in such cases, with specific example of red pam weevil inserted in a block sample of a tree trunk inside a shorted rectangular waveguide.
Index Term-- FDTD, Electromagnetic absorption, SAR, Red Palm weevil, biological body
1. INTRODUCTION
A WAVEGUIDE irradiation system is a convenient way to study interaction of biological materials with microwave fields. Such a system can be used in a number of applications, such as irradiation of insects inside host bodies, investigation of tumor treatment inside healthy or infected tissues, and the like[1-3]. Fujiwara and Amemiya [1] used a waveguide section with reflection plate to study microwave power absorption in a biological specimen exposed to standing waves inside the waveguide, and analysis was made using a quasi-static approach. A similar analytical technique was used By Andreuccetti et. al.[2] to evaluate microwave power absorbed by woodworms and the surrounding wood. Quasi-static analysis consists of independent determination of the contribution of the electric and the magnetic fields separately on the total power absorption by the object under study. It gives reasonable results when the dimensions of the object are small compared to the wavelength of the incident field. Such analytical methods usually approximate the geometrical structure under investigation by known structures amendable to analytical descriptions, such as cubical or spheroid shape. In many practical situations, biological bodies and specimens have irregular shapes and any approximations could lead to inaccurate results.
Due to these restrictions imposed by the analytical method, a more versatile technique was needed. For this purpose, many investigators adopted numerical techniques, such as finite element (FE), Method of Moments (MoM) and finite difference time-domain technique (FDTD) to tackle problems of EM interaction with irregular materials, in general. Among all available numerical techniques, FDTD has more advantages compared to other methods in terms of
*Idris A. Ali is with College of Engineering and Computing, Al Ghurair University, Dubai, UAE (E-mail: [email protected])
.
simplicity and use of computer resources [3]. FDTD has been successfully applied to a wide range of problems dealing with interaction of electromagnetic waves with biological and/or other objects. [4-6]. It has been used by Milica et. al. [4] to analyze transverse electromagnetic cell loaded with biological media in culture dishes. Xiaoli [5] used FDTD for investigation of bone cancer, whereas Yacoob and Hassan[6] used it for brain cancer investigation. Similarly Converse et al. [7.a,b] used the three-dimensional FDTD for investigation of non-invasive microwave hyperthermia treatment of breast cancer.
The present work was motivated by the desire to use microwaves to control red palm weevils (Rhynchophorus ferrungineus) inside the tree trunk and investigate the resulting microwave power absorbed by the RPW and the surrounding palm tree block [8.a,b]. In [8.a], the author of this paper reported the use of microwave energy for destruction of RPW, at larvae stage, using a waveguide irradiation chamber and found that 100% mortality rate could be obtained for RPW positioned 2-3 cm from the leading edge of healthy tree samples and 4-5 cm from the leading edge of infected tree. This was experimentally analyzed by measuring temperature distribution in date palm trunk sections and the RPWs which were inserted in the tree block samples at different positions of the RPW from the leading edge of the waveguide. However, no theoretical electromagnetic modeling was made. In this paper we use FDTD technique to theoretically simulate EM field strength and expected amount of microwave power absorbed by the weevil positioned inside a block of tree trunk inside a shorted waveguide section.
II. BACKGROUND
RPW is considered as the most dangerous and deadly pest of dates, coconut, oil and similar palm trees. [9]. Techniques used to combat this weevil so far has mainly been the use of chemical insecticides [10,11], pheromone traps[12,13] and biological control [9]. Besides the hazards they represent, chemical insecticides proved to be inefficient due to the cryptic feeding habits of this insect inside the palm tree trunk. Pheromone traps are used to collect these weevils in specially made traps and they are only effective in eradication of the weevil adult stages and their effect is much influenced by the design and placement of the traps [13].Biological control, on the other hand, uses naturally occurring organisms, such as nematode worms, to kill the weevils through blood poisoning [14]. Encouraging results are expected, but they are still at an early stage and their overall effect still remains to be seen. Electromagnetic energy at radio and microwave frequencies has been used to control many types of insects, such as: stored grain insects [15], and woodworms [2]. Moreover the use of microwave
FDTD Analysis of Differential Electromagnetic
Energy Absorption by a Biological Body embedded in
a Host Material inside a Shorted Waveguide Section
radiation for red palm weevil eradication has more advantages compared to other methods such as speed, efficiency and absence of any toxic or pollution residues. This is added to the fact that the weevil is unlikely to develop resistance to radiation as they often do to chemical insecticides, for instance.
III. PROBLEM FORMULATION
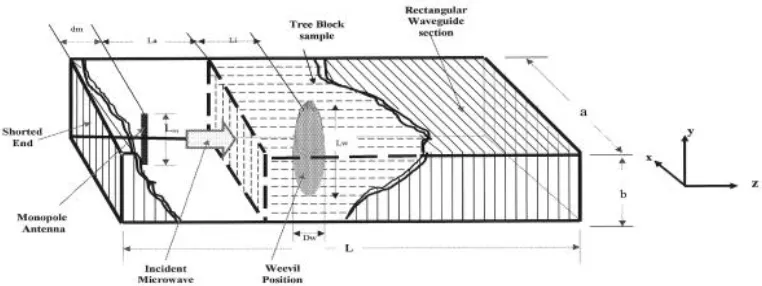
A pictorial view of the waveguide section used, with dimensions, a, b and L is sketched in Fig.1. An RPW of length Lw and width Dw is located at a distance la from the
leading edge of the tree block inside the waveguide.
Fig. 1. Pictorial diagram of the waveguide section partially filled with a block of a tree trunk containing a red palm weevil sample at distance l from the leading edge of the tree block.
The waveguide section is fed by a magnetron source, represented by a monopole antenna of length Lm, located at
distance dm from one shorted end of the waveguide. An EM
wave with frequency, f, is incident on the infected palm tree trunk and the sample of a RPW from left to right. A certain part of the incident power will be reflected due to material discontinuity at the interface between the empty waveguide and the tree block, and the other apart will be transmitted through, to be absorbed by both the RPW sample and the tree trunk.
This structure is modeled using the well-known Maxwell’s equations, given in vector form as:
)
1
(
t
H
XE
)
2
(
t
E
E
H
X
in which
E
and H
are electric and the magnetic field vectors, and , , are respectively the permittivity, the permeability and the conductivity of the material (medium) through which electromagnetic wave propagation takes place.Solution of the above set of coupled equations requires appropriate boundary and initial conditions depending on the structure under investigation. The metallic walls of the waveguide sections are considered perfect electric conductors and accordingly appropriate boundary conditions for the electric field E is:
𝑛 ×
E
= 𝑜 (3) where n is a unit vector perpendicular to E.At the interface between empty waveguide part and the tree trunk block, and similarly between the tree block and the RPW, we apply continuity of the tangential component of the electric field E, i.e.
𝐸𝑖= 𝐸𝑗 (4) where i and j represent different materials at the two sides adjacent to the interface plane.
Solution of the coupled set (1) and (2), with boundary conditions (3) and (4), give the field components E and H. Microwave power absorbed by any absorbing material exposed to electromagnetic field, is commonly determined by what is known as specific absorption rate (SAR), defined as; the rate of incremental energy, dW, absorbed by (or dissipated in) an incremental mass dm, contained in a volume, dV of a given density ρ, i.e.
SAR=𝑑 𝑑𝑡(
𝑑𝑊
𝑑𝑚) =
𝑑 𝑑𝑡(
𝑑𝑊 𝜌𝑑𝑉) = 𝜎
|𝐸|2
𝜌 (5)
3.1 Solution using FDTD:
138703-2525-IJET-IJENS © June 2013 IJENS I J E N S
commercial package, XFDTD from Remcom Ins., which proved to be successful in FDTD method implementation.
3.2 Properties used in computations:
For calculation purposes, a number of material properties for the both weevil and tree trunk were needed. These included
actual dimensions, physical properties such as density, and dielectric properties. All these properties were previously determined by the author, using standard measuring techniques in [8.a], and reproduced in table 1 for convenience
TABLE I
ELECTRICAL AND OTHER PHYSICAL PROPERTIES OF RPW AND DATE PALM TREE TRUNK USED IN THE MODEL [8].
IV. RESULTS AND DISCUSSIONS
5.1 Electric Field Intensity
In order to validate the model electric field distribution inside the empty waveguide chamber was first determined. Fig.2.a shows the gray-scale visualization of the electric field intensity component Ez, within the longitudinal plane
yx of the empty waveguide after the system attained its steady-state condition. Here we observe the strong standing wave pattern usually encountered in shorted empty rectangular waveguide sections supporting the fundamental TE01 mode. This shows the validity of the model and its
capability to give reliable results.
Fig.2.b shows the same Ez field after insertion of a black
sample of on infected tree trunk. Here again we see the strong standing-wave pattern in the empty region of the waveguide section and a steadily decaying E-field intensity as the wave travels deep inside the tree trunk sample. Fig.2.c shows the field variation after introducing a RPW sample at a distance of 2 cm from the leading edge of the tree block sample. Comparing this figure with Fig.2.b, it can be seen that it has the same E-field pattern, apart from the fact that presence of RPW sample inside the tree block sample has further attenuated the E-field (due to energy absorbed by RPW) and hence no trace of E-field in the region of the waveguide behind tree block sample.
Fig. 2. a E-Field pattern in the XY plane cut through empty shorted rectangular waveguide section
Fig. 2. b E-Field pattern in the XY plane cut through a shorted rectangular waveguide section partially filled with a block of a tree trunk
Fig. 2. c E-Field pattern in the XY plane cut through a shorted rectangular waveguide section partially filled with a block of a tree trunk surrounding a
red palm tree sample at larvae stage
5.2 Specific Absorption Rate (SAR)
a) Tree block only
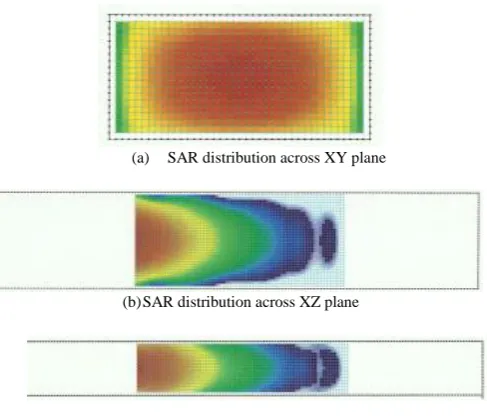
Fig.3a,b,c show respectively gray-scaled snap shots of SAR values on different planes xy, xz and yz cut through the center of the tree block sample after irradiation for 30 minutes. The cross-sectional plane xy image shows the bell-shaped absorbed power, while the longitudinal visualization (xz and yz planes) show the steadily decaying absorbed power.
(a) SAR distribution across XY plane
(b)SAR distribution across XZ plane
(c) SAR distribution across YZ plane
Fig. 3. SAR distribution across different planes cut through a tree block sample tightly inserted in a shorted rectangular waveguide section: (a) XY
plane, (b) XZ plane, (c) YZ plane. Length/diameter
(cm)
Width (cm)
Moisture Content
(% dry wt.)
Density (g/cm3
)
Permittivity
Real part ’
Imaginary part, ”
Weevil (Larvae)
3.9 – 5.5 1.7 – 2.0 65 – 70 1.0 32 – 36 13 – 14.3
Weevil (Adult)
3.0 – 4.0 1.2 – 1.4 20 – 25 0.8 --- ---
Tree Trunk
43 – 47 dia --- 60 – 67 0.97 – 1.08
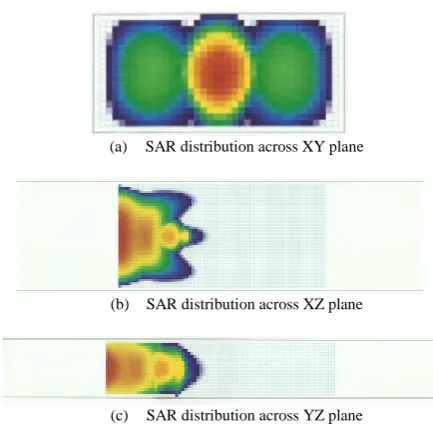
b) Tree block sample with RPW
Fig.4a,b,c show respectively visualization of SAR values at xy, xz and yz planes of the tree block sample with RPW sample at 2 cm from the leading edge of the tree block. Both the cross-sectional plane xy and the longitudinal planes xz and yz through the central axis of the tree block, show concentration of SAR at the region occupied by the weevil. Fig.5a,b,c show SAR visualizations at xy, yz and yz respectively in the case of RPW at 4 cm from the leading edge of the tree block, and we observe here the same pattern of SAR distribution.
(a) SAR distribution across XY plane
(b) SAR distribution across XZ plane
(c) SAR distribution across YZ plane
Fig. 4. SAR distribution across t different planes cut through a RPW at 2cm from the leading edge of a tree block sample inserted in a shorted rectangular waveguide section: (a) XY plane, (b) XZ plane, (c) YZ plane.
(a) SAR distribution across XY plane
(b) SAR distribution across XZ plane
(c) SAR distribution across YZ plane
Fig. 5. SAR distribution across different planes cut through a RPW at 4cm from the leading edge of a tree block sample inserted in a shorted rectangular waveguide section: (a) XY plane, (b) XZ plane, (c) YZ plane.
It is clear that the position occupied by the weevil sample has the highest level in the three planes, and the level decreases away from weevil position gradually in all
directions. In order to have a more quantitative insight into comparative absorption of microwave power by the RPW inside tree block, line plots (1D) of SAR along lines through different planes containing weevil samples, are shown in Fig.6 through Fig.8.
Fig. 6.a shows variations of SAR along tree block (z-direction) with a weevil at 2 cm from leading edge with and without RPW. Comparing the two plots, the following observations can be seen:
i) the region occupied by the weevil has a relatively higher SAR compared to host block tree sample ii) the curve without weevil shows the expected
exponential decay in the level of SAR along the tree block
iii)energy absorbed by the RPW and its host tree block at 2 cm from the leading edge is lower than energy absorbed at the leading edge.
Similarly, the line plots in Fig. 6.b across the center line of the plane xy containing the weevil sample shows the relatively higher absorption rate (almost twice) of the weevil sample, compared to its host block tree sample. These results explain the differential heating of RPW compared to its host infected tree sample experimentally determined by the author in an earlier publication [8.b], and thus confirms differential microwave power absorption of the weevil compared to tree block sample.
Fig. 6.a SAR distribution along a central line on the XZ plane containing tree block with RPW at 2cm from the leading edge of the
tree block.
138703-2525-IJET-IJENS © June 2013 IJENS I J E N S
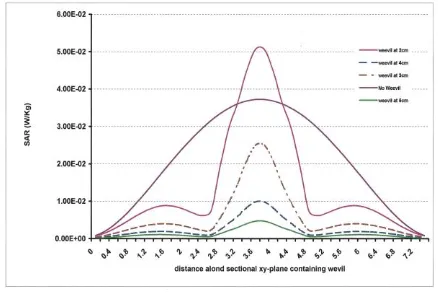
In order to compare differential microwave power absorption by the weevil located at different positions from the leading edge of the tree block, average SAR is computed for RPW at different distances from the leading edge as shown in Fig.7.
Fig. 7. SAR distribution along a central line of the XY plane containing tree block and RPW with RPW at different distances 2, 3, 4 and 5cm from
the leading edge of the tree block
This figure shows variation of average SAR along a line at the center of xz-plane containing the weevil, at 2, 3, 4 and 5 cm from the leading edge of the tree block. It is clearly illustrated how the relative power absorbed by the weevil, SAR, decreases with distance from the leading edge, as expected. Fig.8 shows the corresponding SAR variation along the across central lines of planes containing RPW samples, at different distances (2, 3, 4,5cm) from the leading edge. SAR variation without weevil is also added for comparison. As can be seen the maximum SAR level decreases with increasing distance from the leading edge, and in addition there appear some oscillations of SAR level in the region adjacent to weevil location. This could be attributed to constructive/destructive additions of EM waves incident on, and reflected from the weevil.
Input Impedance & Reflection Coefficient
In addition to electric field intensity and SAR variations, the model also computes the input impedance and the S
parameters of the tree block/weevil combinations. The computed input impedance, Zi, at the leading edge of the
block with and without RPW are shown in table 2. The input impedance, in all cases considered, is found to be complex with a reactive component. This shows the expected impedance mismatch at the junction between the empty waveguide part and the part occupied by the tree block/weevil combination, and that a significant amount of power is reflected. However, as we are interested in the relative or differential absorption of power by the target body (RPW) compared to the host material (tree trunk), rather than absolute values, the high values of input impedance and hence the reflected power, do not affect the adequacy of the technique presented in this work.
Table II
COMPUTED INPUT IMPEDANCE AND REFLECTION COEFFICIENT FOR DIFFERENT TREE TRUNK/RPW CONFIGURATIONS
Configuration Input Impedance
(Zi)
Reflection Coefficient
(S11)
Tree trunk only 143.2 + j168.5 0.62
Tree trunk with RPW sample at 2cm
159.5 + j157.2 0.69
Tree trunk with RPW sample at 4cm
180.2 + j178.5 0.724
V. CONCLUSION
Finite Difference Time domain (FDTD) technique was used to simulate electric field distribution and microwave power absorption rate (SAR) of a red palm weevil sample located at distance d from the leading edge of a block tree trunk sample tightly inserted in a shorted rectangular waveguide. The model gives reliable data that are consistent with measured temperature distribution of a similar set-up considered by the authors in a separate paper [8.a].
Although the FDTD-based technique used here considered a particular case of a RPW embedded in a tree trunk block, the method is so general in that it can be used to model laboratory investigation of EM field distribution and differential power absorption by a target object embedded in a host surrounding material of different dielectric properties. Such cases include; differential absorption of microwave power by malignant tumors inside health biological tissues, differential absorption, and hence differential heating insects inside their host material, e.g. insects that infect different types of agricultural products … etc.
The electromagnetic modeling, considered in this work, can be easily extended to incorporate thermal modeling, to find relative temperature distribute in the target objects, and this is under further investigation by the author.
REFERENCES
[1] G. Fujiwara, & Y. Amemiya, Microwave power absorption in a
biological specimen inside a standing-wave irraditation Fig. 8. SAR distribution along a central line of the XY plane
waveguide. IEEE Trans. Microwave Theory and Tech. Vol. 30 No. 11: 2008-2012. 1982.
[2] P. Andreuccetti, M. Bini, A. Igresti, A. Gambetta, and R. Olmi,
Microwave destruction of wood worms. J. Microwave Power &
Electromagnetic Energy, 29: 153-160. 1994.
[3] A. Taflove and S. C. Hagness. Computational
Electrodynamics: The Finite-Difference Time-Domain Method. 3rd Edn. (Norwood, MA: Artech House), 2005.
[4] P. Milica,; S. C. Hagness and A. Taflove. Finite Difference time domain analysis of a complete transverse electromagnetic
cell loaded with liquid biological media in culture dishes. IEEE
Transactions on Biomedical Engineering, Vol. 45, No. 8, August 1998.
[5] Xi. Xiaoli . FDTD simulation of interstitial antenna for bone
cancer microwave yperthermic therapy. Antennas and
Propagation Society International Symposium,. IEEE. Xi''an
Jiaotong Univ., China Wang Wenbing. Volume: 2 pp: 1855 -
1858 Vol.2 20-25, June 2004
[6] S. M Yacoob and N.S.Hassan. FDTD analysis of a noninvasive
hyperthermia system for brain tumors. Biomed Eng Online. pp.
11-47, 2012.
[7] M. Converse, E. J. Bond, S. C. Hagness and B. D. Van Veen.
Ultrawide band microwave space-time beamforming for hyperthermia treatment of breast cancer: a computational feasibility study. IEEE Trans. Microw. Theory Tech. 52 1876– 89, 2004
[8] M. Converse , E J. Bond, B D. Van Veen and S C. Hagness A
computational study of ultrawideband versus narrowband
microwave hyperthermia for breast cancer treatment. IEEE
Trans. Microw. Theory Tech. 54 2169–80, 2006.
[9] Idris A. Ali & M. A. Al-Jabr “A waveguide Irradiation Chamber
for Destruction of Red Palm Weevils (Rhynchophorus Ferrugineus) Inside a Block Sample of a Palm Tree Trunk”, Journal of Microwave Power & Electromagnetic Energy, Vol. 38, No. 3, 2003.
[10] Idris A. Ali, M. A. Al-Jabr, and A. R. Memari. FDTD
Simulation and Experimental Investigation of Controlled
Microwave Irradiation of Red Palm Weevils. Proc. MECAP 10,
Cairo, Egypt, 20 – 22, Oct. 2010.
[11] S.T. Murphy, and B.R. Briscoe. The red palm weevil as an
alient invasives: biology and the prospects for biological control
as a component of IPM. Biocontrol News and Information, Vol.
20, No. 1, 35N-46N, 1999.
[12] M.R.A. Saleh. The red palm weevil destroying date palms in
Egypt: Biology and Method of Eradicatioon (in Arabic). Proc. Int. Symp. On Date Palms. Center for Environmental Studies, Asyot, Egypt:31-50, 1999.
[13] F. A. El-Ezaby. Injection as a method to control the red Indian
date palm weevil, Rhynchophorus ferrugineus. Arab Journal of
Plant Protection 15: 31-38, 1997.
[14] M.E. El-Garhy, Field evaluation of the aggregation pheromone
of the red palm weevil, Rhynchophoruous ferrugineus, in Egypt. Brighton Crop Protection Conf. Pests and Diseases Vol. 3, Proceedings of an International Conf, Brighton, U.K. 18-21, 1996.
[15] R. M. Giblin-Davis,A. C. Oehlschlager, and L.M. Gonzalez. Field response of Rhynchophorus cruentatus (Coleopetra, Curculionidae) to its aggregation pheromone and fermenting
plant volatiles. Florida Entomologist 77: 164-177, 1994.
[16] P. B. Gopinadhan, N. Mohandasand Nagi Cytoplasmic and
K.P.V. Polyhedrosis virus infecting red palm weevil of coconut. Current science 54: 577-580, 1990.
[17] S. S. Bedi, and M. Singh. Microwaves for control of stored grain