Page 11 www.ijiras.com | Email: contact@ijiras.com
Advanced Manufacturing Technology Adoption And
Organizational Structure
G. M. Nyori
Department of Mechanical and Manufacturing Engineering, University of Nairobi, Kenya
P. K’Obonyo
Department of Business Administration, School of Business, University of Nairobi, Kenya
I. INTRODUCTION
Manufacturing processes, equipment and systems used in design and production are undergoing dramatic changes in response to new customer needs, competitive challenges and emerging technologies (Dornfeld, 2011). Complexity, dynamism and uncertainty have become dominant characteristics of recent competition patterns which have resulted in a demand-diversified market with more multifaceted products (Efstathiades et al., 1999). Advanced Manufacturing Technology (AMT) appears to represent a perfect interaction between technological potential and the manufacturing challenges. The major benefits of Advanced Manufacturing Technologies (AMTs) include faster machine cycle, greater reliability, reduced inventory, saving on labor, greater flexibility and improved quality. For these benefits to be realized, organizations will require a flexible structure, higher level of skills and a new culture in managing and planning the manufacturing processes.
Historically, contingency theory has sought to formulate broad generalizations about the formal structures that are
typically associated with or best fit the use of different technologies. The perspective originated with the work of Joan Woodward (1965), who argued that technologies directly determine differences in organizational attributes such as span of control, centralization of authority, and the formalization of rules and procedures. The work of other researchers (Thompson, 1967; Perrow, 1970) on technology and structure complements this statement. Woodward (1965) empirically demonstrated the interaction of manufacturing technology with organizational structure to influence performance. She found that a linear relationship existed between manufacturing technology and some structural measures such as the number of hierarchical levels, span of control and number of sub-units. Blau et al. (1976) investigated how manufacturing technology influenced organizational structure and reported that a linear relationship existed. The Okayama study (Marsh & Mannari, 1981) found out that technology affected all the aspects of structure–labor inputs, complexity, span of control, costs and wages.
Kim and Utterback (1983), in their research study based on cross-sectional analysis, revealed that influence of Abstract: Data on 92 industrial organizations point to the existence of relationships between advanced manufacturing technology adoption and some aspects of organizational structure, including the number of specialized sub-units, the number of levels of authority, span of control, degree of role programming specification, degree of communication programming specification and the degree of output programming. Primary finding is that as the investments and integration of AMTs increases, the more likely the foregoing aspects of structure are to increase. The findings hold with size and a number of other organizational variables controlled. The results indicate that a company’s capacity to assimilate technology depends on its organizational capabilities. The study encapsulates the need for companies to increase their organizational capabilities during investment and integration of AMTs.
Page 12 www.ijiras.com | Email: contact@ijiras.com technology on structure in a developing country was different
from a developed country. Madique and Hayes (1984) in their studies of AMT companies reported that in specialization along the hierarchy such as rank and seniority are often ignored or eliminated. Nemetz and Fry (1988) identified the dimensions of AMT companies as organic with a narrow span of control, few vertical levels, high integration, decentralized decision-making, horizontal communication and adoptive behaviour. David et al. (1989) examined the linkages between technology and structural fit and found that the best fit between them was responsible for better performance. Parthasarthy and Sethi (1992) asserted that superior performance could result when there is a fit between manufacturing technology and the structure of organization. Ghani et al. (2002) found that AMT change in an existing organizational structure examined in their study has no effect on the organizational structure that is mostly reactive in nature (less proactive), but has significant effects on the structure that is proactive. As the organizational structure of a company is evolutionary, rather than being revolutionary, in many industrial companies, the match between structure and technology takes several years after implementation (Hajipour et al., 2011). Li and Xie, (2012) revealed that manufacturing company‟s which were successful in AMT implementation had opted for a more flexibility-oriented organizational structure that might have comforted the AMT implementation through creating an atmosphere of encouragement and trust.
While these studies are optimistic about the influence of manufacturing technology on structure, there are studies to indicate that there is no substantial relationship between manufacturing technology and structure (Reimann, 1980; Amoako-Gyampah and Acquuah, 2008; Olhager and Prajogo, 2012). Considering the enormous studies, which consistently focus and reiterate that manufacturing technology has an influence over structure, this researcher has followed the optimistic approach of fit between manufacturing technology and organizational structure for superior performance.
II. ADVANCED MANUFACTURING TECHNOLOGY
Over the past few decades, manufacturing has gone from a highly labor-intensive set of mechanical processes to an increasingly sophisticated set of information technology-intensive processes. This trend is expected to continue to accelerate as advances in manufacturing technologies are made. The major strategic benefits that these technologies offer are the increased flexibility and responsiveness, enabling an organization to improve substantially its competitiveness in the marketplace (Efstathiades et al., 1999). Godwin et al. (1995) emphasized that these manufacturing technologies have the potential to improve production performance dramatically and create vital business opportunities for companies capable of successfully implementing and managing them. The benefits of advanced techniques can be realized by investing only a few AMTs and as a result companies can gradually integrate these technologies into the production process to get the most benefit from it (Yusuff et al., 1997).
Different studies have adopted wider definitions of AMTs. Youssef (1992) defined AMTs as a group of integrated hardware and software based technologies. These technologies are often referred to as intelligent or smart manufacturing systems and often integrate computational predictability within the production process (Hunt, 1987). Boyer et al. (1997) used the term AMT to describe a variety of technologies that utilize computers to control, track, or monitor manufacturing activities, either directly or indirectly. Small and Chen (1997) regards AMTs as a wide variety of modern computer based technologies in the manufacturing environment. From these studies, it can be summarized that, AMT suggests both soft and hard technologies which are being employed to enhance manufacturing competencies. This study adopts the narrower form of AMT as the use of innovative technology to improve production processes or products and it is this concept that is further explored within this study.
The use of AMTs is often claimed to achieve higher quality levels, reduce manufacturing cycle times and lower costs since it permits the integration of the full spectrum of production functions and manufacturing processes with computer technologies (Sun et al., 2007). With the use of computer technology, AMTs makes the data storing and manipulation possible, that is, data held electronically can be changed and distributed easily and cheaply between technologies. Companies therefore adopt these technologies for a wide range of activities, ranging from scheduling to quality inspection.
Given the wide range of computer-based technologies that can be found in manufacturing companies, the holistic technology perspective, which covers the whole range of AMTs, is believed to be the research wave of the future in production technology, which is in line with the focus of this study. Given the wide range of AMTs, this study adopts a similar list as that put forward by Small and Chen (1997). However, the management practice element Just-in-Time (JIT), is excluded as the researcher considers it not a technology, but instead more of a practice.
III. ORGANIZATIONAL STRUCTURE
As manufacturing companies adopt AMTs organizational structure is affected at operational and administrative levels. Organizational structure is the formal allocation of work roles and the administrative mechanism to control and integrate work activities (Child and Mansfield, 1972). An organizational structure defines how activities such as task allocation, coordination and supervision are directed towards the achievement of organizational aims (Pugh, 1990). An organizational structure allows the expressed allocation of responsibilities for different functions and processes to different entities. The structure of an organization will determine the modes in which it operates and performs. From an organizational structure a co-ordination mechanism between the various players in a given company is created (Mintzberg, 1979).
Page 13 www.ijiras.com | Email: contact@ijiras.com centralization of power. Characteristics of organizational
structure are explained in terms of division of task, job description, decision-making, communication, control system, coordination and span of control at supervisory level, vertical levels and ratio of white-collar to blue-collar employees. Our concern here is with the basic specializations within the organization such as sub-units, level of authority, span of control and programs specifications. These particular aspects of organizational structure exert considerable influence over the organizational decision-making processes.
The models of organizational design are mechanistic or organic. A mechanistic structure is characterized by hierarchical functions, vertical communication, rigid job description and centralized decision making (Burns & Stalker, 1961; Mintzberg, 1979). Mechanistic organization is comparatively simpler and easy to organize, but difficult to cope with rapid change. An organic structure is characterized by flexible job description, decentralized decision making, minimum levels, temporary work groups and lateral communication (Mintzberg, 1979). Organic models are comparatively more complex and harder to form but are highly adaptable, flexible and more suitable where external environment is rapidly changing and is unpredictable. Burns and Stalker (1961) state that organizational structure should be related to the environment in which the organization operates. Where the environment is very stable and predictable, a mechanistic structure is suitable and where the environment is one of change and unpredictable an organic structure is more preferable.
The adoption of new manufacturing technologies by companies warrants a review of organizational structure. In the 21st century, organizational theorists such as Lim et al. (2010) have proposed that organizational structure development should be dependent on the behavior of the management and the workers as constrained by the power distribution between them and should be influenced by their environment. However, theorists such as Lawrence and Lorsch (1969) found that companies operating in less stable environments operated more effectively if the organizational structure was less formalized, more decentralized and more reliant on mutual adjustment between various departments in the company and the outcome. Ideally, organizational structure should be shaped and implemented for the primary purpose of facilitating the achievement of organizational goals in an efficient manner.
IV. STUDY HYPOTHESIS
Implementation of AMT affects organizational structure since it involves decisions relating to division of task, decision-making authority, co-ordination mechanisms and so on. Flexibility in structure involves managing variety rather than volume, change rather than routine, and judgment rather than standard procedures. Traditional structure that emphasizes on a high level of differentiation in task and authority would be inappropriate for these conditions. The resulting arrangement is an organic structure that is flexible, adaptive, and multiskilling oriented. However, a company‟s capacity to assimilate technology depends on its
organizational capabilities. Thus, when the AMT complexity is higher, the organizational structural elements should also be higher.
The framework posits, inter alia, that; the adoption of AMT would suggest that a company‟s structural adjustments would influence organization structure both at operational and administrative levels. However, a company‟s capacity to assimilate technology depends on its organizational capabilities. Thus, when the AMT complexity is higher, the organizational structural elements should also be higher. Following from the discussion of AMT adoption and structure we now propose to link these variables in terms of the following hypothesis: There is a positive relationship between Advanced Manufacturing Technology adoption and organizational structure.
Thus as AMTs investments and integrations increases, the number of specialized sub-units, the number of levels of authority, the span of control, the amount of role programming specification, the amount of communication programming and the amount of output programming specification in the organization increases,
V. MEASUREMENT PROCEDURE
A questionnaire was used as the instrument to measure reality objectively. The questionnaire used in this study incorporated inputs from various sources; Woodward (1965); Small and Chen, (1997); Ghani (2002) and the researcher. Preliminary drafts of the questionnaire were discussed with academic scholars and practitioners and subsequently tested in one of the beverage manufacturing company in Nairobi to assess the content validity. The feedback from the above party was then used to improve the clarity, comprehensiveness and relevance of the research instrument. The final survey instrument incorporated some minor changes that were picked up during this preliminary test.
The questionnaire solicited information on the two variables of the study; Organizational Structure Characteristics and AMT adoption. Specifically, the questionnaire used for collecting information from the sample companies was divided into two sections. The first section was used for collecting information from production/plant managers in the sample companies. The second section was self-administered to at least 5 blue collar employees and the researcher took more respondents where previous respondents were unable to answer the questions appropriately. An average for each company for this section was thereafter calculated. In order to measure the level of organizational index on 1-5 continuum the list of items used in the study of Ghani (2002) were adapted. To obtain logical response and required information of the study a five point Likert type scale was used in perception questions.
Page 14 www.ijiras.com | Email: contact@ijiras.com adoption, the continuum from high to low was measured by
the level of AMT investment and integration. The study investigated 14 AMTs in 5 domains based on their functionality. The divisions are as follows:
Product design and engineering technologies (PDETs):
Computer-aided design (CAD)
Computer-aided engineering (CAE)
Group technology (GT)
Computer-aided manufacturing (CAM).
Production planning technologies (PPTs)
Material requirement planning (MRP)
Manufacturing requirement planning (MRP II)
Enterprise resources planning (ERP).
Material handling technologies (MHTs)
Automated storage and retrieval systems (ASRS)
Automated guided vehicles (AGV).
Assembly and machining technologies (AsMTs)
Computer-aided quality control (CAQC)
Robotics
Numerical controlled machines (NC/CNC/DNC).
Integrated manufacturing technologies (IMTs)
Flexible manufacturing cells or systems (FMC/FMS)
Computer integrated manufacturing (ClM).
Companies were asked to indicate the amount of investment they have in the individual technology, on a Likert scale of 1-5, where 1 indicated little investment and 5 indicated heavy investment. The respondents were also asked to indicate the level of integration of each AMT invested in the company on a Likert scale of 1-5, where 1 indicated no integration and 5 indicated extended integration.
VI. RESPONDENTS' PROFILE
Gaining admission to industrial organizations for the purposes of sociological research is difficult at best. The author, dependent to a large extent on the efficacy of personal contact networks for the purposes of getting information. A letter of introduction accompanying the questionnaire was addressed to the Production Manager / Managing Director of the company. Thereafter the letter was followed up by telephone calls to fix an appointment since section 2 of the questionnaire was to be self-administered. 183 letters were written to all the AMT companies identified and either delivered or posted. As the AMT plants are located at different places, geographically ranging from 5 to 700 km, data collection process took nearly 7 months. 101 companies showed positive response and data from these companies were collected for analysis. A brief look at the companies showed that all our sub-sectors were represented and that that our initial sample size was 98 was meant and so the collected data was deemed representative of the population.
In Section 1 of the instrument the respondents were required to fill up their job title and the duration in holding the position in the company. This information was deemed important in order to find out the credibility of the informant. Out of the 101 respondents whose data was collected the credibility of 9, representing about 9%, did not meet the standard required and so were rejected in the analysis. The
analysis is therefore based on 92 companies, representing all the sectors. The majority of the respondents in section 1 of the instrument 42.5% were from top management levels, i.e. director, managing director, chief executive officer or chairman, and approximately 40% of the respondents were directly responsible for manufacturing or operations or production issues of their companies. 17.5% of respondents were holding non-manufacturing-related positions such as administration manager, company secretary, marketing manager, commercial manager, purchasing manager, human resource manager and finance manager.
Section 2 of the instrument was to be self- administered to the blue collar workers working within AMT machines. 5 respondents were sampled from each company and an average for each unit of analysis was thereafter calculated. In this part of the instrument the respondents were required to answer as to their job title and the duration in holding the position in the company. This information was deemed important in order to find out the credibility of the informant. Since this was self-administered all the respondents sampled herein were from machine operators, shop stewards or maintenance personnel. Out of the 460 questionnaires (5 from each company), majority of the respondents (63%) were machine operators, 23% were maintenance personnel and 14% were shop stewards.
As the mean workforce number of companies surveyed is rather low, at around 50 employees, it is no surprise that the top management level were in-charge of their manufacturing function and involved in decision making in manufacturing issues. At a glance, we can infer that the sampled information collected from the survey was highly credible and with good understanding of informants, with the average duration in their respective positions as 9 years.
The 92 AMT manufacturing companies were grouped into eight sub-sectors based on manufactured products. The majority of respondents were from food, beverage and animal feeds industry at 31.5%, followed by the construction and material industry at 14.1%, chemical and pharmaceuticals industry at 12.0%, plastics, packaging and stationery industry at 12.0% and power generation and electrical/electronic industry at 10.9%. Other respondents represent a small fraction like fabricated metals industry at 7.6%, textiles, apparel, leather and foot ware industry at 6.5% and automobile and parts industry at 5.4%.
VII.RESULTS AND INTERPRETATIONS
A. PRODUCT DESIGN AND ENGINEERING
TECHNOLOGIES
Page 15 www.ijiras.com | Email: contact@ijiras.com All sub-sectors share the same point, as shown in Fig 2
that investment in CAD takes the most important position while GT is worth the least. In detail, the fabricated metal industry relies on CAD the most, followed by the Automobile and parts industry. Similarly, CAE is relatively more important in the fabricated metal industry and least important in chemical and pharmaceutical industry. Automobile and parts industry registered the highest mean score, 4.25, in computer aided manufacturing and plastics, packaging and stationery registered the lowest mean score, 1.25.
Figure 3: Investments of product PDETs by Sub-Sector
Overall, the results show that the levels of integration in PDETs are limited, since none of the scores is over 2.5 (half way). The mean score of PDET integration with the companies age bands and Sub-Sector they shows that the levels of integration are low, with a mean score of less than 2.5. In terms of the individual PDET, almost 90 percent of the respondents invested moderately in CAD, however the majority have their CAD either stand alone, no integration, or only integrated within the department.
It is the same scenario for CAE. 66% of companies surveyed have little to moderate integrations in CAE. Majority of the companies that invested in computer aided engineering, about 80% have the technology either with limited or no integration. Few companies surveyed invested in GT (with mean score around 2), and only 20% of those that had invested in the technology stated to have limited integration. The rest had not integrated the technology.
The most integrated piece of PDETs is CAM. Among the companies that had invested in CAM, 19% integrated computer aided manufacturing within the company, and 4% of the companies extended CAM integration to suppliers or customers.
Table 1 shows CAM investment and integration cross tabulation. 23 companies among the 29 that indicated little investment in computer aided manufacturing did not integrate the technology into the system. 4 of them indicated limited integration and the remaining 2 showed moderate integration.
CAM Integration Total
non e
limit ed
moder ate
Full y
Exten ded CA
M Inve stme
little 23 4 2 0 0 29
some 6 4 3 1 0 14
moder ate
3 9 4 5 0 21
nt substa ntial
2 1 5 4 0 17
Heavy 1 2 3 2 3 11
Total 35 20 17 12 3 92
Table 1: CAM investment and integration cross tabulation
Figure 5 compares integration mean score of product design and engineering technologies with Sub-Sectors. The results shows that among the invested technologies in these domain Automobile and parts industry had the highest mean score of 2.1875 followed by fabricated metal industry that had a mean score of 2.125. Construction and material industry had the least score of 1.375.
Figure 5: Integration of PDETs by Sub-Sector
B. PRODUCTION PLANNING TECHNOLOGIES
The whole manufacturing industry seems to have agreement on the investments in PPTs. As shown in Figure 6, the ranking of investments in the three technologies, from highest to lowest are MRP, MRPII and ERP. The results show that indeed companies are still very much at the early version of PPT.
Figure 6: Investment in PPTs by Sub-Sectors
Page 16 www.ijiras.com | Email: contact@ijiras.com pharmaceutical industry has the least integration, with a mean
score of 1.25.
Figure 8: Integration of PPTs by Sub-Sector
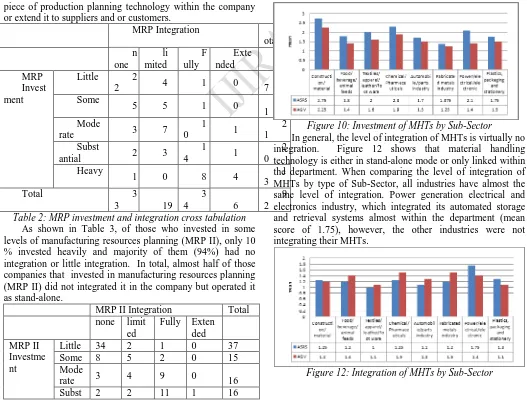
In terms of the individual PPTs, MRP is the most invested by companies surveyed and also the most integrated, as shown in the Table 2. The figures show that there is a positive relationship between the level of MRP investment and the extent of the integration. Out of the 27 Companies that showed little investment in MRP, 22 indicated no integration, 4 indicated limited integration and only 1 company that indicated full integration. The result shows that out of the invested technologies most companies will limit or not integrate with other technology, while companies that have moderate and heavy investment in MRP, tend to integrate this piece of production planning technology within the company or extend it to suppliers and or customers.
MRP Integration T
otal n
one
li mited
F ully
Exte nded MRP
Invest ment
Little 2
2 4 1 0
2 7 Some
5 5 1 0 1
1 Mode
rate 3 7
1
0 1
2 1 Subst
antial 2 3
1
4 1
2 0 Heavy
1 0 8 4 1
3
Total 3
3 19
3
4 6
9 2
Table 2: MRP investment and integration cross tabulation
As shown in Table 3, of those who invested in some levels of manufacturing resources planning (MRP II), only 10 % invested heavily and majority of them (94%) had no integration or little integration. In total, almost half of those companies that invested in manufacturing resources planning (MRP II) did not integrated it in the company but operated it as stand-alone.
MRP II Integration Total none limit
ed
Fully Exten ded MRP II
Investme nt
Little 34 2 1 0 37
Some 8 5 2 0 15
Mode
rate 3 4 9 0 16
Subst 2 2 11 1 16
antial Heav
y 0 0 5 3 8
Total 47 13 28 4 92
Table 3: MRPII investment and integration cross tabulation
The results also show that ERP is less popular among the companies surveyed. The number of companies that invested and integrated ERP is significantly low. Companies either made little to moderate investment with none to limited integration.
C. MATERIAL HANDLING TECHNOLOGIES
The study shows that on average companies surveyed have little investments in MHTs. Generally, companies invested more in ASRS in comparison with AGVs. Figure 10 shows that construction and material industry ranks the highest in MHTs investments but had less than moderate investment in ASRS. Fabricated metal industry had the lowest investment in ASRS with a mean score of 1.375. AGVs investment is slightly lower than ASRS investment. The leading industry, construction and material industry had a mean score of 2.25. The least investment in AGVs is in fabricated metal industry with almost negligible investment, i.e. a mean score of 1.25.
Figure 10: Investment of MHTs by Sub-Sector
In general, the level of integration of MHTs is virtually no integration. Figure 12 shows that material handling technology is either in stand-alone mode or only linked within the department. When comparing the level of integration of MHTs by type of Sub-Sector, all industries have almost the same level of integration. Power generation electrical and electronics industry, which integrated its automated storage and retrieval systems almost within the department (mean score of 1.75), however, the other industries were not integrating their MHTs.
Page 17 www.ijiras.com | Email: contact@ijiras.com D. ASSEMBLY AND MACHINING TECHNOLOGIES
Generally, industries invested the most in numerical control machines technologies. Figure 13 shows that food, beverage and animal feed industry, fabricated metal industry, automobile and parts industry and the chemical and pharmaceutical industry invested more moderately in NC/CNC/DNC than the other industries, with a mean score of about 3. The investment in numerical control machines for other industries is less than moderate, the least being plastic, packaging and stationery with a mean score of 2. Investments in CAQCS are limited, except for food, beverage and animal feed industry and fabricated metal industry. Companies invested least in robotics technology with a mean score of 1.75.
Figure 13: Investment in AsMTs by Sub-Sector
Levels of integration of AsMTs are limited. Figure 15 shows that the highest to the lowest mean scores of integrations are NC/CNC/DNC, CAQCS and robotics technology. Integration of CAQCS is on the highest level in the food, beverage and animal feed industry. Power generation, electrical/electronic made the most integration in robotics as compared to other industries.
Construc tion and material Food/be verage /animal/f eeds Textiles/ apparel/ leather/f oot ware Chemical / Pharmac euticals Automob ile/ parts industry Fabricate d metals industry Power /electrica l /electron ics Plastics/ packagin g / stationer y
CAQCS 2 2.25 2 2 1.75 1.75 2 1.75
Robotics 1.25 1 1.5 1 1.25 1.5 1.75 1
NC/CNC/DCN 1.25 3.25 2 3.25 1.75 2 2.75 2.5
0 0.5 1 1.5 2 2.5 3 3.5 m e an
Figure 15: Integration of AsMTs by sub-sector
Table 4 shows that further investigation of CAQCS reveals that most companies that invested in CAQCS fall into little investment with no integration combination. The majority of surveyed companies that invested in CAQCS had limited integration. There were 2 companies that substantially invested and fully integrated. 1 company substantially invested and extended CAQCS integration to supplier or customers. One company invested heavily and only made full integration.
CAQCS Integration To
tal no ne limit ed mode rate Fu lly Exten ded CAQC S Invest ment
little 35 4 2 0 0 36
some 20 8 2 1 0 31
moderat
e 3 4 3 3 1 14
substant
ial 2 2 2 2 1 9
Heavy 0 0 1 1 0 2
Total 55 18 10 7 2 92
Table 4: CAQCS Investment and Integration Cross tabulation
Table 5 shows the distribution of respondents in terms of the level of investment in robotics and its level of integration. It is obvious that there are a limited number of companies investing and integrating in robotics technology. Among companies who provided valid answers in this section, 60% of them made little investment and no integration, with less than 25% of them making any integration.
Robotic Integration Tot
al no ne limit ed moder ate Full y Extend ed Robot ic Invest ment
little 56 2 0 0 0 58
some 8 2 1 0 0 11
moderat
e 5 3 0 0 0 8
substant
ial 1 5 1 1 0 8
Heavy 1 2 2 1 1 6
Total 71 14 4 2 1 92
Table 5: Robotics investment and integration cross tabulation
Table 6 reveals that numerical control machines technology is the most invested by the respondent companies, with a total of 77 % of respondent companies, having some level of investments. Except for companies who made no integration, the largest group appears in the combination of substantial investment and limited integration (9), followed by heavy investment and moderate integration (8). Worth noticing is that the number of companies who made heavy investment and extended integration to suppliers or customers are 4 while the number of companies who made heavy investment and fully integration are 6.
NC/CNC/DNC Integration Tot al no ne limi ted moder ate Fu lly Exten ded NC/CN C/DNC Investm ent
little 2
1 1 0 0 0 22
some 5 4 0 0 0 09
moderat
e 5 6 2 1 0 14
substant
ial 3 9 5 4 1 22
Heavy 3 4 8 6 4 25
Total 3
Page 18 www.ijiras.com | Email: contact@ijiras.com
Table 6: NC/CNC/DNC investment and integration cross tabulation
E. INTEGRATED MANUFACTURING TECHNOLOGIES Figure 15 shows that the mean score of investments in FMC/FMS by surveyed companies is slightly higher than ClM. FMS/FMC registered a mean score of 2.05 as compared to CIM that registered a mean score of 1.725. It is the same scenario when compared by their Sectors. For most Sub-Sectors investments in FMC/FMS are slightly more than ClM.
Figure 15: Investments in IMTs by Sub-Sector
As the name suggests, one would have thought that integrated manufacturing technologies would be fully or extensively integrated within the company or to include their supply chain. However, the level of integration, as provided by the surveyed companies in Figure 17, is rather low, both at mean score of 1.75 for FMC/FMS, and 1.5 for computer-integrated manufacturing which means that both computer-integrated manufacturing technologies have limited integration. This means that the technology is only limited to the department. Automobile and parts industry registered the highest level of integration for FMC/FMS at a mean score of 2.25 while construction and material industry and food, beverage and animal feed industry registered the lowest at a mean score of 1.5. The highest score for CIM was automobile and parts industry at a mean score of 2. The rest of the sub-sectors registered low integration ranging from a mean score of 1.75 to a mean score of 1.25.
Figure 17: Integration of IMTs by Sub-Sectors
Table 7 shows that more companies did little investment with no integration (33). One company made substantial investment and extended integration to supplier or customers. Five companies made heavy investment and fully integrated FMC/FMS
FMC/FMS Integration Tot
al non limit moder Ful Exten
e ed ate ly ded
FMC /FM S Inve stme nt
little 33 4 1 0 0 38
some 6 5 1 0 0 12
moderate 2 8 4 2 0 16
substanti
al 1 5 5 4 1 17
Heavy 0 2 3 5 0 8
Total 42 24 14 11 1 92
Table 7: FMC/FMS investment and integration cross tabulation
Table 8 shows that few companies made computer-integrated manufacturing integration. 46 out of a total of 92 companies surveyed indicated that they made computer-integrated manufacturing integration. It is observed that companies investment little of these technology and having no integration form the largest group (40), followed by moderate investment with limited integration (8). There are seven companies which did some investment but with limited integration. 5 companies did moderate investment but integrated moderately. Only one company made heavy investment and extended CIM integration to suppliers or customers.
CIM Integration Tot
al no
ne limit ed
mode rate
Ful ly
Exten ded CIM
Invest ment
little 40 2 2 1 1 46
some 4 7 1 1 0 13
moderat
e 2 8 5 2 1 18
substant
ial 0 4 3 2 2 11
Heavy 0 0 2 1 1 4
Total 46 21 13 7 5 92
Table 8: CIM investment and integration cross tabulation
F. GENERATION OF AMTs SCORES
For the purpose of a summary and analysis, the aggregate AMTs investment and integration of surveyed companies generates ten AMTs investment and integration scores, which are product design and engineering technology investment score (PDETinv) and integration score (PDETint), logistics related technology investment score (PPTinv) and integration score (PPTint), material handling technology investment score (MHTinv) and integration score (MHTint), assembly and machinery technology investment score (AsMTinv) and integration score (AsMTint), and integrated manufacturing technology investment score (IMTinv) and integration score (IMTint).
Below lists the formulae of each investment and integration score for each AMT:-
Page 19 www.ijiras.com | Email: contact@ijiras.com
The score for AMT for each sub-sector or individual company is as follows;
G. NUMBER OF SUB-UNITS
Under the dimension sub-units, which was measured using number of specialized departments in the company, it was found that power generation and electrical and electronics industry had the highest sub-units (8) followed by fabricated metal industry (7). Construction/material industry registered the lowest (3.5). It was also observed that the importance of sub-units is moderate for small companies as compared to large companies. The data also suggests that the importance of sub-units vary depending on the age of the company.
From the data, number of specialized sub-units by company ranged between the lowest 3 to the highest 12. Using our five point score scale where 1 is to indicate the lowest organizational index and 5 to indicate the highest organizational index, then a score of 1 was taken for a mean of 3-4 sub-units on one end and a score of 5 was taken for a mean of 11-12 on the other end, Table 1 shows the tabulated results in terms of Sub-Sectors.
Sub-sector mean Score
value Construction and material industry 3.75 1 Food, beverage and animal feeds
industry
6
2 Textiles, apparel, leather and foot
ware
5
2 Chemical and Pharmaceuticals
industry
4
1 Automobile and parts industry 5 2 Fabricated metals industry 7 3
Power generation and
electrical/electronics
8
3 Plastics, packaging and stationery 4 1
Table 1: Number of Sub-Units by Sub-Sectors
H. LEVELS OF AUTHORITY
Levels of authority are the formally delimited zones of responsibility along the organizational hierarchy. This dimension of organizational structure measures the hierarchical authorities in the production line. Across the eight sub-sectors, the mean rankings are above 3, which suggest low vertical differentiation. Overall, across the data the lowest registered levels of authority was 2 and the highest registered levels of authority was 6.
Table 2: Levels of authority by Sub-Sectors
I. SPAN OF CONTROL
Span of control is the number of workers a manager/supervisor controls. A manager or supervisor is defined as an incumbent of the organization charged with the responsibility of overseeing and coordinating the work of others in the organization. The span of control of the average manager in an organization determines horizontal differentiation of the organization. Small span of control will result in a taller organizational chart, with more management positions relative to the number of individual contributors. A higher span of control will result in a flatter or wider chart, with fewer management positions relative to the number of individual contributors.
It is assumed in our study that each sub-unit is controlled by one manager/supervisor. In our study the highest mean of number of employees was about 284 in power generation electrical/electronics industry and the number of sub-units in this sub-sector was found to be 8. Therefore largest number of employees controlled by a single manager was found to be about 36. Our score scale is based on this figure and scale of 1 was selected as 1 manager for 36 people, scale of 2 as 2 managers for 36 people, scale of 3 as 3 managers for 36 people, scale of 4 as 4 managers for 36 people and a scale of 5 for 5 managers for 36 people. The results are shown in Table 3 and Figure 12.
Category Empl
oyees Sub-units
Span of control
Scale
Construction/ material 92 3.7
5 25 2
Food/ beverage/animal
feeds 215
6
36 1
Textiles/ apparel/ leather/foot ware 97
5
19 2
Chemical/Pharmaceutic
als 80
4
20 2
Automobile/parts
industry 145
5
29 2
Fabricated metals
industry 120
7
17 3
Power
generation/electrical/ele 284 8
35 1
Sub-sector mean Score
value Construction and material industry 4 3 Food, beverage and animal feeds
industry
5
4 Textiles, apparel, leather and foot
ware
3
2 Chemical and Pharmaceuticals
industry
4
3 Automobile and parts industry 5 4
Fabricated metals industry 4 3
Power generation and electrical/electronics
5
Page 20 www.ijiras.com | Email: contact@ijiras.com ctronic
Plastics, packaging and
stationery 59
4
15 3
Table 3: Span of control by Sub-Sector
Figure 12: Span of Control by Sub-Sector
J. ROLE PROGRAMMING
Role programming herein is the formalization of duties and responsibilities as in sets of job specifications. The mechanistic design is synonymous with bureaucracy, high formalization, downward communication and little participation by low-level employees in decision-making. The organic design is has low formalization, it has lateral, upward and downward communication networks and high participation by low-level employees in decision-making (Mintzberg, 1979).
The extent to which work is formalized to each blue collar employee was tested. For each item in the questionnaire, respondents were requested to choose a response on a five-point likert scale; anchored at one end with „not at all‟ meriting a score of 1, and the other by „ to a very great extent‟ meriting a score of 5. The questionnaire was designed in such a manner as to have a score of 5 as the highest index and a score of 1 as the lowest index. From the data, it is observed that the importance of overlapping of jobs in the organization was relatively high for small and medium companies. The results form sub-sectors is as shown in Figure 13.
Figure 13: Role Programing by Sub-Sector
K. COMMUNICATION PROGRAMMING
Communication programming herein is the formal specification of the structure, content, and timing of communication within the organization. In the surveyed companies, blue collar workers were to rank on the extent to which formal communications are made to them. Mechanistic
structure is characterized by downward communication and little participation by low-level employees in decision-making while in the organic design it is characterized by lateral, upward and downward communication networks and high participation by low-level employees in decision-making (Mintzberg, 1979).
For each item in the questionnaire, respondents were requested to choose a response on a five-point likert scale; anchored at one end with „not at all‟ meriting a score of 1, and the other end by „ to a very great extent‟ meriting a score of 5. The questionnaire was designed in such a manner as to have a score of 5 as the highest score and 1 as the lowest score. The results are shown in Figure 14. The results reveal that companies from automobile and parts industry performed better than the rest and had a mean score of 4.5. Plastic, packaging and stationery performed the worst with a mean score of 2.3.
Figure 14: Communication Programming by Sub-Sector
L. OUTPUT PROGRAMMING
Under the quality dimension of output programming, companies were measured on the number of steps through which raw materials pass in the course of becoming the organization‟s outputs. Information for this dimension was deduced directly from respondents in section 1 of the instrument. Overall, across the eight sub-sectors, the mean ranking was above 5, which suggest a steady stream of output. Most of the studied companies are either continuous production lines with little variation in output and rare stops, individuals are only used to manage exceptions in the work process or mass production characterized by routines and procedures. There were few small-batch or unit technology companies involved in making simple one-of-a-kind customized products or small quantities of products. In the sampled companies none is involved in fabrication of large equipment in stages or production of technically complex units. Where technically complex units are made, the process involves assembling of parts that are imported.
Page 21 www.ijiras.com | Email: contact@ijiras.com parts industry recorded the highest, 10. The lowest number of
steps was an average of 4, recorded by textile, apparel, leather and foot ware industry and fabricated metal industry. Table 4 and Figure 15 shows the results.
Sub-Sector Mean
no of steps
Scale value
Construction and material industry
4.25 1 Food, beverage and animal feeds
industry
5
2 Textiles, apparel, leather and foot
ware
4
1 Chemical and Pharmaceuticals
industry
7
3 Automobile and parts industry 10 4 Fabricated metals industry 4 1 Power generation and
electrical/electronics
8
3 Plastics, packaging and stationery 5 2
Table 4: Output programming by Sub-Sector
Figure 15: Output Programming by Sub-Sector
M. GENERATION OF ORGANIZATIONAL INDEX SCORE
Companies operating in less stable environments operated more effectively if the organizational structure was less formalized, more decentralized and more reliant on mutual adjustment between various departments in the company. Likewise, companies in uncertain environments seemed to be more effective with a greater degree of differentiation between subtasks in the organization and when the differentiated units were heavily integrated with each other. Companies operating in more stable and certain environments functioned more effectively if the organization was more formalized, centralized in the decision-making and less reliant on mutual adjustment between departments. Likewise, these companies do not need a high degree of differentiation of subtasks and integration between units.
From the analysis above, we have descriptive knowledge of detailed organizational structure dimensions from our surveyed companies. Organizational index of each company is taken as the average measure of dimensions score. For the convenience of comparison and analysis, the following equation gives us the organizational index for each company and also for each sub-sector.
Organizational index (OI) =(Χ01+Χ02+Χ03+Χ04+Χ05+Χ06 )/6
where
Χ01= Sub-unit score
Χ02= Levels of authority score
Χ03= Span of control score
Χ04= Role programming score
Χ05= Communication programming score
Χ06 = Out programming score
VIII. TESTING OF THE RELATIONSHIP The objective of the study sought to establish the relationship between AMT adoption and organizational structure. To achieve this objective, the hypothesis was tested using simple bivariate regression analysis of AMT adoption index against organizational structure index. The correlation, R, was found to be 0.779 which indicated a high degree of correlation. The R2 value, indicating how much of the total variation in the dependent variable can be explained by the independent variable, was 0.607. This is an indication of a good goodness of fit of the model. This is supported by the test of significance represented by F-ratio at 138.763, p<0.05 depicting that the relationship is statistically significant at 95% confidence level (P-value <0.05).
The AMT adoption was operationalized in terms of AMT investment and AMT integration while organizational structure was operationalized in terms of sub-units, levels of authorities, span of control, role programming, output programming and communication programming. In agreement with Schroder and Sohal (1999) all measured organizational characteristics do show a tendency to increase with AMT adoption. There was generally a high degree of consistency on all the six dimensions of Organizational index in each of the companies studied. The study showed that a company which had a greater number of levels of authority would also tend to be higher on all other dimensions. When empirically tested, the research findings present the interrelationships between these two variables. Three dominant findings emerged from the study.
Page 22 www.ijiras.com | Email: contact@ijiras.com AMT adoption positively influence organizational index and
therefore the hypothesis that there is a positive relationship between AMT adoption and organizational structure is supported.
Secondly, this study found that a company‟s capacity to assimilate technology depends on its organizational capabilities. The study encapsulates the need for companies to increase their organizational capabilities during investment and integration of AMTs. In agreement with Lim et al.(2010) the study found that the ability of the companies in integrating work activities including those that cut across organizational boundaries, developing the workforce and incorporating the workers new roles and skills required by AMT enables positive contribution to AMT adoption. Based on the results obtained the study shows that some efforts have been made in the areas of role programming and communication programming but training of workers in increasing their ability to run multiple machines is not in the priority line of many surveyed companies. However, most small companies need build their organizational capabilities to derive the full potential of AMTs. Under the existing conditions, in small companies, AMT will not work well, thus, organization-driven changes should be initiated.
Thirdly, the study revealed that most of the organizational structural adjustments are evolutionary, rather than being revolutionary. In many industrial companies surveyed the match between needed structure and AMT adoption took sometimes after implementation. Ghani (2002) similarly found that AMT adoption in an existing organizational structure has no effect on the organizational structure and that is mostly reactive in nature (less proactive), but has significant effects on the structure that is proactive. However Li and Xie (2012) found that manufacturing companies which were successful in AMT implementation had opted in advance for structural adjustments.
XI. CONCLUSIONS
When examining the fit between organization structure and AMT adoption it was found that a linear positive relation existed. In regard to the objective of the study organizational structure orientations are associated with different levels of investment and integration of AMTs. The study partly confirms conclusions derived from the literature that there is a link between AMT implementation and organizational structure (Ghani et.al. 2002; Hajipour et al., 2011, Mirmahdi, 2012). However, there is a rather interesting finding as to which AMTs are associated with certain orientations of the structure. The study confirms that all the surveyed dimensions of the organizational structure increases as the level of investment and integration of AMTs increase. The finding confirms that companies that are technology „hogs‟ which basically use most or all AMTs to achieve their competitive advantage have a high organizational structure index. Thus AMT usage is higher for companies with higher organizational index. However, the study finds that these companies do not integrate much of their invested AMTs particularly AsMT.
Companies that are concerned with investment and integration of AMTs do not necessarily emphasize much on organic structure. The findings for these AMTs are in contradiction with the literature that mechanistic structure companies would be less interested in investing and integrating any AMTs (Ghani, 2002, Hajipour et al. (2011). The fact that these companies are investing in the AsMTs and IMTs is a much surprising finding. Notwithstanding their rigid consciousness to change, these companies only invest and integrate in limited but essential technologies that would help them with their high volume production and handling large amounts of inventory. Thus, it makes sense that these companies are associated significantly with these technologies.
REFERENCES
[1] Amoako-Gyampah, K., Acquaah, M. (2008). Manufacturing strategy, competitive strategy and company performance: An empirical study in a developing economy environment. International Journal of Production Economics, 111(8), 575–592.
[2] Blau, P. M., Falbe, C. M., Kinley, W., & Tracy, P. K. (1976, March). Technology and organization in manufacturing. Administrative ScienceQuarterly, 20–40. [3] Boyer, K.K, G. Keong Leong, P.T. Ward, and L.J.
Krajewski (1997). Unlocking the Potential of advanced Manufacturing Technologies. Journal of Operations Management 15. pp. 331-347.
[4] Burns, T., & Stalker, G. M. (1961). The management of innovation. London: TaviStock.
[5] Chen, 1.1., and Small, M.H.. (1994). Implementing advanced manufacturing technology: An integrated planning model. International Journal of Management Science, 22(1),4-13.
[6] Child, J. & Mansfield, R. (1972). Technology, size and organization structure, Sociology, 6,369–393
[7] David, F. R., Pearce II, J. A., & Randolph, W. A. (1989). Linking technology and structure to enhance group performance. Journal of Applied Psychology, 74(2), 233– 241.
[8] Dornfeld, D.,(2011) “Leveraging Manufacturing for a Sustainable Future,” Proceedings of 18th CIRP International Conference on Life Cycle Engineering
(LCE2011), University of Braunschweig, Germany, May, 2011, pp. 17-21.
[9] Efstathiades, A., S.A. Tassou, G. Oxinos and A. Antoniou, (2000). Advanced manufacturing technology transfer and implementation in developing countries: The case of the Cypriot manufacturing industry. Technovation, 20: 93-102.
[10]Ghani, K. A. (2002). Impact of advanced manufacturing technology on organizational structure and work attitudes of blue-collar employees. PhD thesis published, Anna University, Chennai, India.
Page 23 www.ijiras.com | Email: contact@ijiras.com [12]Hajipour, B., Talari, M., Shahin, A. (2011). An
investigation of the relationships between industry structure, strategy type, organizational characteristics and organizational performance: A case study of the food and chemical industries of Iran. African Journal of Business Management, 5(16), 7085-98.
[13]Hunt, V. D. (1987). Dictionary of advanced manufacturing technology. London: Elsevier.
[14]Kim, L., & Utterback, J. M. (1983). The evolution of organizational structure and technology in developing country. Management Science, 29(16), 1185–1197. [15]Lawrence, P. R., & Lorsch, J. N. (1969). Organization
and environment. Homewood, IL: Irwin
[16]Li, P., Xie, W. (2012). A strategic framework for determining e-commerce adoption. Journal of Technology Management in China, 7 (1), 22-35.
[17]Lim, M., G. Griffiths, and S. Sambrook. (2010). Organizational structure for the twenty-first century.
Presented at the annual meeting of The Institute for Operations Research and The Management Sciences, Austin. London: Tavistock Publications.
[18]Madique, M., & Hayes, J. (1984, Winter). The art of high technology management. Sloan Management Review,17,
17–30.
[19]Marsh, R. M., & Mannari, H. (1981). Technology and size as determinants of organizational structure of Japanese factories. Administrative Science Quarterly, 26, 33–57. [20]Mintzberg, H. (1979). The structuring of organizations.
New Jersey: Prentice-Hall.
[21]Nemetz, P. L., & Fry, L. W. (1988). Flexible manufacturing organizations: implications for strategy formation and organization design. Academy of Management Review, 13, 627–638.
[22]Olhager, J., Prajogo, D. (2012). The impact of manufacturing and supply chain improvement initiatives: A survey comparing make-to-order and make-to-stock companies. Omega, 40(2), 159-165.
[23]Parthasarthy, R., &Sethi, S. P. (1992). The impact of flexible automation on business strategy and organizational structure. Academy of Management Review, 17(1), 86–111.
[24]Perrow C.B (1970) Organizational analysis; a sociological. Tavistock Publications
[25]Pugh, D. S., ed. (1990).Organization Theory: Selected Readings. Harmond sworth: Penguin.
[26]Reimann, B.C. (1980) Organization structure and technology in manufacturing: System versus work flow level perspectives. Academy of Management Journal, 23(1), 61–77
[27]Schroder, R., and Sohal, A.S .. (1999). Organizational characteristics associated with AMT adoption: Towards a contingency framework. International Journal of Operations and Production Management: 19(12), 1270-1291.
[28]Small, M.H., and Chen, 1.1. (1997), Organizational development and time based flexibility: an empirical analysis of AMT adoptions. International Journal of Production Research. 35(11),3005-3021
[29]Small, M.H., and Yasin, M . (1997). Developing a framework for the effective planning and implementation of advance manufacturing technology.
International Journal of Operations and Production Management, 17(5), 468-489.
[30]Sun, X.L., Y.Z. Tian and G.G. Cui, 2007. The empirical study on the impact of advanced manufacturing technology on organizational structure and human resources management. Proceedings of the 14th International Conference on Management Science and Engineering, Aug. 20-22, IEEE Xplore, London, 1548-1553.
[31]Thompson, J.D (1967) Organizations in action; Social Science Bases of Administrative Theory. McGraw Hill. [32]Woodward, J. (1965). Industrial organization: theory and
practice. London: Oxford University Press.