AAEE2017 CONFERENCE
Manly, Sydney, Australia
This work is licensed under the Creative Commons Attribution 4.0 International License. To view a copy of this license, visit http://creativecommons.org/licenses/by/4.0/ 1
Student Expectations:
The effect of student background and experience
Brent Phillips1, Trudy Harris1, Lynette Johns-Boast2 1Waikato Institute of Technology; 2Australian National University
CONTEXT
The perspectives and previous experiences that students bring to their programs of study can affect their approaches to study and the depth of learning that they achieve (Prosser & Trigwell, 1999; Ramsden, 2003). Graduate outcomes assume the attainment of well-developed independent learning skills which can be transferred to the work-place.
PURPOSE
This 5-year longitudinal study investigates factors influencing students’ approaches to learning in the fields of Engineering, Software Engineering, and Computer Science, at two higher education institutes delivering programs of various levels in Australia and New
Zealand. The study aims to track the development of student approaches to learning as they progress through their program. Through increased understanding of students’ approaches, faculty will be better able to design teaching and learning strategies to meet the needs of an increasingly diverse student body. This paper reports on the first stage of the project.
APPROACH
In August 2017, we ran a pilot of our survey using the Revised Study Process Questionnaire (Biggs, Kember, & Leung, 2001) and including some additional questions related to student demographics and motivation for undertaking their current program of study. Data were analysed to evaluate the usefulness of data collected and to understand the demographics of the student cohort. Over the period of the research, data will be collected using the
questionnaire and through focus groups and interviews.
RESULTS
Participants provided a representative sample, and the data collected was reasonable, allowing the questionnaire design to be confirmed.
CONCLUSIONS
At this preliminary stage, the study has provided insight into the student demographics at both institutes and identified aspects of students’ modes of engagement with learning. Some areas for improvement of the questionnaire have been identified, which will be implemented for the main body of the study.
KEYWORDS
AAEE2017 CONFERENCE
Manly, Sydney, Australia
Student Expectations:
The effect of student background and experience
Brent Phillips1, Trudy Harris1, Lynette Johns-Boast2 1Waikato Institute of Technology; 2Australian National University
Introduction
Although universities claim to produce ‘work ready’ graduates (DEST, 2005; Orrell, 2004) especially as measured by their graduates’ capacity to obtain a full-time job related to their field of study, a recent survey by the Australian Information Industry Association (AIIA) revealed that overwhelmingly their members identified a “job ready skills gap” (AIIA, 2017). Students may be competent in a specific skill in one setting, such as university assessment, but frequently they are unable to put that skill to use in another (Prosser & Trigwell, 1999). Supporting the AIIA findings, recent work in New Zealand, funded by the Engineering Education to Employment organisation (EE2E), has shown that employers believe students of Institutes of Technology and Polytechnics (ITPs) are more likely to have job ready skills. This research reported the “consensus was that ITP graduates have a better range of emotional intelligence capabilities and are more ‘work-ready’ than their university-qualified peers” (EE2E, 2015). EE2E are currently working to increase the number of ITP graduates to meet projected demand for future growth in New Zealand.
Educational research has shown that learning transfer to unfamiliar problems and
environments happens best when the learner has “developed a deep, rather than surface, understanding” of the problem (Barnett & Ceci, 2002, p. 616). Despite this, within tertiary education and society more generally, there is a focus upon quantitative rather than qualitative learning, where quantitative learning is described as learning that can be ‘measured’ or where there is a ‘right’ answer and qualitative learning is where learners are able to identify the connections between various aspects of their learning and so can put together those aspects into a new pattern better suited to the problem they are currently working on (Dahlgren, 1997; Entwistle, 1997; Prosser & Trigwell, 1999; Ramsden, 2003). Furthermore, it has been shown that the perspectives and previous experiences students bring to their programs of study influence their approaches to study which in turn affects the depth of learning that they achieve (Prosser & Trigwell, 1999; Ramsden, 2003). A learner’s ability to learn is affected by their understanding of the context of the learning. Additionally, their prior knowledge affects their perception of the context: those with a well-developed understanding are more likely to perceive the context such that it affords deep learning, while those with poor prior knowledge perceive the context so that it affords surface learning (Prosser & Trigwell, 1999).
As problem- and project-based learning (PBL) has been shown to help students gain a deeper understanding than other approaches offer (Hmelo-Silver, 2004; Wood, 2003), many higher education institutions teaching engineering and computing have introduced PBL. This approach has been a key philosophy in many of the ITP’s in New Zealand and in the
Proceedings, AAEE2017 Conference
Manly, Sydney, Australia 2
Education (AaeE) (Prosser, 2016). During his presentation, Prosser suggested that there would be value in applying Biggs’ Study Process Questionnaire (Biggs, Kember, & Leung, 2001; Zeegers, 2002) across different courses with the same students, as well as to students in their first and last year of study, suggesting such an approach would produce a good view of the variation across the field.
Prosser’s challenge, and accepting that “explanations that might fairly reflect and give insight into student experiences require an understanding of the complex context in which learning occurs” (Kieser, Herbison, & Harland, 2005), have shaped our research design.
Methodology
This research will follow different cohorts of students throughout their time of study to see whether their expectations and prior experience coming into a program affects how they study, and whether there is a change in expectations or learning style as their study progresses. Each year a process of data collection will occur and will continue until all cohorts complete their period of study. Ethics approval has been granted at each institution for this research program to be undertaken.
The Cohorts
Participants in this study were drawn from the cohorts of students enrolled in engineering and computing programs of study at two tertiary institutions, one in Australia and the other in New Zealand. These institutions were chosen so that a range of levels of qualification and background and experience could be targeted. Although both institutions have roughly the same number of students (about 20,000 in total) and academic staff (just over 800), they are substantially different. The first is an internationally-ranked, world-leading, research-intensive university located in a capital city with a participant cohort of around 2,500, while the second is a local, teaching-focused, vocational institute with a participant cohort of around 500 students.
As shown in Table 1 below, the research targets a range of different qualifications, from level 6 to level 9 on the New Zealand Qualification Framework (NZQF) (New Zealand
Qualifications Authority, n.d.) and the Australian Qualification Framework (AQF) (Australian Qualifications Authority, n.d.). In New Zealand, students are enrolled in 2- and 3-year undergraduate Civil, Electrical or Mechanical Engineering study programs. In Australia, students are enrolled in several Engineering or Computing study programs at both undergraduate and post-graduate level. (See endnote for program names.)
Table 1: Student cohorts included in this study
Qualification i NZQF&
AQF Level
U/G or
P/G Duration of study program (years)
Percent of total cohort at each institution
Age range
Aus. NZ
NZDE 6 U/G 2 66% 19-34
DCOMP 6 U/G 1 3% 19-20
BEngTech 7 U/G 3 34% 20-42
BIT, BADA 7 U/G 3 15% 18-25
BIT(Hons), BAC, BSENG 8 U/G 4 21% 17-48
BE 8 U/G 4 37% 18-50
GCert/GDip 8 P/G 1 4% 19-47
MENG 9 P/G 2 6% 20-57
Data collection
The data for the longitudinal study will be collected using a range of tools:
1. A survey which includes the Revised Student Study Questionnaire from Biggs et al. (2001). This instrument will be the first tool used and will collect as much information as possible, from which to develop the themes and correlations. To do this the survey will include Likert type questions as well as open ended qualitative questions.
2. Once themes have been identified, focus groups and interviews will be used to further explore areas of interest.
3. Student attendance and performance, as provided by students through a series of questions in the survey, will be collected to help understand whether the learning styles are being reflected in the quality of student work, attendance, and marks.
At the beginning of semester 2, 2017 the survey was piloted with the currently enrolled cohort of students. The aim of this initial survey was to ensure that the survey design was appropriate and the data collected reasonable. The longitudinal study will start in Semester 1, 2018 and will run until 2022 (see Table 1 above).
Design of Questionnaire
Data was collected from participants via an anonymous online questionnaire which included the complete Revised Study Process Questionnaire (RSPQ) developed by Biggs et al (2001) with additional questions to investigate respondents' demographics, motivations, and their development of professional skills. Respondents' anonymity was preserved using a
structured, self-generated identifier: a concatenation of the first three letters of the student’s mother’s name, the year of the student’s birth and the first three letters of the student’s first name. This identifier preserves anonymity, while allowing longitudinal comparisons of data from participants in successive instances of the survey.
The questionnaire was organised in three sections: (1) demographic data, (2) motivation for studying, and (3) approaches to learning, and consisted predominantly of questions requiring Likert-scale ratings, with limited opportunity for unrestricted responses. The overall research design anticipated that areas needing in-depth analysis would become the topic for focus group sessions in future stages of the research. The estimated time to complete the
questionnaire for a native English language respondent was less than 10 minutes. This falls within the recommended 20-minute questionnaire limit for respondent data reliability (Cape & Phillips, 2015). To reduce respondent drop-out rate, the online questionnaire system was suitable for both PC and mobile device use (Cape & Phillips, 2015).
Section (1) ‘demographics’ included the seven most relevant of the 26 questions in Dowling's (2010) survey of Australian para-professional engineering students. The questions asked respondents to identify their enrolled program of study, gender, age, responsibilities in the two years prior to this period of study, semester of study, ethnicity, and
domestic/international status.
Section (2) ‘motivation for study’ prompted respondents to rate a set of eight possible
motivators on a five-point ordinal Likert-scale (Sullivan & Artino, 2013). The prompts were: to get a high-paying job; to learn things that I’m interested in; for my family; to get an interesting job; because I’m good at this; because it’s fun & exciting; to make an impact on my
community / country / the world; to help me gain residency. Collecting this data on the participants’ motivations for study allowed an investigation into a possible correlation
Proceedings, AAEE2017 Conference
Manly, Sydney, Australia 4
learning. This section included the 20 RSPQ questions (Biggs et al., 2001) and an additional 11 questions seeking to understand students’ use of learning resources, time management and teamwork skills. The survey used the RSPQ scale; Never/almost never; Sometimes; About half the time; Often; Almost always/always (Biggs et al, 2001). Biggs et al. (2001) provide a 50-point scoring system for the ten questions related to each approach, to evaluate a respondent’s preference for deep or shallow approaches to learning. The validation
procedure for the set of questions and analysis method used by Biggs et al. (2001) is
described in their paper and gave the authors of this study confidence in using the RSPQ as a reliable tool to evaluate respondents’ approaches to learning for this piece of research. The data from the additional questions will be used independently to investigate potential
correlations with factors from earlier sections of the survey, and to identify whether students are developing skills for the work environment.
To evaluate the usefulness of the data collected, the authors conducted an initial, basic analysis of the data and a reflection on the tool used for data collection and it is this which is reported in this paper.
Results and Discussion
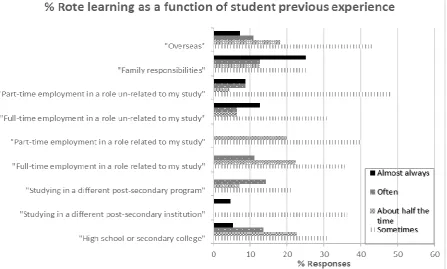
As well as commenting on the demographic data collected, we report on data from a single question, chosen because it provides an interesting snapshot of the data collected and a good indication of the usefulness of the data. The question we have chosen to report on is Question 31, taken directly from the RSPQ –“I learn some things by rote, going over and over them until I know them by heart, even if I do not really understand the concept”.
A total of 420 students across the two institutions responded to the survey; a 14% response rate. At least one response was received from each of the individual cohorts surveyed, with some cohorts such as the BE and MCOMP responding better than others. Our comparison of respondents (see Table 2 below) with the enrolled cohort (Table 1 above) to whom the survey was sent, leads us to believe that overall, we have a representative sample. There was, however, an especially low response rate from NZDE, BEngTech and DCOMP students which weakened the strength of conclusions that could be drawn from those survey
responses. Therefore, when the project begins a concerted effort must be made to ensure that there is a significant response from all cohorts.
The following sections outline respondent demographics and discuss the reliability of this questionnaire.
Demographic profile
Table 2 and Figure 1 below, provide a snapshot of the demographic profile of students who participated in the survey. Table 2 compares the gender and enrolment of participants with the overall enrolled cohort of students from both institutions. All numbers are percentages.
Table 2: Demographics of respondents (res) against overall cohort (all)
Gender Enrolment
Male Female Domestic International
All Resp. All Resp. All Resp. All Resp.
Aus. 77 78 23 22 53 43.5 47 56
NZ 92 82 8.4 18 70 59 30 41
Figure 1: Respondents’ experience 2 years prior to their current study NB. Students could select more than one option.
From the data, it is evident that most of the respondents are continuing their study at higher levels. It is also interesting to note that the number of respondents who identified as
“overseas” is significantly less than the respondents enrolled as international students. This could be an indication that many international students may have been in the country longer than their current program of study and may be something we will investigate further in later stages of the project.
Reflection on Questionnaire Design
Proceedings, AAEE2017 Conference
Manly, Sydney, Australia 6
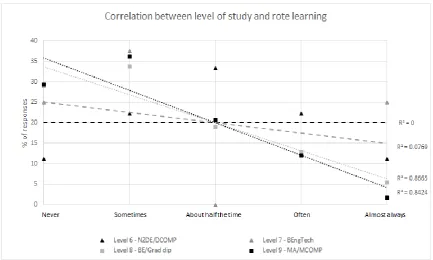
The correlation between the students’ level of study and their frequency of use of the rote -learning approach is shown in Figure 3. As the trend lines indicate, students studying in programs at levels eight and nine showed the strongest negative correlation with frequency of use of rote learning strategies, while the lower level programs showed a wider distribution of responses to the prompts.
Figure 3: Correlation between level of study and rote learning.
The data suggests that students enrolled in higher-level programs are generally engaged in deeper learning strategies and have recognised the need for approaches other than rote learning for success as engineering / computing students. For students on the lower level papers the data presented in Figures 2 and 3 is so far inconclusive, and requires a greater detail of analysis.
The data collected and the brief analysis, some of which is presented above, gives the authors confidence in the ability of this survey tool to provide insights into relationships between students’ approaches to learning and their demographics and background and experience. Detailed investigation will be undertaken in the following longitudinal study to identify correlations between approaches to learning and student demographics, background and experience for both engineering and computing students. As suggested by this basic analysis, detailed analysis is expected to identify topics for further investigation through focus group discussions.
Survey Design Issues
Survey respondents provided some unprompted feedback on the design of the
questionnaire, identifying points where they had trouble providing a single answer on the Likert-scale. The researchers agreed that two questions from the RSPQ set needed clarification, as they combined two factors within one question. The first combined “I
generally restrict my study to what is specifically set...” with “...as I think it is unnecessary to do anything extra”. The second appears later in the questionnaire: “I find most new topics interesting...” paired with “...and often spend extra time trying to obtain more information about them”.
identified their time pressures as a motivator which sometimes lead to the behaviour of restricting study scope. Other respondents may well have had different motivations driving this behaviour, but the design of the questionnaire did not distinguish these.
This insight will be applied to update and refine the complete set of questions before the next phase of research begins in semester one, 2018. In this connection, it is important to note that the study, work, and social environment for post-secondary students has changed significantly in the years between 2001 and 2017. The use of subjective frequency-of-use headings for the Likert scale questions will also be reviewed, with possible addition of clarification for respondents regarding the frequency options. The authors are keen, however, while improving understandability of questions to maintain comparability against other studies which have used the RSPQ.
Additionally, it was pointed out by a student that when asking about gender, as well as female, male and rather not say, we need to include ‘other’ to allow those who identify as binary, trans-gender, gender diverse and LGBTQIA+ not to be forced to either mis-gender themselves or hide their gender.
Conclusion and Future Work
This pilot study of our approaches to learning questionnaire has been successful in evaluating the research design. The survey responses provided an excellent picture of student approaches to rote learning and the data appeared to show relationships with
previous experience. Correlations and insights will be generated from in-depth analysis of the complete data set, which can be used to inform the design of teaching & learning activities and course and program curricula that will lead to better attainment of desired graduate attributes.
Despite the overall success of the pilot, there are a small number of issues that need to be addressed either prior to the longitudinal study or during it:
1. While respondents came from all groups within the cohort, the response rate was low for some programs. This issue will be largely overcome by accumulating data from the cohorts each semester the survey is run and by being proactive and ensuring that sufficient responses are collected from each of the individual program cohorts.
2. There were some issues with combined factors in the RSPQ questions which made it hard for students to respond accurately. Further analysis will identify which questions need modification to improve clarity of responses while maintaining comparability with other international studies which have used the RSPQ.
3. This study was unable to link responses to academic results due to ethics constraints therefore a further section, section (4) ‘performance’, will be added to the survey. Students will be asked to identify the two units of study (sometimes also called course or paper) in the immediately preceding semester for which they received their highest grade and their lowest grade. They will be asked to rate their approach to study, the final grade received and whether that grade was what they expected for each. This work was an evaluation of the research design and the next step will be to begin
collecting longitudinal data, apply Biggs et al.’s (2001) 50-point scoring system, evaluate and correlate the respondents’ preferences for deep or shallow approaches to learning and to run focus groups to attempt to explore and understand areas of interest.
References
Proceedings, AAEE2017 Conference
Manly, Sydney, Australia 8
Barnett, S. M., & Ceci, S. J. (2002). When and where do we apply what we learn? A taxonomy for far transfer. Psychological Bulletin, 128(4), (pp. 612-637). doi:10.1037//0033-2909.128.4.612
Biggs, J. B., Kember, D., & Leung, D. Y. (2001). The Revised Two Factor Study Process Questionnaire: R-SPQ-2F. British Journal of Educational Psychology., (pp.133-149).
Cape, P., & Phillips, K. (2015). Questionnaire Length and Fatigue Effects: The Latest Thinking and Practical Solutions. Survey Sampling International.
Dahlgren, L.-O. (1997). Chapter 2: Learning Conceptions and Outcomes. In F. Marton, D. Hounsell, & N. J. James (Eds.), The experience of learning (2nd ed.). Edinburg: Scottish Academic Press. DEST. (2005). Employability skills for the future: Project final report. Canberra: Australian Government
Department of Education, Science & Technology.
Dowling, D. (2010). The career aspirations and other characteristics of Australian para-professional engineering students. Proceedings of the 2010 AaeE Conference. Sydney.
EE2E (2015). Talking with Employers: Workshop Report. Wellington: Engineering E2E. http://www.engineeringe2e.org.nz/Documents/e2e-talking-with-employers-workshop-report-9June2015.pdf retrieved 25 September 2017
Entwistle, N. (1997). Chapter 1: Contrasting perspectives on learning. In F. Marton, D. Hounsell, N. J. Entwistle, F. Marton, D. Hounsell, & N. J. Entwistle (Eds.), The experience of Learning (2nd ed.). Edinburg: Scottish Academic Press.
Hendersen, S., & Broadbridge, P. (2007). Mathematics for 21st Century Engineering Students. Proceedings of the 2007 AaeE Conference. Melbourne.
Hmelo-Silver, C. E. (2004, September). Problem-Based Learning: What and How Do Students Learn? Educational Psychology Review, 16(3).
Kieser, J., Herbison, P., & Harland, T. (2005). The influence of context on students' approaches to learning: a case study. European journal of Dental Education, (pp.150-156).
Kyte, A. (2013, July). A ‘Fresh Eyes’ Look at Improving the Effectiveness of Engineering Group Design Projects. Engineering Education, 8(1), (pp.81-97).
New Zealand Qualifications Authority. (n.d.). Understanding New Zealand Qualifications. Retrieved August 27, 2017, from http://www.nzqa.govt.nz/studying-in-new-zealand/understand-nz-quals/ Orrell, J. (2004). Work-integrated Learning Programmes: Management and Educational Quality.
AUQA Occasional Publication, Proceedings of the Australian Universities Quality Forum 2004. Australian Universities Quality Association (AUQA).
Prosser, M. (2016, December 6). Student Perspectives of Teaching & Learning. Coffs Harbour, New South Wales, Australia: AAEE2016.
Prosser, M., & Trigwell, K. (1999). Understanding learning and teaching: The experience in higher education. McGraw-Hill Education (UK).
Ramsden, P. (2003). Learning to teach in higher education. London: Routledge.
Sullivan, G.M., & Artino, A.R. (2013) Analyzing and Interpreting Data from Likert-Type Scales. Journal of Graduate Medical Education, (pp.541-542)
Wilson, K. L., Lizzio, A., & Ramsden, P. (1997). The development, validation and application of the Course Experience Questionnaire. Studies in Higher Education, 22(1), (pp.33-53).
doi:10.1080/0307507971233138121
Wood, D. F. (2003). Problem based learning. BMJ: British Medical Journal, 326(7384), (pp.328-330).
Zeegers, P. (2002). A Revision of the Biggs’ Study Process Questionnaire (R-SQP). Higher Education
Research & Development, 21(1), (pp.73-92). doi:10.1080/07294360220124666
i NZDE New Zealand Diploma in Engineering
DCOMP Diploma of Computing
BIT Bachelor of Information Technology BADA Bachelor of Applied Data Analytics BIT(Hons) Bachelor of Information Technology (Hons)
BE Bachelor of Engineering (Hons), Bachelor of Engineering Research & Development (Hons) (BE), BSENG Bachelor of Software Engineering (Hons
BAC Bachelor of Advanced Computing (Hons), Bachelor of Advanced Computing Research and Development (Hons) GCert/GDip Graduate Certificate and Graduate Diploma of Applied Data Analytics, Graduate Diploma of Computing MENG Master of Engineering in Digital Systems & Telecommunications, in Mechatronics, in Photonics and in
Renewable Energy