Cell-to-cell variability in the yeast pheromone response: high throughput screen identifies genes with different effects on transmitted signal and response
Pesce, C. G.3, Peria, W.1, Zdraljevic, S3, Rockwell, D.3, Yu, R. C.3, Colman-Lerner, A.1*, and Brent, R.1,3*#
Affiliations:
1. Fred Hutchinson Cancer Research Center, Seattle, Washington 98109
2. IFIBYNE-UBA-CONICET and D, Facultad de Ciencias Exactas y Naturales, Universidad de Buenos Aires, Buenos Aires C1428EHA, Argentina
3. The former Molecular Sciences institute, Berkeley, California 94704
* These authors contributed equally
Abstract
Populations of isogenic cells often respond coherently to signals despite differences in protein abundance and cell state. Our previous work in the Saccharomyces cerevisiae pheromone response system (PRS) uncovered processes that reduced cell-to-cell variation in signal and response. To understand these and other processes that controlled variation, we generated a whole-genome collection of haploid strains with deletions in non-essential genes and used high-throughput flow cytometry to screen more than 1000. We identified 50 "variation genes" required for normal cell-to-cell variability in signal and response. Some genes affected only signal variability, signal strength, or system output, defining these quantities as separable “axes” of system behavior. Two genes affected cytoplasmic microtubule function.
Introduction
Cell signaling systems transmit information about the external environment, enabling cells to respond to extracellular signals. Although much is known about the operation of these systems, however, the means they use to ensure precise and accurate signal transmission and cell response remain largely unknown. Moreover, in metazoan tissues, populations of cells must determine concentrations of extracellular signaling and make appropriate fate decisions in response to those determinations. Coherence in these cell population responses is critical for the choreographed sequence of cell and tissue interactions during embryonic development, and for regulated cell division and differentiation during tissue maintenance in the adult.
Yet cells, even genetically identical cells in common environments behave differently. Such variability was first demonstrated in studies of bacteria and phages. In 1945 Delbrück showed large cell-to-cell variation in the yield of T1 phage from individual Escherichia coli cells (Delbrück, 1945), and Lieb demonstrated a reproducible binary distribution of clonal E. coli either being lysed or lysogenized after infection with phage λ (Lieb, 1953). Later, Novick and Weiner showed that the time of induction of the lac operon in single cells was highly variable (Novick and Weiner, 1957), and Spudich and Koshland found persistent non-genetic cell-to-cell differences in chemotactic behavior of individual genetically identical Salmonella typhimurium bacteria (Spudich and Koshland, 1976). More recently, cell-to-cell variation in clonal behavior has been shown in mammalian cells; for example, during the differentiation of hematopoietic progenitor cells into erythroid and myeloid cells (Chang et al., 2008), the decision to die in response to a pro-apoptotic drug (Sigal et al.; Spencer et al., 2009) and the activation of latent HIV proviruses (Weinberger et al., 2005).
output") that depend on a set of proteins here called the signaling arm of the PRS.
Determination of the direction of a gradient of pheromone concentration, and subsequent growth towards a mating partner, depend on proteins here called the polarity determination arm of the system. Our previous work quantified system output by expression from PRS
responsive and control reporter genes (see Box). It separated the cell-to-cell variation in output into two contributions. The first of these was from events upstream of the promoter, affecting a signal transmission or "pathway" subsystem, P, quantified as η2(P). The second contribution was from variation affecting either pre-existing cell-to-cell differences in capacity of a "gene
expression" subsystem η2(G ) or rapid-acting changes in gene expression "intrinsic noise", or η2(γ). This work further established analytically that cell-to-cell differences in (P) were caused by η2(L), (differences in L, the capacity component of the signal transmission subsystem at the start of the experiment) and η2(λ), rapid acting changes in signal during the measurement, but we could not separate η2(L) and η2(λ) experimentally.
biochemical processes, such as gene expression, that involve small numbers of protein components (Arkin et al., 1998; Delbrück, 1945; McAdams and Arkin, 1997). For example, Arkin and McAdams showed by modeling that stochastic fluctuations in gene expression could plausibly account for whether an infecting lambda phage lyses the cell or forms a lysogen (McAdams and Arkin, 1997). Such variability is often referred to as “noise” (Elowitz et al., 2002). This term can sometimes connote rapid fluctuations. However, other work reveals the importance of additional slowly-changing sources of variation in reducing coherence of population responses. In phage λ, incoming phage are more likely to lysogenize small cells than big ones, suggesting that one slow-changing source of variation (the cell growth and division cycle), rather than a fast-changing one (“noise” in the chemical reactions), causes the observed variability in the percentage of infecting phage that form lysogens (St-Pierre and Endy, 2008). Earlier work in S. tymphimurium showed that each individual bacteria retains its characteristic chemotactic behavior throughout its lifetime (Spudich and Koshland, 1976). Our work in the yeast pheromone response (Colman-Lerner et al., 2005, see below) revealed and quantified two slow-changing sources of variation, which we called P and G. Similarly, in mammalian cells abundance of particular apoptosis regulators determines the different timing of apoptosis in individual cells (Spencer et al. 2009). The abundance of these regulators in sibling cells is similar, and thus weakly heritable (Spencer et al., 2009). Such slow-changing cell-to-cell differences in protein abundance in cultured mammalian cells can, in some cases, predict drug response outcomes (Cohen et al., 2008).
In contrast, fast-changing fluctuations in protein concentration are unpredictable. For example, in the lac operon, variability in time to induction is caused by infrequent stochastic bursts in gene expression that arise from infrequent (in the order of once per generation) unbinding of the lacI repressor from its operators on the lac promoter (Choi et al., 2008).
Work by Elowitz et al. (2002), measured expression of two different colored fluorescent proteins driven by different instances of the same artificial LacI (lac repressor) -regulated promoter (Lutz and Bujard, 1997) in populations of clonal E. coli. This work defined two quantities: “intrinsic noise", a measure of the extent to which the output of the two reporters did not correlate, and “extrinsic noise”, a measure of the remaining, correlated variation. Intrinsic noise, in most cases the smaller component, was presumed to arise from rapid-changing stochastic differences in the molecular events required for transcription and translation. Extrinsic noise was attributed to cell-to-cell fluctuations in the abundance of molecules such as regulatory proteins and polymerases. Both types of noise increased cell to cell variation in gene expression in the the cell population.
To dissect contributions to cell-to-cell variation to system output in the signaling arm of the yeast PRS, we used pairs of transcriptional reporters driven by different pairs of promoters (identical and non-identical, pheromone-inducible vs pheromone-insensitive). This experimental setup allowed us to separate cell-to-cell variation in molecular events upstream of the promoter (affecting a signal transmission or "pathway" subsystem, P) from those downstream (affecting a "gene expression" subsystem). It allowed us to further separate the contributions to variation in the gene expression subsystem caused by stochastic variation (γ) (Figure 1b) from that caused by preexisting differences in ability of cells to express proteins (G), and differences in signal transmitted by individual cells (P) (Figure 1c). We quantified variations in gene expression due to stochastic gene expression noise, γ, by comparing outputs in each cell of genes carrying α-factor-responsive promoters driving the YFP and CFP reporter genes (1b, drawn after Figure 1b in Colman-Lerner et al. 2005)). We then measure variation in pathway subsystem output (P) and expression capacity (E) in strains containing a pheromone responsive promoter driving YFP and a control promoter driving CFP reporter genes. (1c, drawn after 1c in Colman-Lerner et al. (2005)). Here, different Pathway subsystems (blue boxes) regulate the activity of the DNA-bound transcription factors, but the subsystem enabling expression of the reporter genes (red box) is the same. Variation in expression capacity, G, affects the correlated variation (the dispersion of points along the diagonal. Uncorrelated variation (the dispersion of points along the minor axis) is due to the stochastic gene expression noise, γ, and to cell-to-cell variations in the pathway subsystems for each promoter. Although this analytical framework recognized contributions to differences in transmitted signal (P) caused by pre-existing differences in the ability of cells to send signals (L) and stochastic differences in the ability of cells to send signals during the course of the experiment (λ), the experiments above do not allow us to distinguish them experimentally.
We quantified total cell-to-cell variability using the normalized variance η2
, the variance squared over the mean squared, σ2/μ2 (for G, P, E, and L, this is equivalent to the square of the coefficient of variation or CV). We also quantified three components of η2
total:“Cell-to-cell variability in gene expression capacity, G”, η2
(G) (the overall capacity of a cell to transcribe genes into mRNAs and translate those mRNAs into proteins), “stochastic variability in gene expression” or "gene expression noise", η2
(γ) (which corresponded to “intrinsic noise”), and “cell-to-cell variability in pathway subsystem output”, η2
(P). Both η2
(G) and η2
(γ) reduced the coherence in population gene expression responses. In these experiments, we found the contribution of η2(γ) or intrinsic noise was very small. Even when we eliminated variation due to cell cycle position, most variation was due to differences in P and in G (Colman-Lerner et al., 2005). As mentioned above, η2
(P) is the sum of two components, which we could not separate experimentally: η2
Three lines of evidence show that η2(P) (here called cell-to-cell variability in transmitted signal, or signaling variation) is under active control. First, pathway subsystem output P
correlates negatively with gene expression capacity G, defining a compensatory mechanism that reduces variation in transmitted signal. Second, both PRS MAPKs, Kss1 and Fus3, regulate η2(P). At low pheromone inputs, Δkss1 cells showed decreased η2(P), while at high pheromone inputs Δfus3 cells showed increased η2(P), indicating that the products of these genes control variation in transmitted signal (Colman-Lerner et al.). Third, the dose-response relation for gene
expression output and for several intermediate signaling steps matches the dose-response relation for fractional receptor occupancy (Brent). This Dose-Response Alignment (or DoRA), is a "systems level" behavior that improves the fidelity of information transmission by making downstream responses more distinguishable, and also, under some circumstances, by reducing amplification of stochastic noise η2(λ) during signal transmission (Yu et al., 2008). DoRA operates in many other signaling systems including insulin, (Cuatrecasas, 1971), angiotensin II (Lin and Goodfriend, 1970) and EGF (Knauer et al., 1984). The fact that in the PRS and other systems DoRA is present after long exposure to ligand and in the face of significant changes in the numbers of signaling molecules (Knauer et al., 1984; Thomson et al., 2011) suggests that DoRA is actively maintained. In the PRS, maintenance of DoRA requires the action of a particular negative feedback (Yu et al., 2008).
We realized that mutations affecting mechanisms that reduced variation in different components of η2(P) should have different effects on the responses of cell populations. Interference with mechanisms that reduced either component of pathway variation (η2(L) or η2(λ)) would increase cell-to-cell variability in transmitted signal and thus decrease the coherence of the response of cell populations. However, interference with mechanisms that suppressed differences in signal transmission due to the stochastic component η2(λ) (caused for example by differences in molecular collisions or other events during the course of an
experiment) would also reduce the precision in the response of individual cells. Here, we undertook a comprehensive genetic screen for genes that regulated different components of cell-to-cell variability in the yeast S. cerevisiae pheromone signaling and response. This work identified a previously unknown and unexpected role for cytoplasmic microtubules in reducing cell-to-cell variation in transmitted signal and increasing coherence of the population response. Results
Construction of a whole-genome collection of viable single gene deletions permitting screens for variation in signal transmission and response
To introduce the necessary reporters and alleles for the screen, we extended methods of genetic cross and segregant selection described previously (Tong et al., 2004). We
of MATa strains, each one of which carried a deletion in each non-essential gene in the yeast genome (about 4,100 strains) (Giaever et al., 2002, Giaever and Nislow, 2014). We then sporulated this diploid strain collection, and selected MATa haploids that carried the deletion plus our necessary reporters and alleles, resulting in a whole-genome collection suitable for the cell to cell variation screen (Figure 2a, Methods, and SI). Importantly, to ensure that all
members of this collection were clonal, derived from single founder spores, we used cultures derived from single colonies streaked from small colonies that had germinated on the 8-way selective medium used to isolate MATa haploids with the appropriate genotype. Our generation of this strain collection from single colonies stands in contrast to the usual practice of growing cultures from patches derived from thousands of germinated spores (derived from thousands of independent meioses) (Ayer et al., 2012; Jonikas et al., 2009; Neklesa and Davis, 2009; Wolinski et al., 2009). Because these cultures were clonal, we hoped to ensure genetic homogeneity. By using cultures made from independent, newly isolated small colonies in particular, we ensured that those phenotypes we observed consistently in initial screens derived from the deletions and not from unlinked second-site mutations, either pre-existing in the founder haploid deletion collection or that arose during meiosis and sporulation, that suppressed a growth defect caused by the deletion (Hittinger and Carroll, 2007). Moreover, by relying on cultures derived from freshly germinated spores generated by new meioses, we circumvented possible complications of aneuploidy (Hughes et al. 2000) and same-sex diploid formation (Giaever and Nislow 2014) that might have affected members of the starting deletion collection.
Figure 2b shows the key markers in strains in the collection. All strains carried two fluorescent protein reporters controlled by PPRM1, the promoter of the pheromone inducible gene PRM1 (PPRM1-mRFP and PPRM1-CFP) (Colman-Lerner et al., 2005) and a third fluorescent protein reporter controlled by PACT1, the promoter of the housekeeping gene ACT1 (Colman-Lerner et al., 2005) (Figure 2B). They also carried a deletion of the BAR1 protease gene, to ensure consistent extracellular pheromone concentrations, and the cdc28-as2 allele (F88A) in the CDC28 locus. The variant of Cdc28 encoded by cdc28-as2 renders the single
cyclin-dependent cell cycle kinase in yeast sensitive to inhibition by the ATP-analog 1NM-PP1 (Bishop et al., 2000). Inhibiting Cdc28 allowed us to minimize cell-cycle-dependent variation in
pheromone response and to block cell division (and thus dilution of fluorescent protein into new daughter cells) (Colman-Lerner et al., 2005).
To prepare to screen these strains for variation in signal and response, we measured mRFP and YFP signal in the reference strain SGA85 by flow cytometry after pheromone induction. (Methods, Figure 3a and 3b). We approximated the cell-to-cell variability in signal strength η2(P) as the portion of the variation in mRFP signal that did not correlate with the YFP signal
decreased monotonically with increasing pheromone input (Figure S1), consistent with our previous microscopic (image cytometric) measurements (Colman-Lerner et al., 2005). As a second test of our flow cytometric screening methods, we verified that, as previously observed, derivatives of the reference strain lacking Fus3 showed increased η2(P) at high pheromone inputs, while derivatives lacking Kss1 showed reduced η2(P) at low inputs (Figure S2).
Large-scale screen identifies genes whose products affected cell-to-cell variation in transmitted signal
We used these methods to carry out a high throughput screen for genes that, when deleted, altered η2(P). For the primary screen, we screened 1141 strains from the collection (996 randomly selected, together with an additional 145 which each bore a deletion in a non-essential kinase or phosphatase (Supplementary information, Table S1), for mutants with altered values of pathway output and/or η2(P). Screened strains corresponded to more than 1/4 of the nonessential yeast genes. Figure 3a describes the steps we followed. We grew one instance of each haploid deletion strain, plus 50 cultures of the reference strain (as controls), in log phase (less than 3 x 10⁶ cells/ ml) for at least 14 hours, and then exposed them for 3 hours to two different (0.6 nM and 20 nM) pheromone concentrations in the presence of 10 µM 1-NM-PP1. We then added 100 µg/ml cycloheximide to inhibit protein synthesis and allowed existing translated fluorescent protein molecules to mature (Colman-Lerner et al., 2005; Gordon et al., 2007) (Figure 3a), and took other steps to ensure accuracy and consistency of measurement described in SI. We measured fluorescent signal by flow cytometry as shown in Figure 3b. From these measurements, we calculated values for 5 variables of interest shown in Table 1. These were: Average output (O), cell-to-cell variability in output, η2(O), median output of the PACT1 constitutive reporter (an estimate of G), cell-to-cell variability in this output, η2(G), and cell-to-cell variability in transmitted signal, η2(P), at each of the two pheromone doses.
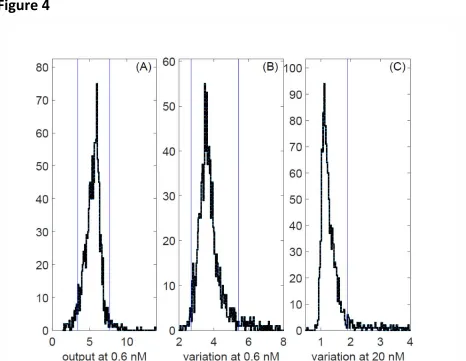
We selected for follow up studies all gene deletions that exhibited high or low median pheromone system output (O) (Figure 4a) or significantly higher or significantly lower η2(P) than the reference strain at the low dose (Figure 4b), and strains that showed higher η2(P) than the
these verification experiments, we also quantified PRS gene expression noise η2(γ) using the two reporters (CFP and mRFP) driven by PPRM1. The tested mutants showed values of η2(γ) that were typical of the reference strain. The only significant differences were in O, η2(O), and η2(P). Mutant genes define different axes of quantitative system behavior
To gain insight into the different phenotypes caused by these gene deletions, we clustered the mutant strains based on the 5 variables we had measured by flow cytometry at low and high doses (Table 1 and Table S2). We treated as separate entries the measurements from each of the three or four isolates of each gene deletion included in our secondary screens (each representing a clone of isogenic cells descending from a different isolated haploid spore, see SI) and the 19 instances of measurements for the reference strain. To generate the clusters, we used an uncentered Pearson correlation and average linkage method. All 19 cultures of the reference strain grouped together in one cluster (cluster I), along with the replicas from the ∆fus1 deletion, which showed a weak phenotype (Figure 5).
Analysis of data from the deletion strains showed a number of results. First, the quantitative phenotypes caused by the 50 mutations fell into clusters and subclusters. Significantly, almost all replicates of a given gene deletion grouped at least in the same
subcluster, suggesting that differences among strains with different gene deletions were not the result of variability caused by experimental errors or artifacts. Second, the pathway and gene expression output variables (O and G) were sometimes affected by different genes than the “cell-to-cell variability” variables (η2(O), η2(G), η2(P)). For example, cluster II is comprised of all the entries with low pathway output (O) and low gene expression output (G). Within this cluster there are subclusters with high (IIa), low or unchanged η2(O) and η2(G) (IIb and IIc). Also note cluster III, which contains cases with high pathway (O) and gene expression (G) output and low cell-to-cell variability for pathway and gene expression. Within cluster III, subcluster IIIa is defined by low η2(P) and subcluster IIIb by high η2(P) at the low pheromone dose. Such genetic independence strongly suggests the existence of distinct mechanisms independently controlling the two types of quantitative phenotypes (output and variability) and disfavoring an
interpretation in which variability is inextricably linked to output strength. Rather, output and variation in output emerged as independent axes of system behavior, subject to independent regulation, and independently affected by genetic changes (see Discussion).
A second feature in the clustering results is that mutations in related genes cause similar patterns of change in their set of quantitative measurements. This was expected and reassuring. For example, deletions of duplicated paralogs of ribosomal protein genes are grouped in
subclusters IIa and IIb (distinguished by their different variation phenotypes) and those for the two PRS MAPKs, FUS3 and KSS1, are together in cluster IV. By analogy with dataset clustering studies based on gene expression data and other phenotypes, we expect that the gene deletions that shared a cluster or subcluster membership would share mechanistic functions in the control of quantitative phenotypes in the PRS.
Figure 6 presents an alternative representation of output variables and variability variables for the 50 strains. In it, we plotted O vs. P (estimated as O/G) at low dose (6a), η2(P) vs P at low dose (6b), and η2(P) vs P at high dose (6c). These results again show that different genes affect each of these quantities differently.
Two gene deletions with higher signaling variation affect microtubule function
Due to our interest in a possible model, in which the action of cytoplasmic microtubules decreased variation in transmitted signal by maintaining the cell nucleus at a constant position within a gradient of signal (discussed in Pesce et al. 2), we selected two genes affecting
cytoplasmic microtubule function, BIM1 and GIM4 for further study. One gene, BIM1 affects attachment and function of the microtubule plus end to the signaling site. The other, GIM4, encodes a prefoldin subunit that affects microtubule function. We first verified the effects of these mutations by remaking them in a clean genetic background. To do so, we constructed a new reference strain, GPY4000 (see SI) that carried a pheromone responsive PPRM1-mCherry reporter and a second constitutive reporter, PBMH2-YFP reporter, and remade the deletion mutations in this clean background and again measured the variables defining quantitative system performance. Figure 7 shows average values of measurements by flow cytometry of η2(P) vs. O, i.e. of signaling variation vs. cumulative PRS output, of populations from the remade ∆bim1 and ∆gim4 single deletion strains, and a ∆bim1 ∆gim4 double mutant. In these deletion strains, expression of the constitutive PACT1 reporter was not affected (not shown). However, in these strains, signalin variation, η2(P), was increased similarly in both deletion strains, across all pheromone doses. Figure 7 shows this result, with η2(P) and system output O measured at different pheromone doses. This result is in contrast to our results in the original flow
cytometric screen, in which ∆gim4 only increased η2(P) at low doses. In ∆bim1 ∆gim4 cells, the increase in η2(P) was more than twice as large as the measured effect of the two individual deletions (Figure 7). This is thus an epistatic interaction (as defined by Fisher (1918)) suggesting that two gene products might have independent effects on signaling variation.
Discussion
Genes that suppress cell-to-cell variability in system output. We carried out a
mutants that affected system output, total transmitted signal, and cell-to-cell variation in those quantities. The fact that we found mutants that affected variation in transmitted signal is in contrast to some previous work, which found that deletion of genes affecting histone deactylation and ubiquitylation affected expression noise (Weinberger et al. 2012) affected expression noise from different promoters differently.
High quality whole-genome variation deletion collection. We created a MATα strain, SGA88, closely genetically related to strains in the haploid deletion collection (Chu and Davis, 2007) that carried reporters needed to quantify cell-to-cell variation in signaling and response, all linked to selectable markers. We mated SGA88 to a fresh instance of the original collection (a gift of Amy Tsong and Charlie Boone) to create a collection of more than 4,100 diploid strains (Pesce
Heterozygote Deletion Diploid Variation collection (PHDDVC)). To use this PHDDVC collection, we sporulated each diploid strain on medium that selected for cells of the MATa mating type, for the deletion, and for the five additional genetic elements needed to carry out the assay. We then grew multiple individual cultures of clonal haploid cells from different small colonies arising from each meiosis. By passing the haploid deletions in the starting deletion collection through diploids and then sporulating those into a fresh haploid deletion collection containing our reporters, we ensured that consistently observed phenotypes were due to the deletions and not from unlinked mutations, including faster-growing mutations pre-existing in wells in the Chu and Davis collection (Hittinger and Carroll, 2007) or arising during meiosis. Moreover, by assaying cultures freshly derived from new meioses, we ensured the phenotypes derived from euploid cells that did not carry second site suppressor mutations, by avoiding contamination of slow-growing gene deletion mutant strains by faster slow-growing aneuploid or second site suppressor variants (Hughes et al. 2000) and same-sex diploid variants (Giaever and Nislow, 2014) which are known to be present in wells of the Chu and Davis collection. This use of multiple freshly
generated clonal cultures derived from independent meioses to diminish possible effects of unintended genetic heterogeneity is novel, and we hope relevant for subsequent quantitative studies of cell-to-cell variation and other subtle phenotypes measured in populations of different deletion mutants.
High precision high-throughput screen. We then devised high throughput means to search for mutants that affected cell-to-cell variation. These methods built on our previous microscopic cytometry work (Bush and Colman-Lerner; Colman-Lerner et al., 2005; Gordon et al., 2007), and on flow cytometry work by Newman and Weissman (Newman et al., 2006). By using flow cytometry, we compensated for differences in exponential growth rates of cells with different mutations, and accurately measured single-cell fluorescence from cultures that spanned a 10-fold range of cell concentrations. They included a number of steps to lower measurement errors sufficiently to unmask the effects of mutations on different components of variation. These included the use of multiple reporters with different colored readouts,
using cycloheximide to fix the cells and arrest protein translation, thus allowing time for all translated fluorophores to mature (Gordon et al., 2007) and also enabling us to “freeze” the assays at a precise time after system induction. By these means, we assayed the effects of more than 1100 deletions of nonessential genes, including strains bearing deletions in all 145 non-essential yeast protein kinases and phosphatase coding genes, and in 900 randomly selected genes. From these, we identified 50 genes that changed PRS output O, increased cell-to-cell variation in PRS output, η2(O), or increased cell-to-cell variation in signal transmission, η2(P). We hope that these methodological tricks might find use in other settings, for example in reducing measurement error and allowing dissection of sources of variation in studies of signaling and gene expression in mammalian cells directed toward genetic understanding, or toward identification of drugs (eg. drugs affecting gene expression from integrated proviruses such as HIV-1 (Dar et al., 2014)).
Axes and epistasis groups. We clustered the 50 mutants under study into functional classes. To do so, we used a distance measure of each strain's quantitative phenotypes
including total PRS output, O, gene expression capacity, G, and variation in these numbers. This analysis showed that different sets of genes independently affected quantitative measures of transmitted signal, system output, and global gene expression capacity, and variability in these quantities. Further analysis showed that the effects of some mutants were specific to absolute level of these quantities, or to variation in them, establishing them as "axes" of quantitative system behavior whose values may depend on different cellular mechanisms. In their
complexity, the results of this first order algorithmic classification were evocative of early-phase results of other mutant screens, for example the hunts for genes specifically required for anterior-posterior and dorsal ventral development in Drosophila melanogaster larvae (see Nüsslein-Volhard, 1979) and the assignment of DNA repair genes in yeast to different "epistasis groups". In those cases, continued analysis led to simplification, and eventually to elaboration of the molecular mechanisms that determine the anterior-posterior and dorsal ventral axes in
Drosophila, (Nüsslein-Volhard, 1987) and genetic and biochemical demonstration of independent mechanisms of DNA repair (Friedberg et al. 1995). In a companion paper, we discuss how our identification of genes that specifically affect η2(O) and η2(P) in the PRS adds to the list of other genes and loci recently identified in yeast, Arabidopsis thaliana, maize, and mice that reduce (canalize) the standard deviation of quantitative traits, rather than their mean values.
unexpected genes as key players in processes, but cannot always shed much light on their action. However, previous studies of cytoplasmic microtubules offer tantalizing clues to how these genes might act to reduce variation. During the pheromone response, a microtubule bridge connects the signaling site on the cell membrane with the cell nucleus, where genes are induced. Bim1 and Kar3/Cik1 attach microtubule plus ends to the signaling site and, by promoting polymerization and depolymerization, alternately push the nucleus away from the signaling site and pull the nucleus towards it. This alternation ensures that the nucleus localizes to a defined cellular location at the base of the mating protrusion (Maddox et al., 2000; Maddox et al., 2003). We wondered whether microtubule function might reduce variation in transmitted signal by mechanically positioning the nucleus within a gradient of signal originating at the signaling site. In a companion paper, we describe experiments to test this idea, and to
determine the microtubule dependent process(es) necessary for reduction of signaling variation.
Methods
General methods for cultivation of yeast strains and plasmid constructions are detailed in Supplemental Information.
Analysis of cell-to-cell variation. We performed the analysis as in Colman-Lerner et al. (2005). Briefly, we considered the system output for any given cell Oi, determined by the abundance of a fluorescent protein inducible by the pheromone response system, to be the product of i) the average pathway subsystem output per unit time, Pi (which varies with input pheromone dose), ii) the expression subsystem output Ei, and iii) the duration of stimulation ΔT (Colman-Lerner et al., 2005), as follows:
Oi = Pi(αF) x Ei ΔT
We considered Pi and Ei to be the sum of the capacity of the subsystem in each cell (Li and Gi) plus stochastic fluctuations in the operation of each subsystem during the course of an experiment (λi and γi). Thus,
Oi = (Li(αF)+ λi ) x (Gi + γi) ΔT
We defined the cell-to-cell variation in system output as the normalized variance of Oi, η2(O), decomposable into the sum of individual sources a correlation term (Colman-Lerner et al., 2005), as follows,
η2(O) = η2(L) + η2(λ) + η2(G) + η2(γ) + 2ρη(L)η(G)
signal transmitted P in individual cells as the normalized signal from the pheromone inducible PPRM1 reporter (O) divided by the one the signal from the constitutive control promoter, (PACT1 or PBMH2, depending on the strain) (O/G). We estimated η2(P) as the variance in the difference between the normalized abundances of two fluorescent proteins, one driven by the PPRM1 promoter and the other by the constitutive, pheromone-independent promoter (PACT1 or PBMH2, depending on the strain) ( ).This variance is actually equal to η2(P)+ η2(γ), but η2(γ) was low enough in the WT and the 42 mutants in which we measured it (see SI) to assume that it may be neglected (Colman-Lerner et al., 2005).
Construction of Heterozygous Diploid Deletion Collection and its use to generate sets of haploid deletion strains for screening. We constructed a MATα strain, SGA88, which carried two pheromone inducible reporter genes, one constitutive reporter gene, a bar1- mutation which blocked a protease that removed pheromone from the extracellular medium, and a cdc28-as2 mutation which allowed us to block the inhibition of the pheromone response by the cell cycle machinery by adding to the cells a chemical inhibitor of the mutant protein kinase. In SGA88 all of these genetic elements and the MATa marker were linked to individually selectable recessive (nutritional auxotrophy) or dominant (antibiotic resistance) markers. We mated SGA88 to a fresh instance of the original ("1.0") haploid deletion collection (Chu and Davis, 2007, a gift of Amy Chu) to create the Pesce Heterozygous Deletion Diploid Variation collection
(PHDDV collection), comprised of more than 4,100 diploid strains. In these diploid strains, three dominant resistant markers: hygBR, G418R, NatR, and two recessive markers His3 and Leu2, allowed selection of genetic elements, while two dominant sensitivity markers: Canavanines (due to the CAN1 allele) and ThialysineS (due to the LYP1 allele) allowed selection against unsporulated diploids. We then sporulated different members of the PHDDV collection on appropriate selective medium to generate haploids that bore the deletion and the other genetic markers needed for the screen. We picked these as individual small colonies on selective plates and assayed individual cultures grown from these colonies.
To screen for mutants that affected cell-to-cell variation in pathway output, we grew cells in log phase (<3-106 cells/ ml) for at least 14 hours. This step is in contrast to the standard practice of diluting carbon-exhausted cultures 4-6 hours prior to measuring them. By relying on
exponential phase cultures we minimized undesired variability in PRS output arising from strain-to-strain and day-to-day differences in time to enter the exponential growth phase. We
exposed our cultures for 3 h to two different pheromone concentrations (0.6 nM or 20 nM) and 10 µM cdc28-as2 inhibitor 1-NM-PP1. We then added 50 µg/ml cycloheximide to inhibit protein synthesis and allowed for existing translated fluorescent protein molecules to mature (Colman-Lerner et al. 2005, Gordon et al. 2007). To aid the mutant screen and follow-up experiments, we measured the maturation times of mRFP (strain collection) and mCherry (follow up
experiments) after blocking protein synthesis with cyclohexamide as in Gordon et al (Gordon et al., 2007) (not shown). Measured 1/2 time to maturation was 120 mins (RFP) and 45 mins (mCherry).
σ2
(
We measured fluorescent signal from the PPRM1-mRFP and PACT1-YFP reporters by cytometry (BD LSRII with HTS auto-sampling attachment) and calculated or estimated parameters of interest, such as system output Oi and cell-to-cell variation in signal transmission, η2(P), as described above. We then verified (by cytometry) altered behaviors in three additional clonal isolates from the same mating, as described above. We confirmed by PCR in a random strain from the set of four for the presence of the expected deletion and the absence of the wild type coding
sequence. We checked this strain by image cytometric fluorescent microscopy at the two different doses to confirm lack of aggregation and to measure PPRM1-CFP signal. Measurement of CFP signal allowed us to determine if the mutants affected η2(γ). As described, η2(γ) was a small contributor to cell-to-cell differences in gene expression and no mutant affected it. Author contributions
GP designed and constructed the strain collection, performed the screen, analyzed the results and characterized the selected mutants. DR assisted in this work. GP and SZ designed and performed the microtubule perturbation experiments. WP analyzed the numerical data in Figure 6D. RCY contributed to experimental design, data analysis and earlier versions of the
manuscript. RB, GP and AC-L directed and guided the work and its interpretation. GP, AC-L and RB wrote the paper and guarantee the integrity of its results.
Acknowledgements
We are grateful to Amy Tong, Charlie Boone, Guri Giaever and Corey Nislow for strains, plasmids, advice, and previously unpublished information for constructing our strain collection, Steve Andrews, Alexander Mendenhall, and Alan Bush for valuable discussions throughout. Work was supported by R01 GM097479 to RB. Earlier work received support from grants R01 GM086615 to RB and RCY and from P50 HG002370 to RB.
References
Ayer, A., Fellermeier, S., Fife, C., Li, S.S., Smits, G., Meyer, A.J., Dawes, I.W., and Perrone, G.G. (2012). A genome-wide screen in yeast identifies specific oxidative stress genes required for the maintenance of sub-cellular redox homeostasis. PLoS One 7, e44278.
Bishop, A.C., Ubersax, J.A., Petsch, D.T., Matheos, D.P., Gray, N.S., Blethrow, J., Shimizu, E., Tsien, J.Z., Schultz, P.G., Rose, M.D., et al. (2000). A chemical switch for inhibitor-sensitive alleles of any protein kinase. Nature 407, 395-401.
Brent, R. (2009). Cell signaling: what is the signal and what information does it carry? FEBS Lett 583, 4019-4024.
Bush, A., and Colman-Lerner, A. (2013). Quantitative Measurement of Protein Relocalization in Live Cells. Biophysical journal 104, 10.
Choi, P.J., Cai, L., Frieda, K., and Xie, X.S. (2008). A stochastic single-molecule event triggers phenotype switching of a bacterial cell. Science 322, 442-446.
Cohen, A.A., Geva-Zatorsky, N., Eden, E., Frenkel-Morgenstern, M., Issaeva, I., Sigal, A., Milo, R., Cohen-Saidon, C., Liron, Y., Kam, Z., et al. (2008). Dynamic proteomics of individual cancer cells in response to a drug. Science 322, 1511-1516.
Colman-Lerner, A., Gordon, A., Serra, E., Chin, T., Resnekov, O., Endy, D., Pesce, C.G., and Brent, R. (2005). Regulated cell-to-cell variation in a cell-fate decision system. Nature 437, 699-706. Cuatrecasas, P. (1971). Insulin--receptor interactions in adipose tissue cells: direct measurement and properties. Proc Natl Acad Sci U S A 68, 1264-1268.
Dar, R.D., Hosmane, N.N., Arkin, M.R., Siliciano, R.F., and Weinberger, L.S. (2014). Screening for noise in gene expression identifies drug synergies. Science 344, 1392-1396.
Delbrück, M. (1945). The burst size distribution in the growth of bacterial viruses (bacteriophages). J Bacteriol 50, 131-135.
Dohlman, H.G., and Thorner, J.W. (2001). Regulation of G protein-initiated signal transduction in yeast: Paradigms and Principles. AnnuRevBiochem 70, 703-754.
Elf, J., Li, G.W., and Xie, X.S. (2007). Probing transcription factor dynamics at the single-molecule level in a living cell. Science 316, 1191-1194.
Elowitz, M.B., Levine, A.J., Siggia, E.D., and Swain, P.S. (2002). Stochastic gene expression in a single cell. Science 297, 1183-1186.
Giaever, G., and Nislow, C. (2014). The yeast deletion collection: a decade of functional genomics. Genetics 197, 451-465.
Gordon, A., Colman-Lerner, A., Chin, T.E., Benjamin, K.R., Yu, R.C., and Brent, R. (2007). Single-cell quantification of molecules and rates using open-source microscope-based cytometry. Nat Methods 4, 175-181.
Hittinger, C., and Carroll, S. (2007). Gene duplication and the adaptive evolution of a classic genetic switch. Nature 449, 677-681.
Hughes, T.R., Roberts, C.J., Dai, H., Jones, A.R., Meyer, M.R., Slade, D., Burchard, J., Dow, S., Ward, T.R., Kidd, M.J., et al. (2000). Widespread aneuploidy revealed by DNA microarray expression profiling. Nat Genet 25, 333-337.
Jonikas, M.C., Collins, S.R., Denic, V., Oh, E., Quan, E.M., Schmid, V., Weibezahn, J., Schwappach, B., Walter, P., Weissman, J.S., et al. (2009). Comprehensive characterization of genes required for protein folding in the endoplasmic reticulum. Science 323, 1693-1697.
Lieb, M. (1953). The establishment of lysogenicity in Escherichia coli. J Bacteriol 65.
Lin, S.Y., and Goodfriend, T.L. (1970). Angiotensin receptors. The American journal of physiology 218, 1319-1328.
Lutz, R., and Bujard, H. (1997). Independent and tight regulation of transcriptional units in Escherichia coli via the LacR/O, the TetR/O and AraC/I1-I2 regulatory elements. Nucleic Acids Res 25, 1203-1210.
Maddox, P.S., Bloom, K.S., and Salmon, E.D. (2000). The polarity and dynamics of microtubule assembly in the budding yeast Saccharomyces cerevisiae. Nat Cell Biol 2, 36-41.
Maddox, P.S., Stemple, J.K., Satterwhite, L., Salmon, E.D., and Bloom, K. (2003). The minus end-directed motor Kar3 is required for coupling dynamic microtubule plus ends to the cortical shmoo tip in budding yeast. Curr Biol 13, 1423-1428.
McAdams, H.H., and Arkin, A. (1997). Stochastic mechanisms in gene expression. Proc Natl Acad Sci U S A 94, 814-819.
Neklesa, T.K., and Davis, R.W. (2009). A genome-wide screen for regulators of TORC1 in response to amino acid starvation reveals a conserved Npr2/3 complex. PLoS Genet 5, e1000515. Newman, J.R., Ghaemmaghami, S., Ihmels, J., Breslow, D.K., Noble, M., Derisi, J.L., and Weissman, J.S. (2006). Single-cell proteomic analysis of S. cerevisiae reveals the architecture of biological noise. Nature.
Novick, A., and Weiner, M. (1957). Enzyme induction as an all-or-non phenomenon. Proc Natl Acad Sci U S A 43, 553-556.
Paliwal, S., Iglesias, P.A., Campbell, K., Hilioti, Z., Groisman, A., and Levchenko, A. (2007). MAPK-mediated bimodal gene expression and adaptive gradient sensing in yeast. Nature 446, 46-51. Ricicova, M., Hamidi, M., Quiring, A., Niemistö, A., Emberly, E., and Hansen, C.L. (2013). Dissecting genealogy and cell cycle as sources of cell-to-cell variability in MAPK signaling using high-throughput lineage tracking. Proceedings of the National Academy of Sciences of the United States of America 110, 11403-11408.
Sigal, A., Milo, R., Cohen, A., Geva-Zatorsky, N., Klein, Y., Liron, Y., Rosenfeld, N., Danon, T., Perzov, N., and Alon, U. (2006). Variability and memory of protein levels in human cells. Nature 444, 643-646.
Spencer, S.L., Gaudet, S., Albeck, J.G., Burke, J.M., and Sorger, P.K. (2009). Non-genetic origins of cell-to-cell variability in TRAIL-induced apoptosis. Nature 459, 428-432.
Spudich, J.L., and Koshland, D.E., Jr. (1976). Non-genetic individuality: chance in the single cell. Nature 262, 467-471.
Thomson, T.M., Benjamin, K.R., Bush, A., Love, T., Pincus, D., Resnekov, O., Yu, R.C., Gordon, A., Colman-Lerner, A., Endy, D., et al. (2011). Scaffold number in yeast signaling system sets tradeoff between system output and dynamic range. Proc Natl Acad Sci U S A 108, 20265-20270. Tong, A.H., Lesage, G., Bader, G.D., Ding, H., Xu, H., Xin, X., Young, J., Berriz, G.F., Brost, R.L., Chang, M., et al. (2004). Global mapping of the yeast genetic interaction network. Science 303, 808-813.
Weinberger, L.S., Burnett, J.C., Toettcher, J.E., Arkin, A.P., and Schaffer, D.V. (2005). Stochastic gene expression in a lentiviral positive-feedback loop: HIV-1 Tat fluctuations drive phenotypic diversity. Cell 122, 169-182.
Wolinski, H., Petrovic, U., Mattiazzi, M., Petschnigg, J., Heise, B., Natter, K., and Kohlwein, S.D. (2009). Imaging-based live cell yeast screen identifies novel factors involved in peroxisome assembly. J Proteome Res 8, 20-27.
Yu, J., Xiao, J., Ren, X., Lao, K., and Xie, X.S. (2006). Probing gene expression in live cells, one protein molecule at a time. Science 311, 1600-1603.
Tables and their legends
Table 1. Variables measured in isogenic cell populations Variable name Short Expression Calculated as Median pheromone
response system (PRS) output
O, <PPRM1-mRFP> or
<PPRM1-mCherry>
median(inducible RFP)
Median constitutive or control output
G, <PACT1-XFP> or
<PBMH2-XFP>
median(constitutive XFP)
Cell-to-cell variability in PRS output
η2
(O), η2(PPRM1-mRFP)
or η2
(mCherry)
Cell-to-cell variability in constitutive or control output (representing general gene expression capacity)
η2
(G), η2
(PACT1-YFP) or
η2
(PBMH2-YFP)
Cell-to-cell variability in signal transmission
η2
(P), or η2(L+λ)
Signal strength P O/G
Table 1 legend. σ2 is variance, µ is average, <B> means the average of B
Table 2. Genes found in the screen
Gene
name ScreenImportant for Description
ARG82 UnB AA metabolism Inositol polyphosphate multikinase
EVR46 UnB Cargo transport ER vesicle protein, component of COPII complex; required for membrane fusion
HIS1 UnB AA metabolism ATP phosphoribosyltransferase
UGA1 UnB AA metabolism Gamma-aminobutyrate (GABA) transaminase
SLA1 UnB Actin binding
Cytoskeletal protein binding protein; required for assembly of the cortical actin cytoskeleton
SAP155
K&P Cell cycle
Protein required for function of the Sit4 protein phosphatase
YER068C-A UnB
Dubious open reading frame
Dubious open reading frame/ overlaps with ARG5, ARG6 Acetylglutamate kinase and N-acetyl-gamma-glutamyl-phosphate reductase
YIL032C UnB Dubious open reading frame Dubious open reading frame / next to BCY1
ERG3 UnB Ergosterol biosynthesis C-5 sterol desaturase
GAL83
K&P
Glucose repression
One of three possible beta-subunits of the Snf1 kinase complex
GUP1 UnB
Glycerol metabolism, protein folding
Plasma membrane protein involved in remodeling GPI anchors
σXFP
2 /μ
XFP
2
σYFP
2 /μ
YFP
2
σ
2mRFP
i<
mRFP
>−
YFP
i<
YFP
>
PPZ1
K&P Ion homeostasis
Serine/threonine protein phosphatase Z, isoform of Ppz2p; involved in regulation of potassium transport, which affects osmotic stability, cell cycle progression, and halotolerance
FUS1 UnB Mating Membrane protein localized to the shmoo tip
AAT2 UnB Metabolism Cytosolic aspartate aminotransferase involved in nitrogen metabolism
PTC6 K&P Metabolism Mitochondrial type 2C protein phosphatase (PP2C)
GIM4 UnB
Microtubule chaperone/ Protein folding
Subunit of the heterohexameric cochaperone prefoldin complex
PAC10
GIM2 UnB
Microtubule chaperone/
Protein folding Subunit of the heterohexameric cochaperone prefoldin complex
BIM1 UnB
Microtubule end
binding Microtubule plus end-binding protein
MSH1 UnB Mitochondrial homeostasis E. coli MutS homolog, binds DNA mismatches, required for mitochondrial function
BUB1
K&P mitosis
Protein kinase required for cell cycle checkpoint, delays entry into anaphase until kinetochores bound by opposing microtubules
ELM1 K&P morphogenesis Serine/threonine protein kinase that regulates cellular morphogenesis HSL1 K&P morphogenesis Nim1-related protein kinase; regulates the morphogenesis and septin checkpoints
NUP60 UnB nuclear transport
FG-nucleoporin component of central core of the nuclear pore complex
SXM1 UnB nuclear transport Nuclear transport factor (karyopherin)
CBR1 UnB respiration Microsomal cytochrome β reductase
RTC3 UnB RNA metabolism Protein of unknown function involved in RNA metabolism
CKA1 UnB signaling Alpha catalytic subunit of casein kinase 2 (CK2)
CKB1 UnB signaling Beta regulatory subunit of casein kinase 2 (CK2)
CKB2 K&P signaling Beta' regulatory subunit of casein kinase 2 (CK2) FUS3 K&P signaling Mitogen-activated serine/threonine protein kinase (MAPK), part of PRS HOG1 K&P signaling Mitogen-activated protein kinase involved in High Osmolarity (HOG) pathway
KSS1
K&P signaling
Mitogen-activated protein kinase (MAPK); functions in PRS and signal transduction pathways that control filamentous growth and pheromone response
PBS2 K&P signaling MAP kinase kinase of the HOG signaling pathway SSK2 K&P signaling MAP kinase kinase kinase of HOG1 signaling pathway
FAR1 UnB
signaling/cell cycle/polarization
CDK inhibitor, nuclear anchor, recruited by Ste18-Ste4 at polarity patch
SIP1 UnB signaling/glucose repression Alternate beta-subunit of the Snf1 protein kinase complex
KAR4 UnB signaling/mating Transcription factor required for activation of some pheromone responsive genes
STE50 UnB signaling/mating
SKY1
K&P splicing
SR protein kinase (SRPK); varied functions, regulates proteins involved in mRNA metabolism and cation homeostasis, helps some LexA fusion proteins bind operator
KIN3 K&P stress Nonessential serine/threonine protein kinase; possible role in DNA damage response OCA1 K&P stress Protein tyrosine phosphatase; required for cell cycle arrest in response to oxidative damage of DNA CTK1 K&P transcription regulation Catalytic (alpha) subunit of C-terminal domain kinase I (CTDK-I); phosphorylates RNA pol II
DEP1 UnB transcription regulation
Component of the Rpd3L histone deacetylase complex, variously needed for activation and repression, regulates DNA replication origin timing
SUM1 UnB transcription regulation
Transcriptional repressor that regulates middle-sporulation genes; required for mitotic repression of middle sporulation-specific genes; also acts as general replication initiation factor; involved in telomere maintenance, chromatin silencing
SWI5 UnB transcription regulation Part of Mediator and Swi/Snf nucleosome remodeling complexes
UME6 UnB transcription regulation
Meiotic transcription regulator, DNA binding, recruits variously Sin3/ Rpd3 repressor (HDAC) and Ime1 activator.
RPL12A UnB Translation Ribosomal 60S subunit protein L12A
RPL19B UnB Translation Ribosomal 60S subunit protein L19B
RPL34A UnB Translation Ribosomal 60S subunit protein L34A
ECM15 UnB unknown
Possibly tetrameric, nonessential protein, unknown function
VPS64 UnB Vacuole metabolism Required for cytoplasmic proteins to enter vacuole The 50 genes from the 886 strains in the unbiased (UnB) screen and the 145 strains in the nonessential kinase and phosphatase screen (K&P) screen that showed altered PRS system output (O), low or high cell-to-cell variability in transmitted signal (η2(P)) at low pheromone
(0.6 nM), or high variability in (η2(P)) at high (20nM). Table shows gene name, screen from
Figures and Figure Legends
Figure 1
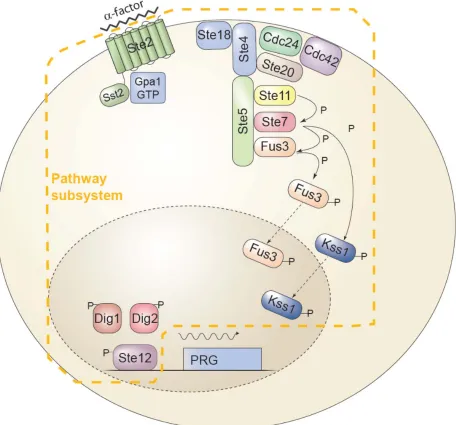
Figure 1. The yeast Pheromone Response System (PRS).
pathways. A seven-helix transmembrane receptor, Ste2 in the MATa cell depicted, causes the dissociation of the α subunit of a trimeric G-protein, Gpa1, from the βγ dimer, Ste4/Ste18. This event causes the recruitment to the plasma membrane of the scaffold protein Ste5, leading to the assembly and activation of the MAP kinase cascade (MAPKKK Ste11, MAPKK Ste7 and the Erk1/2-like MAPKs Fus3 and Kss1 (Dohlman and Thorner, 2001). In the cytoplasm, activated Fus3 and Kss1 regulate targets including Ste5 (Bush and Colman-Lerner, 2013; Yu et al., 2008), and in the nucleus, they activate Ste12 (Tedford et al., 1997). These events comprise the Pathway subsystem, P; i.e. the subsystem that transmits the signal to the promoters of inducible genes. Activation of Ste12 leads to the induction of approximately 100 pheromone responsive genes (PRGs) (Roberts et al., 2000) and their expression via the Expression subsystem E (defined in the text). The events comprising E include transcription initiation, mRNA elongation and processing, nuclear export and mRNA decay, and cytoplasmic protein translation. The total system output— the amount of fluorescent reporter protein
O
produced in any celli
—depends on the product ofP , E , and the duration of stimulationΔ
T
, with P itself dependent on α-factor concentrations. P and E are each split into an average component and a stochastic component: E = G + γ and P = L + λ. In each case the stochastic component is indicated by a Greek letter. The following equations describe the relationships among these quantities:( )
(
)
(
)
( )
( )
( )
( )
( )
(
) ( ) ( )
F
2 2
2 2 2 2 ,
i i i
i i
i i
i i i i
i i i
i P L
L O L T T G L E O G G G
γ
η γ
ρ
η
η
λ
λ
η
η
α
η
η
= × × Δ = Δ × = + + + + + +The function
η
2()
is defined as the ratio of the variance of the indicated quantity to the square of the mean of the corresponding average component. So, forO
,G
, and L,η
2()
isequivalent to the square of the coefficient of variation (C.V.), but for the stochastic components
-
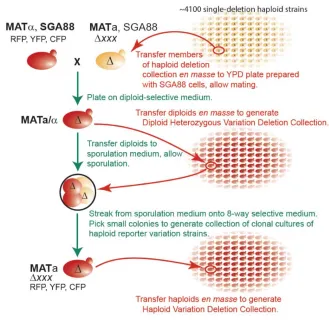
Figure 2. Strain modification protocol and generation of haploid reporter collection.
A. High throughput generation of reporter and gene-deletion bearing strains. We crossed the BY4742 derivative SGA88b (MATα Δcan1::PMFA1-LEU2 Δbar1-orf::PPRM1-CFP--HIS3
∆bar1-promoter::ura3-terminator ∆lyp1::PACT1-YFP--URA3 ∆prm1::PPRM1-RFP--NAT(MX4)
cdc28-F88A--hph(HygBr)(MX4)) to strains in yeast MATa haploid deletion collection (Δxxx::G418 (MX6))where xxx is the deleted yeast gene) using 384 pinning tools (see SI),. We sporulated the resulting diploids, and selected spores of the desired genetic makeup: MATa Δxxx Δcan1::PMFA1-LEU2
Δbar1-orf::PPRM1-CFP--HIS3 ∆bar1-promoter::ura3-terminator ∆lyp1::PACT1-YFP--URA3
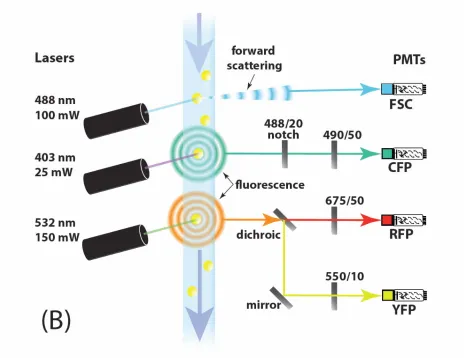
Figure 3. High throughput genetic screen for mutants in signal variation η2(P), signal strength P, or system output O.
A. Flow chart showing steps in screening for strains altered in pathway variation or output.
B. Light path enabling three-color flow cytometric genetic screen. Forward-scattering of 488 nm laser light indicates the presence of cells (yellow), while fluorescence in three separate wavelength bands indicates the quantity of cyan, red, and yellow fluorescentreporterproteins within cells. Photomultiplier tubes detected scattering and fluorescence intensities and
Figure 4
Figure 4. A-C.Selection of mutants for follow up studies. Plots show distributions of values for 991 randomly selected non-essential deletion strains, and 102 additional strains with deletions of a non-essential kinase or phosphatase, and 2 wild-type strains. Values were derived from flow cytometry data obtained after 3h of stimulation with pheromone. Blue vertical bars indicate the thresholds used to select mutants for secondary screens (see SI).
A. PRS output, O (median mRFP signal from pheromone inducible reporter gene), in 0.6 nM pheromone.
B. Estimated signal variation η2(P) in 0.6 nM pheromone
D-E. Signal variation versus output for all 1093 strains screened. Plots show an estimate of
Figure 5
pheromone and 5 after induction with 0.6 nM pheromone): O (pheromone system output), G (gene expression output), η2(O) (cell-to-cell variability of the pheromone system output, the CV2 of the mRFP signal), η2(G) (cell-to-cell variability of the gene expression output, the CV2 of the YFP signal) and η2(P) (cell-to-cell variability in pheromone signal transmission, . The panel shows these values as a "heat map", from
red (higher than the median) to green (lower than the median) through black (equal to the median).
There were five main clusters (left, labeled I though V) and 1 to 3 subclusters (right). The signature pattern for each cluster or subcluster is represented with a color bar with 10 blocks, one for each measurement (grey indicates that that the measurement may take any value). Rightmost column shows representative deletion strains for each subcluster. Table S2 lists the data before transformation and Table S3 lists the clustered, log transformed and median centered dataset. Table S6 shows microscope data that complement these flow cytometer data for 44 of these 50 mutant strains selected for clustering.
σ
2mRFP
i<
mRFP
>−
YFP
i<
YFP
>
Figure 6
Figure 6. System output and signal variation vs. transmitted signal for signal and output variation strains. For the 50 mutants selected from the screen for further study, figure shows
Figure 7
Figure 7. Deletions of BIM1 and GIM4 in clean genetic background increase signal variation at all outputs.
Figure shows dose-dependent changes in pathway variation and cumulative transmitted signal in carefully reconstructed single- and double-deletion mutants. Plots show η2(P) as a function of O. Data were collected from dose response flow cytometry measurements of reference (GPY4000), Δbim1 (GPY4001), Δgim4 (GPY4031), and ∆bim1 ∆gim4 (GPY4036) (bearing the
Figure S1
Figure S1. Time dependent output and Dose-Response of the reporter genes used in the screen. We stimulated SGA85 cells with the indicated concentrations of pheromone and measured the accumulated fluorescent protein by flow cytometry as detailed in Methods.
A, B. Average fluorescence output of the pheromone-inducible PPRM1-mCherry reporter (A) and the constitutivePACT1-YFP reporter (B), in A.U., measured at four different doses over time.
C. Estimating cell-to-cell variation in the activity of the pathway (η2(P)). Panel shows a plot of the pheromone-induced reporter (PPRM1-mRFP) output and a constitutive reporter (PACT1-YFP) output in 500 cells of the reference strain (SGA85) stimulated with 20 nM pheromone for 3 h. For each cell, the amount of pathway variation (η2(P) + η2(γ)) (a quantity very close to η2(P), see SI) is the distance of each each cell from the identity line, drawn in pink.
Figure S2. Genes encoding the MAPKsKSS1 and FUS3 affect pathway variation. Flow
cytometry measurements of reference (here called “WT”, GPY4000, grey), Δkss1 (GPY4038, left panels)and Δfus3 (GPY4004, right panels) strains (bearing PPRM1-mCherry and PBMH2-YFP
reporters), stimulated for 3 h with the indicated pheromone doses. Plots show values of different system measurements (see Table 1 and SI) vs. pheromone dose for three biological replicates of each strain. For each plot, red color along the horizontal bar indicates 0.95
confidence statistical significance of differences at the corresponding dose, as assessed by T test. Green color indicates no significance.
A. Variation in transmitted signal (estimated by η2(P)+η2(γ)).
B. Estimated P, that is, O/G
C. Cell-to-cell variation in PRS system output, η2(O), measured as output of PPRM1-mCherry reporter.
1. Yeast strains 3
1.1 General methods 3
1.2 Strains used in different sets of experiments 3 1.2.1 Construction of MATα partner to be mated with the deletion collection 3 Track 1. Construction of the MATa parent of SGA88 3
Starting strain 3
Replacement of the BAR1 ORF with a CFP pheromone-responsive reporter
and a selectable marker 3
Replacement of the PRM1 ORF with a YFP pheromone-responsive reporter
and a selectable marker 4
Change of mating type to MATa 4 Switch of ∆bar1 marker from URA3 to HIS3. 5 Addition of ∆can1::PMFA1-LEU2 marker 5 Change in DNA elements near PPRM1-CFP reporter to correct for decreased
expression and increased variation caused by colliding polymerases 6 Introduction of a constitutive control reporter 7 Track 2. Construction of the MATα parent of SGA88 6 8
Starting strain 8
Insertion of a selectable cdc28-as2 allele 8 Insertion of a PPRM1-mRFP reporter 9 Generation of SGA88 from Track 1 and 2 strains 9 1.2.2 Construction of a gene deletion library containing required reporters
and selectable markers 10
Mating of SGA88 with the deletion collection, and subsequent sporulation 10
Diploid selection: 11
Haploid selection: 11
Selection of clonal haploids and assembly of the library for the flow
cytometry-based screen 11
1.2.3 Reference strains used for controls for genetic perturbations in followup studies 12 Base strain with constitutive reporter (GPY4000) 12 Base strain derived from SGA85 (SGA101) 12 1.2.4 Strains used for follow up studies 12
Gene deletion strains 13
2. High throughput growth, pheromone stimulation and flow cytometry screen 13 2.1 High throughput growth and pheromone treatment of 96-format arrayed yeast colonies 13
Growth to exponential phase: 13
2.2. Primary screen, selection of mutants and follow-up studies 14
2.2.1 Primary screen 14
2.2.2 Selection of mutants from primary screen 15
2.2.3 Secondary screens 15
Repeated assays on the same independently isolated segregants 15 Assays on three independently isolated segregants 15 Microscope cytometry assays for gene expression noise and morphology 16 Protocol for microscopy assay 16 3. Pheromone dose-response experiments 17
5. Derivation of formula for estimation of signal variation 18
1. Yeast strains
1.1 General methods
We performed DNA manipulation including PCR and subcloning as described (Ausubel et al., 1987-2016). We cultured and manipulated yeast as described (Ausubel et al., 1987-2006; Guthrie and Fink, 1991). Unless otherwise noted, we grew cells in synthetic dextrose complete (SDC) media consisting of Brent Supplemental Media (MP Biomedicals, Solon, OH), yeast nitrogen base without amino acids and ammonium sulfate (BD, Franklin Lakes, NJ), and dextrose (Sigma-Aldrich, St Louis, MO).
1.2 Strains
We describe constructions of these strains and plasmids below. We also list We list strains used in this study in Table S4.
1.2.1 Construction of SGA88, the MATα partner to be mated with the deletion collection.
We generated a library of haploid MATa gene-deletion mutants containing the modifications listed in Figure S1b. To do this we first constructed MATα strain SGA88 containing the genetic elements needed for our screen (PPRM1-RFP, PPRM1-CFP, PACT1-YFP, cdc28-as2 and ∆bar1), each marked with a different
selectable marker. SGA88 also had a “cassette” (∆can1::PMFA1-LEU2)carrying a MATa-specific marker
(PMFA1-LEU2) that allowed positive selection of descendant haploid MATa cells and two recessive drug
resistant markers (∆can1 and ∆lyp1) that allowed negative selection of diploids and parental MATa cells (see more on the selection process below).
We constructed SGA88 in two separate, parallel tracks. Track 1 resulted in a MATa strain. Track 2
began with and resulted in a MATαstrain. We introduced a subset of the desired modifications into strains from these tracks and then combined them into a single haploid strain isolated after mating and sporulation.
Track 1. Construction of MATa parent of SGA88
Starting strain
The starting strain for Track 1 was MATα strain y3656 (a generous gift from Amy Tong and Charlie Boone) carrying a ∆can1::PMFA1-HIS3-- PMFalpha1-LEU2 cassettein the BY4742 (MATα) background. BY4742
is his3∆1 leu2∆0 ura3∆0 lys2∆0.
We constructed plasmid pBUPC by inserting a 200 bp cassette in the HindIII site of pRS406. This cassette was composed of 100 bp of BAR1 locus sequence immediately upstream of the start ATG codon (PBAR1), 100 bp of sequence immediately downstream of the stop codon (TBAR1) and a linker with an Ase I
site in between them. The relevant segment of pBUPC had the following orientation:
Hind III – TBAR1 (3’ – 5’)—Ase I site—PBAR1 (5’ – 3’) – Hind III – Eco RI
We then inserted a PPRM1-CFP-TADH1 pheromone transcriptional reporter cassette in the marked EcoRI
site of pBUPC, yielding plasmid pBUPC-PRM1-YFP. When cut with Ase I pBUPC-PRM1-YFP yielded the following linear DNA molecule:
TBAR1 (3’ – 5’)—--URA3--- PPRM1-CFP-TADH1-- PBAR1 (3’ – 5’)
(arrows denote direction of transcription initiating at the noted promoters)
We transformed y3656 with AseI-linearized pBUPC to obtain strain SGA10. We confirmed proper integration at the BAR1 locus by PCR and tested that the strain was phenotypically bar1 and had a pheromone-inducible CFP reporter.
Replacement of the PRM1 ORF with a YFP pheromone-responsive reporter and a selectable marker
We introduced a second, different colored, pheromone-inducible fluorescent protein reporter in SGA10. To do this we replaced the PRM1 ORF with the following DNA piece obtained by amplifying the YFP- NAT resistance cassette from a plasmid from the e collection by PCR (Goldstein and McCusker, 1999;
Longtine et al., 1998).
PRM1-5’ (-50 to –1 from ATG)— YFP-TADH1---NAT r-- PRM1-3’ (+1 to +50 from STOP)
We transformed this PCR product into SGA10, selected for NAT resistance and confirmed integration by PCR. We also confirmed that the resulting strain had now both CFP and YFP pheromone inducible reporters. We named this strain SGA30.
Change of mating type to MATa
MATa
∆can1::PMFA1-HIS3-- PMFalpha1-LEU2
∆bar1:: TBAR1 (3’ – 5’)—--URA3--- PPRM1-CFP-TADH1-- PBAR1 (3’ – 5’)
∆prm1:: (PPRM1)YFP-TADH1---NAT r
LYS2
met15∆0
We named the resulting strain SGA31.
Switch of ∆bar1 marker from URA3 to HIS3
When making SGA31, we discovered that haploid colonies from the sporulated diploid growing in uracil/ histidine drop-out plates with NAT contained both uracil auxotrophic and prototrophic
segregants. We hypothesized, and then demonstrated, that ura3 auxotrophic segregants were able to scavenge uracil derived from their URA3 neighbors in the colony. Since our plan for generating a modified deletion collection depended on our ability to stringently select only strains that carried the
∆bar1::PPRM1-CFP reporter, we decided to not rely on URA3 to select strains. We therefore resolved to
replace the URA3 marker for this reporter with a HIS3 marker. We knew