© 2017 IJSRSET | Volume 3 | Issue 6 | Print ISSN: 2395-1990 | Online ISSN: 2394-4099 Themed Section: Engineering and Technology
Radiative forcing determination depending on MISR data and
Fu-Liou
Model
Islam Maher Amin
*1, T.A.Sayad
2, A.S.Zakey
1, and F.Elhossiny
2*1Egyptian Meteorological Authority, Ministry of Aviation Kobry El Qoba El-Kalefa Al-mamoon st.,Cairo, Egypt
2
Al-Azhar University, Faculty of Science, Astronomy and Meteorology Department, Cairo, Egypt
ABSTRACT
Atmospheric aerosols particles exert significant direct radiative forcing and this plays an important rule of climate and climate change. Aerosols particles can affect the radiation budget and the temperature by changing the energy balance and distribution of solar and terrestrial radiation in the atmosphere. This paper discusses aerosols distribution over Middle East and North Africa and their influences on Radiative Forcing (RF) which consequently affect the radiation budget and try to find out an alternative method to obtain data of AOD else that obtained from Aeronet with acceptable error. These data can be used as input for RTM model (Fu-Liou) to determine RF. Thus RF can be calculated anywhere over the study area and not only at Aeronet stations. For this purpose Aerosol properties data from several Aeronet stations and corresponding data from MISR satellite in the focused region for long term have been retrieved and analyzed to verify MISR data; then data of Aeronet used to feed Fu-Liou model to simulate irradiances in the shortwave range under cloud-free conditions. Radiative Forcing estimated from Fu-Liou model have been compared with daily RF data of year 2015 over Egypt from Aeronet. As well as, average seasonal RF outputs from Fu-Liou model over North Africa and Middle East have been compared with the Aeronet RF at the surface and top of atmosphere for the different four seasons. The results illustrated that data from MISR satellite is coincide with Aeronat data with acceptable error while the average error of RF values from the Fu-Liou model and Aeront at wavelength 550nm is 10 % on surface and 7 % at top of atmosphere relative to Aeront when the prevailing type of aerosols is dust. While this ratio, increases to be from 14 to 19% on surface and from 17 to 22% at top of atmosphere for the different cases of aerosol types. This study is considered as an important attempt to find out method to determine RF at any where over the focused area and not only at Aeronet stations also this paper addressed the percentage of different types of aerosols during different situations and it documented the horizontal distribution of aerosols optical properties and its radiative forcing over the selected region.
Keywords: Aerosol Optical Depth, Aerosol Robotic network, Angstrom, Earth’s energy budget and Radiative Forcing.
I.
INTRODUCTION
Desert dust aerosols have a substantial influence on the atmospheric environment of the Middle East (e.g. Osipov et al., 2015; Kalenderski, 2013 and Stenchikov, 2016). The Middle East is centrally located in the so-called dust belt (Astitha et al., 2012) and strongly influenced by natural sources. The high atmospheric dust concentrations near the Earth’s surface are reflected in high aerosol optical depth (AOD) levels (e.g., Hsu et al., 2012). Polluted dust can significantly enhance
atmospheric heating (Mishra et al., 2014), especially by intense incoming solar radiation that is typical in the Middle East. On the other hand, chemical ageing in polluted dust air masses transported over long distances can increase deposition rates of dust particles (Abdelkader et al., 2015).
data, e.g., from Sea- WiFS (Hsu et al., 2012), MODIS, MISR and AERONET (de Meij et al., 2012; de Meij and Lelieveld, 2011). Zhang et al. (2013) used coupled chemical transport radiation and radiative transfer model to study the impact of vertical profile dust on global radiative forcing estimation. They found that, the vertical distributions of dust particles strongly affected the estimated radiative forcing at the TOA and the surface. The differences of dust vertical profile not only impacted on the radiative forcing, but also changed the atmospheric heating rate.
Atmospheric aerosols particles divided to primary and secondary aerosols; where primary aerosols are emitted directly at the source, and secondary aerosols are generally formed from gaseous precursors by various gas and aqueous phase oxidation pathways. Primary aerosols include, for example, fly ash activities, sea-salt particles emitted at the ocean surface (Zakey, et al., 2008), or mineral dust aerosol that is emitted by the effects of wind erosion on arid land (Zakey et al, 2006), the reflection of radiation to space may counteract the greenhouse warming by cooling the earth system (Charlson et al,1992) and the distribution of radiation is expected to change the temperature profile (Alpert et al.1998), the atmospheric stability and possibly cloud formation (Ackerman et al. 2000),so besides altering air quality (Wilson and Spengler, 1996; Prospero, 1999) aerosols affect atmospheric radiation transfer directly by scattering and absorbing light, and indirectly by influencing cloud formation. Because of the variety of aerosol sources, their short atmospheric residence time, and the dynamic processes that may alter them after generation, the physical and chemical characteristics of airborne particles are highly inhomogeneous in space and time, One of reasons for this variability is that dust optical properties at origin, as issued by the sources, are influenced by the potential changes during the path of the air masses as well as by the local aerosol properties at the reception site ( Bauer et al., 2011 ). Close to the source regions, mostly pure dust is found, but after long-range transport the aging of dust and mixing with other aerosol types modify the optical properties of Desert Dust “DD” (e.g. Bauer et al., 2011). Though, in situ ground-level measurements traditionally considered as the most reliable for aerosol characterization must undoubtedly be performed, more global and continuous observations providing a better spatial and temporal coverage are needed (Dubovik et al.,2002a). Aerosols
optical Properties reflect the differences in chemical or mineralogical composition. Results obtained at Aeronet sites where dust is a dominating aerosol component (e.g., Solar Village in Saudi Arabia and Bahrain in the Persian Gulf; Dubovik et al., 2002a), this consistent with reported in the literature for the major mineral species present in mineral dust, namely quartz and clay minerals. These minerals do not absorb light. For the background aerosol, this aerosol type being mainly produced by combustion processes (industry and traffic) and, hence, particularly rich in fine and very absorbing black carbon particles. Finally pollution-like component is in-between the ones of the other two. This aerosol type is also an efficient absorber, that it is produced by biomass-burning activities. Combined with the differences in size distribution, the finest aerosol component (background pollution) is the one for which the aerosols extinction coefficient (α) is expected to be the large. The objective of this study is to document the distribution of aerosols and its types over North Africa and Middle East by using particular criteria.
II.
DATA AND METHODOLOGY
MISR aerosol AOD products were more accurate than MODIS AOD products as they had higher correlation and lesser root mean square error.
MISR AOD Data: There are nine push broom cameras in MISR sensor having capability of global coverage every nine days with a polar orbital height of 705-km in descending polar orbit. There are 1504 photoactive pixels plus 16 light-shielded pixels in one Charge-Coupled Device (CCD line array, each 21 µm by 18 µm). Each line array is filtered to provide one of four MISR spectral bands. The spectral band shapes are approximately Gaussian and centered at 446nm, 558nm, 672nm, and 866 nm. While the available output data are in format hdf so, these output data analyzed to obtain AOD558nm and Angstrom446-867nm for a location of
resolution of 0.5km X 0.5km and these selected locations corresponded to the 20 stations that mentioned in Table 1.
Figure 1: Geographical map of study area with locations of AERONET stations.
Available data started from 2006 up to 2016 for monthly mean AOD at wavelength 500nm and Angstrom coefficient within 440 to 670 nm wavelength band under cloud-free conditions for 20 stations Table 1 distributed over Middle East and north of Africa as figure1 has been retrieved from The Aeronet.
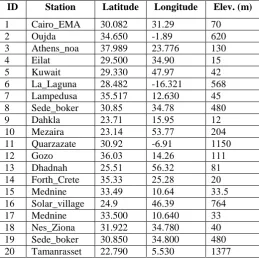
TABLEI
LOCATIONANDELEVATIONFORSELECTED AERONETSTATIONS
ID Station Latitude Longitude Elev. (m)
1 Cairo_EMA 30.082 31.29 70 2 Oujda 34.650 -1.89 620 3 Athens_noa 37.989 23.776 130 4 Eilat 29.500 34.90 15 5 Kuwait 29.330 47.97 42 6 La_Laguna 28.482 -16.321 568 7 Lampedusa 35.517 12.630 45 8 Sede_boker 58.03 57.40 708 9 Dahkla 15.42 23.53 21 10 Mezaira 15.27 35.44 187 11 Quarzazate 30.92 -6.91 2238 12 Gozo 50.85 27.10 222 25 Dhadnah 13.32 30.51 02 27 Forth_Crete 53.55 13.10 18 23 Mednine 55.75 28.07 55.3 20 Solar_village 17.5 70.55 407 17 Mednine 33.500 10.640 33 18 Nes_Ziona 31.922 34.780 40 19 Sede_boker 30.850 34.800 480 20 Tamanrasset 22.790 5.530 1377
A. Method
A spatial analysis of AOD and Angstrom was performed during the four seasons to identify their characteristics in each season through determining the location of maximum and minimum concentrations of pollutants. The AOD and Angstrom data were used as inputs for the Fu-Liou model which has been run for several times, firstly the data were classificated seasonally so the results were undesirable then it classificated according to specific cases mentioned in Table 2 to reach the best concentration of the different types of aerosols corresponding to their respective classifications and then to validate Fu-Liou output with the corresponding values over Cairo station from Aeronet during 2015.
Scatter Plot for AOD and Angstrom was done to study the natural distribution of both of them and to clarify the abnormal cases.
A spatial analysis of Fu-Liou output was made for the values of the radiative forcing at the top of the atmosphere and the surface of the Earth compared to their values from the Aeronet.
A vertical distribution of the four seasons was carried out at four different stations representing East, West, North and Central Region.
TABLE
II CRITERIA AND PERCENTAGE OF AEROSOLS TYPESCases AOD Angstrom Types of aerosols Ratio of aerosols types
1 AOD≥ 0.7 Angstrom ≤0.5 Dust 100% dust 2
0.4≤ AOD <0.7
a)Angstrom<1 relatively turbid by dust 80% dust, 10% sulphate , 10% soot b)1≤ Angstrom increasing in the ratio of soot 50% Dust, 40 %Soot, 10% Sulphate 3 AOD < 0.4 a)Angstrom >1 mixed of different aerosols 60% Dust , 20% soot , 20 % Sulphate
b) 1≤ Angstrom relatively clear 50% Dust , 30% Soot, 20 % Sulphate
B. FU-LIOU Model description
FU-Liou Radiative Transfer Model (RTM) is used to estimate radiative forcing (RF) at top and surface of atmosphere. A high-order accurate radiative transfer (RT) model developed by Fu and Liou has been implemented into the Navy Operational Global Atmospheric Prediction System (NOGAPS) to improve the energy budget and forecast skill. The Fu–Liou RT model is a four-stream algorithm (with a two-stream option) integrating over 6 shortwave bands and 12 long wave bands. The Fu–Liou calculates nongray gaseous absorption in the multiple-scattering inhomogeneous atmosphere using the correlated-k distribution method of probability integration introduced by Lacis and Oinas (1991). The largest solar heating rate was consistent with the maximum of dust VRAOD due to the absorption by dust particles.
TABLEIII
INPUTSDATANEEDEDTORUNFU-LIOUMODEL
ID Parameter Name Parameter Definiation
1 Aerosol optical thickness
AOD of 550 nm
2 Angstrom Angstrom of 440-675 nm 3 Cosine of solar
zenith angle
COS= 0.5
4 Albedo From 1.5 to 3 for this area 5 Number of
aerosols types
Number of aerosols types that compose the atmospheric aerosols
6 Aerosols ratio in atmosphere
The percentage of each type of aerosols expected to compose the existence aerosols and this ratio depends on the vales of aerosol optical properties. 7 Type of
atmosphere (atmos)
Which contains: pressure, temp., wv mixing ratio, and O3. Fu-liou model Estimates radiative forcing (RF) at 35 vertical pressure levels staring from top to bottom of atmosphere at the surface. Atmos = winter
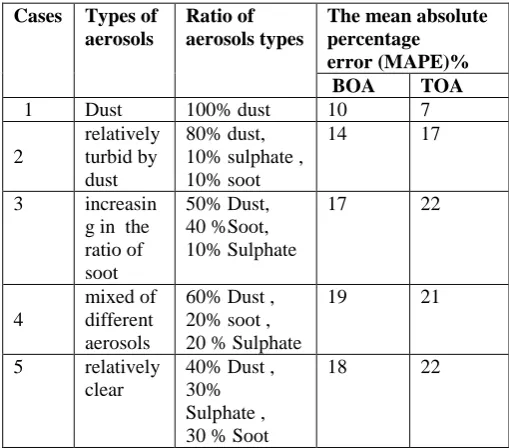
The Fu-Liou model was run according to the classifications listed in Table 2 above Cairo Station during 2015 where this process of running the model must have basic input data that indicated in Table 3.
The mean absolute percentage error (MAPE) is used to measure the accuracy of Fu-Liou model output statisticaly, and it defined by the formula:
Where At is the actual value of RF from Aeronet and Ft is the determined value by Fu-Liou model.
The difference between At and Ft is divided by the Actual value At again. The absolute value in this calculation is summed for every determined point and divided by the number of fitted points n Multiplying by 100 makes it a percentage error.
III.
RESULTS AND DISCUSSION
The data of AOD and Angstrom have been analyzed to determine the dominant types of Aerosols exist in the study area.
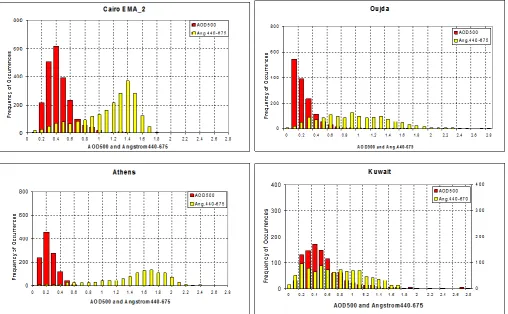
A. Frequency of occurrences of AOD500nm and
Angstrom(440–675)
Daily data from the beginning of 2010 to the end of 2016 used to find the frequency of occurrence of AOD500nm and Angstrom(440–675) for four different
Whereas, in the west of selected area (Oujda) the dominant aerosols is case 3(a) i.e. mixed types of aerosols. While in the north of selected area (Athens) the dominant aerosols is case 3(b) i.e. clear atmosphere and Finally in the east of selected area (Kuwait) the dominant aerosols is case 2(a) i.e. turbid by dust. This conclusion addressed the dominant aerosols over selected area in general so it is needed to study and analyze seasonal spatial AOD and Angstrom for the selected region to be more accurate in describing and identifying aerosols types.
TABLEIV
MAXIMUMFREQUENCYOFOCCURRENCESOF AOD500ANDANGSTROM(440–675)
station
Max. Frequency
AOD500 Angstrom(440-670)
Cairo 0.4 1.4 Oujda 0.2 0.9 Athens 0.2 1.7 Kuwait 0.5 0.2
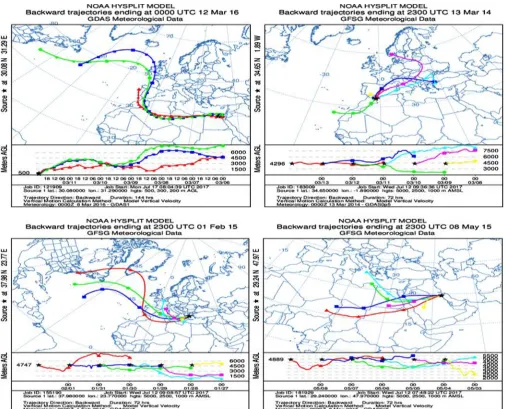
B. Back trajectories of Aerosols
Figure 3: Six days Back-trajectories for four stations representing the various climate of the study area.
Back-trajectories have been made for four stations representing the various climate of the study area to determine the sources of these aerosols, noted those days selected when AODs were of extreme values.
From figure 3, it can be noted that; in the middle of selected area (Cairo) on March 12, 2016 AOD was 2.98 and Angstrom was -0.0187 the main sources of aerosols in this case were air masses came from western desert over all pressure height levels these air masses caused the existence of coarse dust over Cairo, while in the west of selected area (Oujda) on March 13, 2014 AOD was 3.63 and Angstrom was 0.0047 the main sources of aerosols in this case were air masses came from north
and east of Europe in higher pressure height levels while an air mass on surface came from west Africa.
The north of selected area (Athens) on Feb1, 2015 AOD was 1.68 and Angstrom was -0.026 the main sources of aerosols
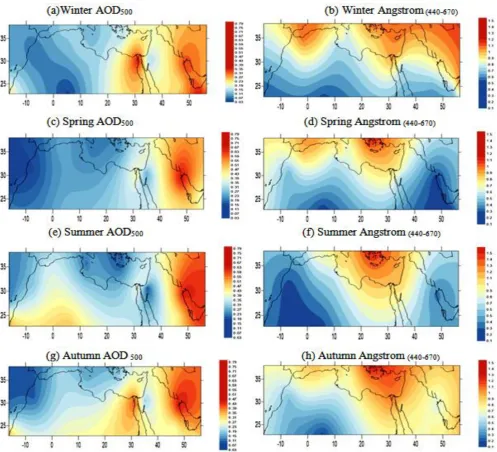
C. AOD and Angstrom analyses
Seasonal spatial AOD and Angstrom analysis for the selected region are represented in Fig4. The winter season is characterized by the highest values of the AOD
on each of the Arabian Gulf and Egypt with values around 0.4, while the lowest values are located between 0o-10o E; at the same time the highest values of Angstrom are located north of the study area and gradually decrease to the south.
Figure 4: Seasonal average for AOD500 to the left and Angstrom(440-670) to the right during available data from 2006
to 2016
AOD values during spring are concentrated in the northern Arabian Gulf while the lowest values achieved over the Atlantic and West Africa accompanied by the lowest values of the Angstrom over Arabian Gulf and from 0o-10o E, while the highest values are between 20o-30oE north of 35oN. Summer is characterized by the highest values of the AOD over the Arabian Gulf east of 45oE, while the lowest values between 20o-30o E and north of 35oN accompanied by low values of the
D. Verification of MISR data with Aeronet data for AOD550nm (Green)
From figures (5) and (6) it can be noted that the values of AOD550 of MISR satellite are coincide with the
corresponding values of Aeronet for most of stations
along all the seasons but there are some differences over Arabian gulf for all seasons and over Cairo specially in winter and spring this differences may be due to the influences of cloud or some significant missed data in Aeronet while these figures represent average seasonal AOD550 for long period (2010 - 2016).
Figure 5: Seasonal average Aeronet AOD550 to the left and MISR Satellite AOD550 to the right during available data
Figure 6: Seasonal average of Aeronet AOD550 and MISR AOD550 at each station during the same period
Figure 7 shows that Angstrom values of MISR satellite are coincide with the values of Aeronet for most of stations along all the seasons but there are some
differences over Athens and Forth-crete for most seasons but these differences are not significant and don’t affect on the criteria of Aerosols types.
E. Verification of Fu-Liou model over Cairo station during 2015
AOD Aeronet daily data overall 2015 at Cairo station has been used as input data for Fu-Liou model. The model has been run for this year under the criteria of aerosols types mentioned in table (2) to determine the radiative forcing at bottom (BOA) and top (TOA) of atmosphere. Outputs RF of the model were compared with their corresponding data from Aeronet as in Fig 8. The figure shows that most values of radiative forcing at bottom of atmosphere vary from -50 to -90 w/m2 except at the mid of January decreased to -140 w/m2 nearly coincident between the Aeronet and the output of the model Fig (8 a). While it decreased at the top to -50 w/m2 along the season Fig (8b). It is noticed that spring season has the same behave as winter at surface with nearly the same values of RF with different aerosols
concentration at different times. In addition the negative values of radiative forcing have significant decrease at the top than in winter. At the start and the end of summer season the values of RF reach to about -100 W/m2 at the surface while it reaches to about -20W/m2 at the top. The concentration of aerosols attained to its maximum with maximum RF -240W/m2 and -100 W/m2 during sever dust storm with the beginning of autumn season (September 10, 2015) at bottom and top of atmosphere respectively. Also the season has maximum concentration of some types of aerosols than the other seasons. The results showed that there was a significant coincident between the results of the model and the data of the Aeronet with the mean absolute percentage error (MAPE) ranging from 7-22% at the top of the atmosphere and between 10-19% at the Earth's surface as shown in the table 4.
TABLEV
AVERAGEABSOLUTEPERCENTAGEERROROF FU-LIOUOUTPUTFOREACHCASES
Cases Types of aerosols
Ratio of aerosols types
The mean absolute percentage error (MAPE)%
BOA TOA
1 Dust 100% dust 10 7
2
relatively turbid by dust
80% dust, 10% sulphate , 10% soot
14 17
3 increasin g in the ratio of soot
50% Dust, 40 %Soot, 10% Sulphate
17 22
4
mixed of different aerosols
60% Dust , 20% soot , 20 % Sulphate
19 21
5 relatively clear
40% Dust , 30% Sulphate , 30 % Soot
18 22
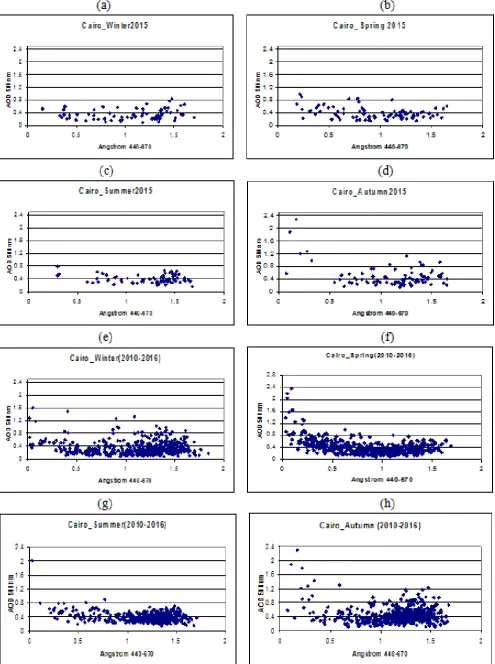
F. AOD and Angstrom over Cairo station during the period 2006 2016.
The normal distributions of both AOD and Angstrom as scatter plot diagram for each season are obtained in figure (9). Seasonal distribution over Cairo city during 2015 is shown in figure (9) from a to d while the seasonal distribution for long period (2006-2016) is obtained from e to h of the same figure. The values greater than 1.2 AOD with Angstrom below 0.5 show large concentration of dust in the atmosphere especially in autumn season (dust storm in September10, 2015) figure (9d). Where, AOD and Angstrom are normally distributed around 0.4 AOD and from 0.2 to 1.6 Angstrom. During long period spring and autumn seasons have extreme events with approximately 100% dust especially above 1.2 AOD and below 0.5 Angstrom figure (9f, h).
G. Long period spatial comparison between Aeronet and Fu-Liou model
Same criteria's as in table 2 are applied during the period 2006-2016 over Middle East and North Africa to determine the radiative forcing at surface and top of atmosphere using Fu-Liou Model. The results are compared with the data from Aeronet during four seasons and the (MAPE) for RF between Fu-Liou output and Aeronet data are represented in Figure (10).
The MAPE between the RF of the model and the Aeronet data decreases in the eastern region east of 30° E and the error increases westward at the surface, at the same time the model almost coincides with Aeronet data over the northeastern of study region at the top of the atmosphere while increasing on the rest of the region during the winter.
The spring season is characterized by a nearly large coincident over the study area at the surface with little error not more than 15% and also at the top of the atmosphere, except west of 10° E and south-east of the Mediterranean.
The model coincides with the data of the Aeronet by error of not more than 10% south of 30° N and the error increases over the Northwest of the study area at the surface while the model almost coincides with the data of the Aeronte over most of the study area except the south-east Mediterranean and Western Italy at the top The atmosphere is in the summer.
IV.CONCLUSION
Sand or Dust Storm "SDS" is one of the important weather phenomena that considered as a major source of coarse aerosols in the atmosphere. This study examines the dust aerosol radiative forcing over North Africa and Middle East region. The main concern of this study is to find out an alternative method to obtain data of AOD and Angstrom (MISR- satellite) else that obtained from Aeronet with acceptable error and these data can be used as input data for RTM model (Fu-Liou) to determine Radiative forcing (RF) and discuss the optical properties of aerosols over the Middle East and North Africa depending on Aeronet data and Fu-Liou Radiative transfer model; Also conclude a new category of AOD and Angstrom to different types of Aerosols; study the impact of different concentration of Aerosols on radiative forcing at surface and top of atmosphere, and provide a capability to determine RF at any where over the focused area. The results show the following most important conclusions:
I) Analyzes of MISR data coincide with Aeronet data over area of study with acceptable error.
II) The (MAPE) of RF from Fu-Liou model and Aeronet fluctuated from 10 to 18% at surface while from 7 to 22% at top of atmosphere according to our assumptions criteria.
III) The (MAPE) of RF tends to be very small (7-10%) in case of completely atmospheric dust at top and surface of atmosphere respectively table (4).
IV) The (MAPE) of RF gradually increases if there a mix of different types of dust with different ratios as a result from table (4).
V) The use of Fu Liu model showed that the percentage of dust in the atmosphere must not be less than 50% from the other types of aerosols in focused area.
V.
REFERENCES
[1] Abdelkader, M., Metzger, S., Mamouri, R. E., Astitha, M., Barrie, L., Levin, Z., and Lelieveld, J. 2015: Dust–air pollution dynamics over the eastern Mediterranean, Atmos. Chem. Phys., 15, 9173– 9189, doi:10.5194/acp-15-9173-2015,.
[2] Ackerman, A. S., O. B. Toon, D. E. Stevens, A. J. Heymsfield, V. Ramanathan, and E. J. Welton (2000): Reduction of tropical cloudiness by soot, Science, 288, 1042 – 1047.
[3] Alpert, P., Y. J. Kaufman, Y. Shay-El, D. Tanre´, A. da Silva, S. Schubert, and J. H. Joseph (1998): Quantification of dust-forced heating of the lower troposphere, Nature, 395, 367 – 370.
[4] Astitha, M., Lelieveld, J., Abdel Kader, M., Pozzer, A., and de Meij, A. (2012): Parameterization of dust emissions in the global atmospheric chemistry-climate model EMAC: impact of nudging and soil properties, Atmos. Chem. Phys., 12, 11057–11083, doi:10.5194/acp-12-11057-2012,
[5] Bauer, E. Bierwirth, M. Esselborn, A. Petzold, A. Macke, T. Trautmann, M. Wendisch 2011
[6] Airborne spectral radiation measurements to derive solar radiative forcing of Saharan dust mixed with biomass burning smoke particles Tellus, 63B, pp. 742–750
[7] Charlson.RJ, Schwartz Hales.J.M Cess,RD.Coakley Jr,JA. Hansen, .J.E.Hofman.DJ.1992.Climate forcing anthropogenic aerosols, science 255,423-430 [8] De Meij, A., Pozzer, A., and Lelieveld, J.: Trend analysis in aerosol optical depths and pollutant emission estimates between 2000 and 2009, Atmos. Environ., 51, 75–85, 2012.
[9] Dubovik, O., B. N. Holben, T. F. Eck, A. Smirnov, Y. J. Kaufman, M. D. King, D. Tanre, and I. Slutsker (2002a), Variability of absorption and optical properties of key aerosol types observed in worldwide locations, J. Atmos. Sci., 59, 590 – 608, doi:10.1175/1520-0469 (2002) 0:VOAAOP,2.0.CO;2.
[11] Hsu, N. C., Gautam, R., Sayer, A. M., Bettenhausen, C., Li, C., Jeong, M. J., Tsay, S.-C., and Holben, B. N.: Global and regional trends of aerosol optical depth over land and ocean using SeaWiFS measurements from 1997 to 2010, Atmos. Chem. Phys., 12, 8037–8053, doi:10.5194/acp-12-8037-2012, 2012.
[12] Kalenderski, S., Stenchikov, G., and Zhao, C. (2013): Modeling a typical winter-time dust event over the Arabian Peninsula and the Red Sea, Atmos. Chem. Phys., 13, 1999–2014, doi:10.5194/acp-13- 1999-2013,
[13] Lacis.A.A and V. Oinas, (1991): A description of the correlated k distribution method for modeling nongray gaseous absorption, thermal emission, and multiple scattering in vertically inhomogeneous atmospheres. J. Geophys. Res., 96, 9027–9063. [14] Mishra.A, K. Klingmueller, E. Fredj, J.
Lelieveld, Y.Rudich, I. Koren (2014): Radiative signature of absorbing aerosol over the eastern Mediterranean basin Atmos. Chem. Phys., 14 , pp. 7213-7231.
[15] Osipov, S., Stenchikov, G., Brindley, H., and Banks, J. (2015): Diurnal cycle of the dust instantaneous direct radiative forcing over the Arabian Peninsula, Atmos. Chem. Phys., 15, 9537– 9553, doi:10.5194/acp-15-9537-2015.
[16] Pozzer, A., de Meij, A., Yoon, J., Tost, H., Georgoulias, A. K., and Astitha, M. (2015): AOD trends during 2001–2010 from observations and model simulations, Atmos. Chem. Phys., 15, 5521– 5535, doi:10.5194/acp-15-5521-2015,.
[17] Prospero, J.M., (1999): Long-term measurements of the transport of African mineral dust to the Southeastern United States: Implications for regional air quality. Journal of Geophysical Research 104(D13):15,917–15,927.
[18] Wilson, R., and J. Spengler (Eds.) (1996): Particles in Our Air: Concen- trations and Health Effects, 254 pp., Harvard Univ. Press, Cambridge, Mass.
[19] Zakey, A. S., F. Solmon, , and F. Giorgi, (2006): Implementation and testingof a desert dust module in a regional climate model, Atmos.Chem. Phys., 6, 4687–4704, doi:10.5194/acp-6-4687,
[20] Zakey, A. S., F. Giorgi, , and X. Bi, (2008): Modeling of sea salt in a regional climate model: Fluxes and radiative forcing, J. Geophys. Res., 113, D14221, doi:10.1029/2007JD009209,.