Reliability and Data Density in High Capacity Color
Barcodes
?Marco Querini and Giuseppe F. Italiano
University of Rome “Tor Vergata” via del Politecnico 1, 00133 Rome, Italy
[email protected] [email protected]
Abstract. 2D color barcodes have been introduced to obtain larger storage capa-bilities than traditional black and white barcodes. Unfortunately, the data density of color barcodes is substantially limited by the redundancy needed for correcting errors, which are due not only to geometric but also to chromatic distortions intro-duced by the printing and scanning process. The higher the expected error rate, the more redundancy is needed for avoiding failures in barcode reading, and thus, the lower the actual data density. Our work addresses this trade-off between reliability and data density in 2D color barcodes and aims at identifying the most effective al-gorithms, in terms of byte error rate and computational overhead, for decoding 2D color barcodes. In particular, we perform a thorough experimental study to identify the most suitable color classifiers for converting analog barcode cells to digital bit streams. To accomplish this task, we implemented a prototype capable of decoding 2D color barcodes by using different methods, including clustering algorithms and machine learning classifiers. We show that, even if state-of-art methods for color classification could be successfully used for decoding color barcodes in the desktop scenario, there is an emerging need for new color classification methods in the mo-bile scenario. In desktop scenarios, our experimental findings show that complex techniques, such as support vector machines, does not seem to pay off, as they do not achieve better accuracy in classifying color barcode cells. The lowest error rates are indeed obtained by means of clustering algorithms and probabilistic classifiers. From the computational viewpoint, classification with clustering seems to be the method of choice. In mobile scenarios, simple and efficient methods (in terms of computational time) such as the Euclidean and the K-means classifiers are not ef-fective (in terms of error rate), while, more complex methods are efef-fective but not efficient. Even if a few color barcode designs have been proposed in recent studies, to the best of our knowledge, there is no previous research that addresses a com-parative and experimental analysis of clustering and machine learning methods for color classification in 2D color barcodes.
Keywords:color, classification, barcode.
1.
Introduction
Barcodes are optical machine-readable representations of data, capable of storing digital information. Barcode data are represented as a sequence of bytes, which are then mapped
?A preliminary version of this paper was presented at the Federated Conference on Computer
to analog signals (in this case, barcode elements) and transmitted over a printing and scan-ning (Print&Scan) channel which introduces noise, distortions and interference, corrupt-ing the transmitted signal (in this case, the barcode image after scanncorrupt-ing). At the receiver, the distorted barcode is mapped back to bytes. Unfortunately, the received binary infor-mation is often only an estimate of the transmitted binary inforinfor-mation. Indeed, byte errors may result due to the amount of noise encountered in the transmission. Because noise and distortions always occur in practice, as a result barcode reading algorithms have to cope necessarily with errors, and the trade-off between reliability and data density of barcodes is a significant design consideration. To cope with errors, redundancy is added by channel coding, which is a viable method to increase reliability in a noisy communication channel (which in our case is represented by the Print&Scan channel) at the price of reducing the information rate. The higher the expected number of errors and the redundancy needed for coping with it, the lower the actual data rate (in our case, the barcode data density).
Traditional barcodes, referred to as one-dimensional (1D) barcodes, represent data by varying the widths and spacings of parallel lines. The amount of digital information stored in 1D barcodes is limited and can be only increased by laying out multiple bar-codes. This approach has many negative effects, however, such as enlarged barcode areas, more complex reading operations, and increased printing costs. For this reason, the bar-code technology has been deploying geometric patterns (such as squares, dots, triangles, hexagons) in two dimensions: such barcodes are referred to as bidimensional (2D) codes. Both the increasing demand for higher density barcodes and the wide availability of on-board cameras in mobile devices has motivated the need for 2D color barcodes, such as the colored DataGlyphs developed at Xerox Parc [10], the High Capacity Color Barcode (HCCB) developed at Microsoft Research [15, 16], the high capacity color barcode tech-nique proposed in [3], and HCC2D, the High Capacity Colored 2-Dimensional code [8, 17, 18]. Color barcodes generate each module of the data area with a color selected from 2n-ary schemes (e.g.,4-ary color schemes encoding 2bit/moduleor8-ary color schemes encoding 3bit/module), where a module (or cell) is the atomic information unit of a 2D barcode.
for its data density, while a 10% byte error rate implies that at least 20% of the barcode area must be used for error correction, reducing its data density to less than 80%.
In this paper we tackle this problem by designing and experimentally evaluating algo-rithms for retrieving digital data from color cells undergoing chromatic distortions (due to printing and scanning), so as to minimize their error rates. In particular, we perform an experimental study of the practical performance of several color classifiers and clusterers for converting analog barcode cells to digital bit streams. This allows to identify the most effective algorithms for decoding color barcodes in terms of their error rate and their to-tal running times. Moreover, we investigate the trade-off between redundancy and data capacity for 2D color barcodes. This allows to optimize the data storage, addressing the need for high density barcodes (capable of storing as much information as possible in as small an area as possible).
To accomplish this task, we have developed a prototype capable of using different algorithms for color classification. We have chosen algorithms so that they are represen-tative of general classes, such as minimum distance classifiers, clustering, decision trees, community detection, probabilistic classifiers and support vector machines. Our experi-mental findings show that the impact of different color classifiers on the error rate achieved in decoding can be significant. Furthermore, the use of more complex techniques, such as support vector machines, does not seem to pay off, as they do not achieve better accuracy in classifying color barcode cells. The lowest error rates are indeed obtained by means of clustering algorithms and probabilistic classifiers. From the computational viewpoint, classification with clustering seems to be the method of choice, since it is simple and it does not need time consuming training phases.
2.
Related Work
To the best of our knowledge, there is little research in the literature on the color classifi-cation for 2D color barcodes. One of the first reported attempt to use color in a 2D barcode can be found in a patent by Han et al. [20], who used reference cells to provide standard colors for correct indexing. Bulan et al. [3] proposed to embed data in two different printer colorant channels via halftone-dot orientation modulation, that is, to print two colors at the same spatial location. This allows to nearly double the capacity of black and white bar-codes, which is equivalent to use a4-ary color scheme for encoding 2bit/module. This work was extended in [4] by using three instead of two colorant layers and a interference mitigating design of the orientations of the three colorants to improve capacity. Microsoft HCCB uses a grid of colored triangles to encode data, using a palette of 4 or 8 colors (4-ary color or8-ary color scheme). HCC2D, the High Capacity Colored 2-Dimensional Barcode [17] uses a grid of colored squares (using a palette of 4 or 8 colors) and has a symbol structure which builds upon a QR code [11] basis for preserving the QR ro-bustness to distortions. Different color barcode technologies adopt different strategies for classifying colors, that is, for converting analog barcode cells to digital bit streams. For instance, the strategy adopted by the Microsoft HCCB decoder is to make use of a color palette, while Bagherinia and Manduchi [1] proposed an algorithm for decoding barcode elements in a color barcode that does not display its reference colors.
color classification in this framework, which is the main contribution of our work. Exper-imentation in color classification has been previously addressed in other domains such as color recognition of objects in indoor and outdoor images [5], color recognition of license plates [9] or skin color detection in face localization and tracking [12] [6], where, sim-ilarly to our problem, there is the need to discriminate among different classes of color pixels. We emphasize that results from other domains (e.g., pixel classification into skin color and non-skin color) do not necessarily carry through the classification of color cells in barcodes, because the underlying conditions are rather different. Indeed, color classifi-cation in 2D barcodes mainly focuses on classifying color cells with minimal size (e.g., thousands cells per square inch) after undergoing a printing and scanning process, while in other domains color elements have other characteristics (e.g., colors in video frames representing natural images). Furthermore, the effective decoding of color barcodes re-quires much more accuracy and precision than other applications considered for color classification.
3.
HCC2D Barcodes
In this section, we introduce 2D color barcodes, which take advantage of colors for achiev-ing higher data density than black and white barcodes. This is obtained at the price of coping with chromatic distortions during decoding. In order to introduce the typical de-coding process of a color barcode, we describe next the HCC2D code, which will be used as a paradigmatic example throughout the rest of the paper. We remark that most of the findings reported in this paper about color classification for HCC2D codes apply to color classification for other 2D color barcodes as well.
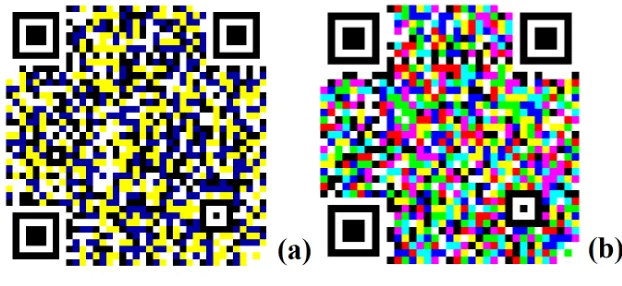
The HCC2D code is a 2D color barcode which is made of a matrix of square color cells, whose color is selected from a color palette. Figure 1 illustrates samples of HCC2D codes with 4 and 8 colors.
Fig. 2.Structure of generic QR codes and HCC2D codes, which inherit all function patterns of QR codes.
We have designed the HCC2D format with the main goal of increasing the data density while preserving the strong robustness to distortions of Quick Response (QR) codes. QR codes are black and white 2D barcodes designed by the Japanese corporation Denso Wave which are quite widespread among 2D barcodes, because their acquisition process appears to be strongly reliable, and are suitable for mobile environments, where this technology is rapidly gaining popularity.
The main structure of QR codes, and consequently, of HCC2D codes is illustrated in Figure 2, being composed ofFunction PatternsandEncoding Regions. ThePosition Detection Patterns, theAlignment Patterns, theTiming Patterns, and theSeparators for Position Detection Patternssupport the detection process in detecting the presence, the proper orientation and the correct slope of a code into an image. TheFormat Information describes the error correction level used in the code. As previously introduced, the higher the correction level, the higher the redundancy and the reliability of the barcode reading process, but the lower the actual data density rate. TheVersion Informationrepresents the code size, that is, the amount of cells (per side) making up the code. Note that theVersion Informationalone does not determine the final print out size (expressed ininch2orcm2), which also depends on hardware parameters, that is, on the printing resolution and on how many printer dots make up each color cell. Finally theData and Error Correction
Codewordscontains data plus redundancy.
a QR code is that the modules belonging to theData and Error Correction Codewords area are of different colors; in a HCC2D code with a palette composed of 4 colors each module is able to encode 2bit/module, while 3bit/moduleare stored using 8 colors. Introducing colors in theData and Error Correction Codewordsarea requires to address some issues, which are described in details in [17]. In particular, during QR code read-ing only the brightness information is taken into account, while HCC2D codes have to cope with chromatic distortions during the decoding phase. Since theEncoding Region is made of color cells, the HCC2D decoder needs to know the complete color palette in order to decode the symbol. To consider the color palette as ana priori shared knowl-edge between encoding and decoding processes is not a reliable solution; this is because chromatic distortions would not be properly taken into account, arising differently in each printed and scanned image. The processing should be adaptive to each image for better performance. To make a parallelism with black and white barcodes, QR codes compute an adaptive threshold on each image for discriminating dark and light modules, rather than using static thresholds.
In order to ensure adaptation to chromatic distortions arisen in each scanned code, we have introduced in the HCC2D code an additional field, theColor Palette Pattern. This is because color cells of aColor Palette Patternare supposed to be distorted in the same way color cells of theEncoding Regionare. We make use of replicated color palettes either for cluster initialization or for training machine learning classifiers. Figure 3 illustratesColor Palette Patternsin HCC2D codes, located at the boundaries. Note that theColor Palette Patternsare not too close to the threePosition Detection Patternsareas and are far away from each other, thus ensuring that they are robust to local distortion. Furthermore,Color Palette Patternstake only 2 rows and 2 columns from a symbol consisting of between 21 and 177 rows and columns, and thus, the overhead is small for high density barcodes.
4.
Color Classifiers for 2D Color Barcodes
Since the printing and scanning processes introduce chromatic distortions in color bar-codes, the decoding success rate depends on the capacity to classify correctly colors of barcode cells. A barcode cell is classified correctly if its original color (before printing) and the class assigned by the classifier to the cell (after scanning) corresponds to each other. A classifier is an algorithm that distinguishes between a fixed set of classes based on labeled training examples. Algorithms reading black and white barcodes may just use a threshold to separate the two classes (that is, dark and light elements), while cells of color barcodes need to be properly classified in many classes, depending on the number of colors. We distinguish 4 or 8 classes (each representing a reference color) into which color pixels may fall, where each pixel is sampled from a cell of the 2D color barcode to decode. Each class reference color is associated with either a 2-bit sequence or a 3-bit se-quence. The sequence length depends on how many bits are modulated into each barcode cell (as previously introduced, 4-ary color schemes encode 2 bit/module, while8-ary color schemes encode 3bit/module). Because no classifier is perfect, it is important to know whether a classifier is producing good results on real data sets.
arise, and thus, the original bit stream and the decoded bit stream may differ slightly from each other.
As previously mentioned, channel coding techniques are capable of correcting errors and restoring the original bit streams, under the assumption that the redundancy intro-duced in the encoding phase is enough. The main problem considered here is how much redundancy is needed in order to decode successfully 2D color barcodes. This redun-dancy depends on many parameters, including the algorithms used for color classifica-tion. In order to estimate the most suitable redundancy rate (RR), we implemented six different methods for color classification, each of them being representative of a general class of algorithms (minimum distance classifiers, clustering, decision trees, community detection, probabilistic classifiers and support vector machines), and measured their error rates. Next, we briefly describe those algorithms.
4.1. Euclidean Distance (Minimum Distance Classifiers)
Minimum distance classifiers assign unlabelled samples to classes which minimize the distance between unlabelled data and classes in the feature space. The distance is defined as an index of similarity so that the minimum distance is identical to the maximum sim-ilarity. We used the Euclidean distance (in RGB, YUV, ...) for identifying similar colors (that is, colors with minimum distance), because it is one of the simplest and most popular distance measures. This method can be taken as a basic reference in our experiments: it is a very simple-minded method, and thus we expect all other methods to produce much lower error rates but to be much slower in their running times.
4.2. K-means (Classification using Clustering)
Clustering is the task of assigning a set of objects into groups (denoted as clusters) so that the objects in the same cluster are more similar to each other than to those in other clusters. Hence, color cells are classified once clustering is completed. Clustering itself is not one specific algorithm, but the general task to be solved. It can be achieved by various algorithms that differ significantly in their notion of what constitutes a cluster and how to efficiently find them. We used the K-means algorithm [14], which is an unsupervised learning algorithm that classifies a given data set through a certain number of clusters (ex-actly k clusters) fixed a priori. Using the K-means algorithm, we can exploit thea priori knowledge about the number of colors in color palettes, so that the algorithm generates exactly 4 or 8 clusters. In our experiments, the starting points (for centroid initialization) were taken by averaging the series of color palettes.
4.3. LMT (Decision Trees)
4.4. Louvain (Community Detection)
The Louvain method [2] is a simple, efficient and easy-to-implement algorithm for iden-tifying communities in large networks. It is a greedy optimization method that attempts to optimize the ”modularity” of a partition of the graph, i.e., it tries to maximize the strength of the division of a graph into clusters. Put in other terms, a high modularity in the clus-tering implies dense connections between nodes within clusters and sparse connections between nodes in different clusters. In order to apply the Louvain method for decoding color barcodes, we define a QR code graph as follows:
– Each QR code module represents a node.
– There is a weighted edge between each pair of nodes, where the weight is inversely proportional to the distance of the nodes in the color space.
Note that this defines a complete graph. To obtain a smaller graph, we consider only edges between nodes that are “close enough” in the color space, according to a given threshold.
4.5. Naive Bayes (Probabilistic Classifiers)
A probabilistic classifier is a function that maps an unlabelled sample to a distribution over class labels. There are a variety of probabilistic classifiers; we used the Naive Bayes algorithm because it only requires a small amount of training data to estimate the pa-rameters. A Naive Bayes classifier is a simple probabilistic classifier based on applying Bayes’ theorem with strong (naive) independence assumptions. In simple terms, a Naive Bayes classifier assumes that the presence (or absence) of a particular feature of a class is unrelated to the presence (or absence) of any other feature. For example, assume that a color cell (in YUV space) is represented by luma (Y value) and by chroma (U and V values). Even if these luma and chroma values depend on each other, a Naive Bayes clas-sifier considers all of these properties to contribute independently to the probability that this color cell is of a given color. The Naive Bayes classifier can be trained very efficiently in a supervised learning setting, using in our case a trained set of known samples taken from the color palette patterns.
4.6. SVM (Support Vector Machines)
5.
Experimentation
We developed a prototype for generating and acquiring HCC2D codes. Even if we re-stricted our experiments to HCC2D codes only, most of the results (in relative terms) can be generalized to the color classification of any other color barcode. This is due the fact that our experiments focused only on the color classification task.
Barcode reading requires a detection and a decoding phase, where color classifica-tion is only one part of the decoding phase. The risk is that errors arising in steps other than color classification may affect the experimental results in an unpredictable way. To prevent this, we proceeded as follows. Even if many factors other than the classification algorithm affect the experiment (e.g., the specific hardware involved, routines for detect-ing or for sampldetect-ing color cells which are specific to HCC2D codes), their impact has been kept constant through the use of a common set of barcode scans as input for each clas-sifier, along with the use of common routines for every processing step other than color classification (such as image processing, barcode detection or grid sampling routines). For this reason, even if results of our experiments (in absolute terms) depend on the hardware involved and on the HCC2D code, the relative performance of the algorithms considered seems to be of more general extent.
A metric that we adopt is the byte error rate (ByER), which is defined as the ratio be-tween the number of incorrectly received bytes and the total number of bytes transmitted. ByER depends on characteristics of the channel such as the signal-to-noise ratio (SNR) at the receiver and on the accuracy of the “sensors”. In our case, the unreliable channel is a printing and scanning channel, while the “sensors” are represented by the classification algorithms and their accuracy is our parameter of interest. We performed an experiment for computing performance statistics for byte error rates (ByER) and computational time of classifier algorithms. By computing these error rate statistics, we are able to identify the most effective color classifier and the most suitable redundancy rate (RR) for it. This allows us to optimize the data rate (DR), that is, the actual data density of color barcodes.
5.1. Experimental Set-up
We collected 100 barcode scans which make up the sample upon which performance statistics (such as the mean error rate) are computed for each of the 6 methods. Our ex-perimental set-up is as follows:
– We collected 100 barcode scans from real-life applications. Each barcode underwent a real printing and scanning process (i.e., no artificially distorted barcodes).
– Color barcodes were printed and scanned at 600 dpi. – The print out size of each code was 1 square inch. – The size of each color cell was4×4printer dots.
– Each code was made up of149×149cells (out of which we had 512 known color cells to use for training classifiers and 19,720 color cells to classify).
– Each code stored 4,930 bytes in 1 square inch, considering data and redundancy from error correction.
– Each code used4colors for encoding 2bit/module.
Fig. 4.Box-and-Whisker plot indicating the smallest observation, lower quartile (Q1), median (Q2), upper quartile (Q3), and largest observation. (Viewed better in color).
– Codes stored different input data so that results were not dependent on the specific barcode instance.
Each barcode image was decoded by each one of the 6 classifiers. All our experiments were run on a low-end machine equipped with OS Linux Debian 6.0 running on a 1.73 GHz Intel dual core with 2 GB RAM. Documents were printed and scanned on low cost color laser multifunction printers.
5.2. Experimental Results
We now turn to the experimental results, by starting with the analysis of the byte error rates (ByER). We remark that in the application at hand, the byte error rate (ByER) is more meaningful than the bit error rate (BER). This is due to the fact that 2D barcodes use block error correcting codes, such as Reed Solomon codes (rather than codes protecting against single bit errors), since they have to withstand accidental damages such as ink spots, affecting a contiguous portion of the barcode.
A Box-and-Whisker plot for ByER data is depicted in Figure 4. Box-and-Whisker plots are convenient way of graphically depicting groups of numerical data through their five-number summaries: the smallest observation (sample minimum), lower quartile (Q1), median (Q2), upper quartile (Q3), and largest observation (sample maximum). Quartiles are the three points that divide the data set into four equal groups, each representing a fourth of the population being sampled. The red cross indicates the mean. Outliers, which are observations that are numerically distant from the rest of the data, are depicted too. They are often indicative either of measurement error or that the population has a heavy-tailed distribution.
Table 1.Summary statistics for ByER corresponding to each of the algorithms considered. Mean 99% Confidence Standard Standard Standard
Interval for Mean Deviation Skewness Kurtosis Euclidean 0.0956 0.0956±0.0160 0.0610 5.8994 4.8087
K-means 0.0454 0.0454±0.0097 0.0369 5.7278 4.0926 LMT 0.0851 0.0851±0.0177 0.0675 7.4592 6.9833 Louvain 0.0784 0.0784±0.0141 0.0474 2.1610 0.8378 Naive Bayes 0.0621 0.0621±0.0124 0.0473 8.0778 8.9108 SVM 0.0809 0.0809±0.0131 0.0500 3.8256 0.6889
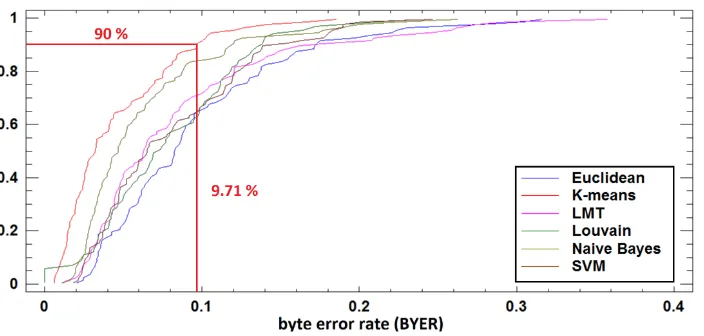
most effective algorithm (with the smallest mean and standard deviation) appears to be the K-means clustering algorithm. The ByER of K-means is 4.54% on average (this sample mean has been computed on a basis of 100 input images). To get a feeling on the sensitiv-ity of the mean to different samples, we have computed the 99.0% confidence intervals for the mean of each ByER distribution, which are reported at the corresponding column in Table 1. The classical interpretation of these intervals is that, in repeated sampling, these intervals will contain the true mean of the population from which the data come 99.0% of the time. In practical terms, we can state with 99.0% confidence that the true K-means ByER is somewhere between 0.0357 and 0.0551. Even if these intervals assume that the population from which the sample comes can be represented by a normal distribution (which is not the case here), the confidence interval for the mean is quite robust and not very sensitive to violations of this assumption. Confidence interval for the standard devia-tion would be quite sensitive, and thus, they are not computed. Of particular interest here are the standardized skewness and standardized kurtosis (reported at the last columns of Table 1), which can be used to determine whether the sample comes from a normal distri-bution. Values of these statistics (possibly except for Louvain) are outside the range of -2 to +2, indicating significant departures from normality. Figure 5 illustrates percentiles of ByER distributions (i.e., values below which specific percentages of the data are found).
Fig. 6.Percentiles for ByER data of each algorithm. The 90-th percentile for ByER of K-means is highlighted. (Viewed better in color).
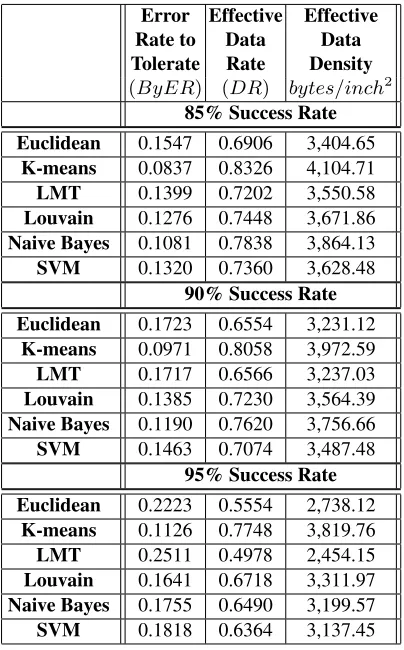
Table 2.Performance as function of success rate for barcode reading. Error Effective Effective Rate to Data Data Tolerate Rate Density
(ByER) (DR) bytes/inch2 85% Success Rate
Euclidean 0.1547 0.6906 3,404.65 K-means 0.0837 0.8326 4,104.71 LMT 0.1399 0.7202 3,550.58 Louvain 0.1276 0.7448 3,671.86 Naive Bayes 0.1081 0.7838 3,864.13 SVM 0.1320 0.7360 3,628.48
90% Success Rate
Euclidean 0.1723 0.6554 3,231.12 K-means 0.0971 0.8058 3,972.59 LMT 0.1717 0.6566 3,237.03 Louvain 0.1385 0.7230 3,564.39 Naive Bayes 0.1190 0.7620 3,756.66 SVM 0.1463 0.7074 3,487.48
95% Success Rate
Euclidean 0.2223 0.5554 2,738.12 K-means 0.1126 0.7748 3,819.76 LMT 0.2511 0.4978 2,454.15 Louvain 0.1641 0.6718 3,311.97 Naive Bayes 0.1755 0.6490 3,199.57 SVM 0.1818 0.6364 3,137.45
have run paired tests on these samples such as the sign test and the Wilcoxon signed-rank test, for testing the null hypothesis that there is “no difference in medians” between the distributions.
as the t-test) because the normality assumption would be violated. In summary, the results of our experiments showed that, at 99.0% confidence level, K-means outperforms Naive Bayes, which in turn outperforms Louvain, which in turn outperforms Support Vector Machines and Logistic Model Trees, which in turn outperform Euclidean classifiers.
Finally, we address the computational overhead introduced by the color classifiers considered. We stress that the overall running time is important, since in many appli-cations a color barcode must be decoded on low-end devices, such as mobile phones or tablets. Figure 7 illustrates the Box-and-Whisker plot for computational time distributions (the sample size is 100 elements for each method). As expected, the Euclidean classifier is the simplest and fastest algorithm among the studied methods; it is capable of classifying 19,720 color cells in a few milliseconds. In our experiments, the K-means algorithm was also fast (order of milliseconds), while all other classifiers had a much higher computa-tional overhead, as they required up to several seconds for the classification phase. The overall running time for the Louvain method is not reported in Figure 7, since its average computational time is around a minute. This is due, in part, to the overhead required to generate the QR code graphs.
Fig. 7.Box-and-Whisker plot for computational time. (Viewed better in color).
5.3. Experiments with Mobile Phones
Table 3.Summary statistics for ByER data related to barcode reading by mobile phones. Mean 99% Confidence Standard Standard Standard
Interval for Mean Deviation Skewness Kurtosis Euclidean 0.0664 0.0664±0.0208 0.0792 9.4180 14.260
K-means 0.2910 0.2910±0.1068 0.4065 3.4400 -2.6370 LMT 0.0456 0.0456±0.0154 0.0586 14.400 35.040 Louvain 0.1147 0.1147±0.0232 0.0885 7.5800 8.5200 Naive Bayes 0.0841 0.0841±0.0195 0.0743 6.9220 8.5980 SVM 0.0596 0.0596±0.0142 0.0543 7.5010 10.960
K-means is no longer the most effective algorithm, and it appears to degrade its perfor-mance in case of strongly non-uniform illumination of the barcodes, a problem which occurs frequently with mobile phone cameras. This is somewhat different from our pre-liminary experiments reported in [19], where the data set considered contained pictures taken under uniform light conditions.
Fig. 8.Box-and-Whisker plot for ByER data related to barcode reading by mobile phones. (Viewed better in color).
Fig. 9.Box-and-Whisker plot for ByER data (top 25 values out of 100) related to barcode reading by mobile phones. (Viewed better in color).
Fig. 10.Box-and-Whisker plot for ByER data (bottom 25 values out of 100) related to barcode reading by mobile phones. (Viewed better in color).
The quality difference between good and bad barcode scans in mobile scenarios is much more widened than in case of desktop scenarios (see Figures 11 and 12), and in many bad cases K-means fails to converge to an optimal solution.
Fig. 11.Box-and-Whisker plot for ByER data (top 25 values out of 100) related to barcode reading by desktop scanners. (Viewed better in color).
Fig. 12.Box-and-Whisker plot for ByER data (bottom 25 values out of 100) related to barcode reading by desktop scanners. (Viewed better in color).
Fig. 13.Percentiles for ByER data related to barcode reading by mobile phones. (Viewed better in color).
6.
Conclusions and Future Work
In this paper, we have addressed the trade-off between reliability and data density in 2D color barcodes, and reported the results of a thorough experimental study in desktop and mobile scenarios. Our experiments have shown that the impact of a color classifier on the error rate can be significant and that more complex classifiers do not necessarily achieve better accuracy in classifying color barcode cells. With the help of our study, one can identify the most suitable ways to convert analog color cells to digital bit streams.
We have shown that state-of-art methods for color classification could be success-fully used for decoding color barcodes in desktop scenarios, while color classification for pictures taken from phone cameras appears to be still a challenge. Indeed, in the mobile scenario, simple and efficient methods (in terms of computational time) such as the Eu-clidean and the K-means classifiers are not effective (in terms of error rate), while, more complex methods are effective but not efficient.
For future work, we see a number of interesting directions where our study maybe extended, in particular for mobile devices, since there is an emerging need for new ef-ficient classification methods, capable of addressing the problem of strong non-uniform illumination.
References
1. Bagherinia, H., Manduchi, R.: A theory of color barcodes. In: ICCV Workshops (2011) 2. Blondel, V.D., Guillaume, J.L., Lambiotte, R., Lefebvre, E.: Fast unfolding of communities in
large networks. Journal of Statistical Mechanics: Theory and Experiment 2008(10) (2008) 3. Bulan, O., Monga, V., Sharma, G.: High capacity color barcodes using dot orientation and color
5. Buluswar, S., Draper, B.: Color recognition in outdoor images. In: Sixth International Confer-ence on Computer Vision. pp. 171–177. IEEE (1998)
6. Chai, D., Bouzerdoum, A.: A Bayesian approach to skin color classification in YCbCr color space. In: TENCON 2000. vol. 2, pp. 421–424 (2000)
7. Cortes, C., Vapnik, V.: Support-vector networks. Machine learning 20(3), 273–297 (1995) 8. Grillo, A., Lentini, A., Querini, M., Italiano, G.F.: High capacity colored two dimensional
codes. In: Computer Science and Information Technology (IMCSIT), Proceedings of the 2010 International Multiconference on. pp. 709–716. IEEE (2010)
9. Guo, D., Chen, L., Lu, Z., Han, L.: Vehicle plate location techniques based on plate grounding-color recognition. Computer Engineering and Design 5, 023 (2003)
10. Hecht, D.: Printed embedded data graphical user interfaces. Computer 34(3) 11. ISO 18004:2006: QR Code 2005 bar code symbology specification.
12. Kakumanu, P., Makrogiannis, S., Bourbakis, N.: A survey of skin-color modeling and detection methods. Pattern Recogn. 40(3), 1106–1122 (Mar 2007)
13. Landwehr, N., Hall, M., Frank, E.: Logistic model trees. Machine Learning 59(1-2), 161–205 (2005)
14. MacQueen, J., et al.: Some methods for classification and analysis of multivariate observations. In: Proceedings of the fifth Berkeley symposium on mathematical statistics and probability. vol. 1, p. 14. California, USA (1967)
15. Microsoft Research: High Capacity Color Barcodes. http://research.microsoft.com/projects/hccb/ (2013), [Online; accessed 10-December-2013]
16. Parikh, D., Jancke, G.: Localization and segmentation of a 2D high capacity color barcode. In: Proceedings of the 2008 IEEE Workshop on Applications of Computer Vision. IEEE Computer Society (2008)
17. Querini, M., Grillo, A., Lentini, A., Italiano, G.: 2D color barcodes for mobile phones. Inter-national Journal of Computer Science and Applications (IJCSA) 8(1), 136–155 (2011) 18. Querini, M., Italiano, G.: Facial recognition with 2D color barcodes. International Journal of
Computer Science and Applications (IJCSA) 10(1), 78–97 (2013)
19. Querini, M., Italiano, G.F.: Color classifiers for 2D color barcodes. In: Federated Conference on Computer Science and Information Systems (FedCSIS). pp. 611–618. IEEE (2013) 20. Tack-Don, H., Cheol-Ho, C., Nam-Kyu, L., Eun-Dong, S., et al.: Machine readable code image
and method of encoding and decoding the same (2006)
Marco Queriniis a research associate at the department of Civil Engineering and Com-puter Science Engineering, University of Rome ”Tor Vergata”. He received the Master’s degree in Computer Engineering from the University of Rome ”Tor Vergata” in 2010. From the same university, he received the PhD in Computer Science and Automation Engineering in 2014, defending a thesis which presented a new system for securizing documents through their entire life cycle. His research focuses on computer security, high capacity barcodes in security applications, document securization and verification, hand-written signature verification. He is author of a number of publications in those fields, which also address challenges given by todays exploding world of mobile devices. Eng. PhD. Marco Querini is also serving as program committee member of IEEE conferences such as MMAP 2014.
Evaluation and Performance. Prof. Italianos research focuses on the design, analysis, im-plementation and experimental evaluation of algorithms and data structures. In particular, he is interested in several research areas, including algorithm engineering, combinatorial algorithms, computer security, graph algorithms and string algorithms. In those areas, he has published over 200 papers in journals and conference proceedings, is the inventor of few US patents, and has co-founded two technology startups. Prof. Italiano has been serving as Editor-in-Chief and Associate Editor in several journals in theoretical computer science. His research has been funded in part by several EU projects, industrial contracts and by the Italian Ministry of Education, University and Research.