Available online on 15.09.2015 at http://jddtonline.info
Journal of Drug Delivery and Therapeutics
Open access to Pharmaceutical and Medical research
© 2015, publisher and licensee JDDT, This is an Open Access article which permits unrestricted noncommercial use, provided the original work is properly cited
RESEARCH ARTICLE
PHYSICOCHEMICAL CHARACTERIZATION OF ACID MODIFIED DIOSCOREA
STARCH AND ITS EVALUATION AS DIRECTLY COMPRESSIBLE EXCIPIENT IN
TABLET FORMULATION
Bilal Tessema, Anteneh Belete, Tsige Gebre-Mariam*
Department of Pharmaceutics and Social pharmacy, School of Pharmacy, College of Health Sciences, Addis Ababa University, P.O. Box. 1176, Addis Ababa, Ethiopia
*For Correspondence: [email protected]
Received 02 Aug 2015; Review Completed 27 Aug 2015; Accepted 28 Aug 2015, Available online 15 Sep 2015
INTRODUCTION
Starch is a semi-crystalline biopolymer that serves as a carbohydrate reserve in many plants, including cereals, roots, tubers, seeds, and fruits (Elessandra & Alvaro, 2011). Starch is a polymer composed of glucose molecules that are linked together in two different forms: amylose (20-30%), amylopectin (70–80%). Starch is the main carbohydrate reserve in yam tubers, accounting for 70 - 80% of the dry weight (Odeku & Akinwande, 2011). The proximate composition of D. abyssinica on dry weight basis was found to be 0.1% ash, 0.5% protein, 1.0% fat and 98.4% starch; the amylose content was estimated to be 29.7% (Gebre-Mariam and Schmidt, 1998).
Studies have shown that the properties of some starches have been improved by physical and chemical modifications (Omojola et al, 2011). Acid modified starches are produced commercially by hydrolyzing the starches with hydrochloric or sulfuric acid at temperatures below the gelatinization temperatures. The extent of hydrolysis depends on the starch consistency, acidity of the medium, hydrolysis temperature and duration of hydrolysis (Omojola et al., 2011). Acid hydrolysis of starch involves the cleavage of the glucosidic bonds between the monomeric units which
involves both protonation of the glycosidic oxygen and addition of water to yield the reducing sugar end group (D-glucose) of the starch (Odeku & Akinwande, 2011). This process diminishes the molar mass and increases the solubility and relative crystallinity of the starches (Omojola et al., 2011).
The properties of excipients that ensure a robust and successful directly compressible adjuvant are good flowability, good compressibility, low lubricant sensitivity, and high dilution potential (Parrott, 1989). The choice of excipients becomes critical in terms of its functionality as regards direct compression and rapid disintegration abilities. Only few polymers possess multiple functionalities especially in terms of good flow, direct compression and enhanced disintegration abilities. Thus, novel polymer biomaterials with effective multifunctional properties are continually being sought for drug delivery purposes. This study was designed to evaluate the efficacy of acid modified D. abyssinica starch as a potential pharmaceutical directly compressible excipient in paracetamol tablets.
ABSTRACT
D. abyssinica was partially hydrolyzed in 6% HCl solution at room temperature for different lengths of time, (2, 4, 8, 16, and 32 days), dried using oven- and spray- drying techniques and subsequently investigated as directly compressible excipient in paracetamol tablet formulations. Native dioscorea starch (NDS) and oven dried acid modified dioscorea starch (AMDS) exhibited poor flow characteristics, whereas spray dried AMDS was found to be free flowing powder with 21.37 ± 1.39° angle of repose and 13.24 ± 0.76 g/sec flow rate. Both swelling power and percent solubility of the starches were found to increase with increase in temperature; AMDS showed higher percent solubility of 68.53%. Lubricant sensitivity and dilution potential of spray dried NDS and spray dried AMDS were investigated by incorporating magnesium stearate and paracetamol, respectively. In tablet formulations, spray dried AMDS and Starch 1500® tablets were produced with acceptable tablet characteristics up to 1% and 0.5% magnesium stearate concentrations, respectively. The spray dried AMDS was able to accommodate up to 40% paracetamol with acceptable criteria. Thus, it can be concluded that AMDS can be used as an alternative directly compressible excipient in tablet formulations.
MATERIALS AND METHODS
Materials
Paracetamol powder (China Associate Co Ltd, China),
Ac-Di-Sol® (FMC Corporation, USA), hydrochloric acid (37% w/w, Jiangxi Bolai Pharmacy Co., Ltd, China), magnesium stearate (Bulvinos Chemicals Ltd,
England) and Starch 1500 ®
(Shandong Xinda. Biotechnology Co. Ltd, China) were used as received. Tubers of D. abyssinica were obtained from local farmers in Sawula, Gamo Gofa Zone, SNNPR, Ethiopia.
Starch isolation
Starch isolation was carried out by the method descried by Gebre-Mariam and Schmidt (1998). Yam tubers were washed, peeled and trimmed to remove defective parts. The tubers were then sliced, diced and blended. The flesh was suspended in large quantities of distilled water containing 0.075% (w/v) of sodium metabisulfite. The material was allowed to settle, and the sedimented starch was repeatedly treated with sodium metabisulfite solution until the supernatant was free from coloring materials and the suspension was translucent. The material was then passed through fine muslin to remove cell debris and the translucent suspension was collected, filtered through a fine sieve (224 µm) and allowed to settle. The sedimented starch was washed several times with distilled water, followed by sieving after each washing until the wash water was clear and free of suspended impurities. The resulting starch was sieved and dried in air at room temperature.
Preparation of acid modified starch
Two grams of native dioscorea starch was hydrolyzed in 10 ml of 6% (w/w) HCl solution at room temperature for 2, 4, 8, 16 and 32 days. After hydrolysis, the suspension was neutralized with 10% (w/v) sodium hydroxide solution to terminate the hydrolysis. The starch slurry was washed several times with distilled water until the pH of the filtrate was 7.0. The resulting acid hydrolyzed starch was dried in a hot air oven at 40 °C for 24 h and then powdered using mortar and pestle (Odeku & Akinwande, 2011). Alternatively, the acid hydrolyzed starch was spray dried in spray drying apparatus (BÜCHI, B-290, Switzerland). Starch solution was pumped into the drying chamber of the apparatus at pumping rate of 7.5 ml/min. A flow of heated air set at 25 m3/h at 115°C and atomizing pressure 350 mbar aspirated by a pump induces the quick evaporation of the solvent from the drops, leading to the formation of solid particles.
Characterization of starches and Starch 1500 ®
Determination of density and related properties
Thirty grams of starch were transferred into 250 ml measuring cylinder. The volume occupied by the starch powder was read and the bulk density was calculated as g/ml. The bulk in the cylinder was then tapped for 1 min using tapped densitometer (ERWEKA, Type svm,
Germany). This provided a fixed drop of one-half inch at rate of 250 taps/min. The volume occupied by the starch was recorded and tapped density was calculated as g/ml. The Carr’s index and Hausner ratio were calculated from the density results using equations 1 and 2:
Eq. 1
Eq. 2
where Db is bulk density and Dt tapped density.
Flow rate and angle of repose
Flow rate and angle of repose of the starch powders were determined using the funnel method. Starch powder (30 g) was allowed to flow through funnel having a 15 mm aperture from a 10 cm height. The duration of flow was recorded and flow rate was determined by dividing the mass in gram by time in seconds. Angle of repose was calculated according to the equation 3 below.
Angle of repose (Ɵ) = tan-1
r
h
Eq. 3
where, h is the height and r is the radius of the starch powder pile.
Swelling power and solubility
Swelling power and solubility were determined in accordance with methods described by Daramola et al (2006). Starch (0.5 g) was weighed directly into a pre-weighed centrifuge tubes, and 10 ml distilled water was added in each tube. The tubes were then kept in a thermostatically controlled water bath (GFL®, D3006, Germany) at temperatures of 25, 35, 45, 55, 65, 75, and
85 o
C for 30 min with frequent mixing at 5 min intervals. The tubes were then cooled to room temperature and centrifuged at 3000 rpm for 15 min, and the supernatant was carefully decanted and the weight of the residues (Ws) obtained were weighed. The supernatants were dried to constant weight (W1) in an oven (Kottermann® 2711, Germany) at 105
o C for 12 h. The water solubility index (WSI) and swelling power (SP) were calculated as follows:
% 100 5 . 0
1 X W
WSI
Eq. 4
) 100 ( 5 . 0
100 WSI X
X W
SP S Eq. 5
Moisture content
0C for about 2 h. The sample was then taken out of the oven, weighed and the moisture content was reported as percentage.
Moisture content (%) X100
W W W
i f i
Eq. 6
Where Wi and Wf are the weight of starch before and after drying, respectively.
Tablet compression
Lubricant sensitivity of spray dried NDS and spray dried AMDS was evaluated according to the method described by Parrott (1989). Tablets containing spray dried NDS, spray dried AMDS or Starch 1500® were compressed with magnesium stearate at concentrations of 0, 0.5%, 1%, 1.5%, 2% (w/w). Fifty grams batch of
each mixture was blended for 5 min in a Turbula mixer then, 10 mm flat surfaced compacts of the starches were produced with 400 mg size by compressing the powder blends at a fixed compression force on eccentric tablet machine (EK0 Korsch, 7891, Berlin, Germany).
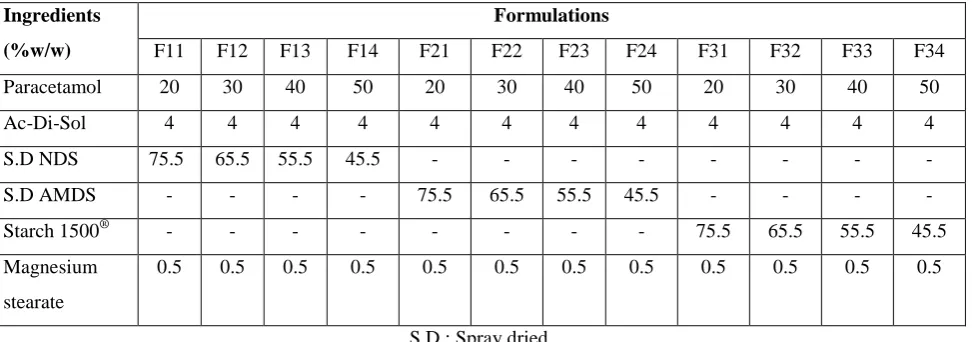
Dilution potential of spray dried NDS and spray dried AMDS was evaluated as per the method described by Mitrevej et al (1996). All the components (Table 1) except magnesium stearate were blended in a Turbula mixer for 10 min followed by addition of lubricant (magnesium stearate) and further blended for 5 min. The blend was then compressed into tablets of 400 mg size at a fixed compression force on eccentric tablet machine (EK0 Korsch, 7891, Berlin, Germany).
Table 1: Paracetamol tablet formulations spray dried NDS, spray dried AMDS or Starch 1500® as filler-binder.
Ingredients
(%w/w)
Formulations
F11 F12 F13 F14 F21 F22 F23 F24 F31 F32 F33 F34
Paracetamol 20 30 40 50 20 30 40 50 20 30 40 50
Ac-Di-Sol 4 4 4 4 4 4 4 4 4 4 4 4
S.D NDS 75.5 65.5 55.5 45.5 - - - -
S.D AMDS - - - - 75.5 65.5 55.5 45.5 - - - -
Starch 1500® - - - 75.5 65.5 55.5 45.5
Magnesium
stearate
0.5 0.5 0.5 0.5 0.5 0.5 0.5 0.5 0.5 0.5 0.5 0.5
S.D.: Spray dried
Evaluation of tablets
Crushing strength
After 24 h of production, ten tablets were taken from each batch and the crushing strengths of the tablets were determined using hardness tester (Schelinguer, 2E/205, Switzerland).
Tensile strength
The radial tensile strength was calculated using the data obtained from crushing strength, diameter, and thickness of tablets using equation 7.
DT 2
x F Eq. 7
Where, σx is the tensile strength, F is the force required to break the tablet (Crushing strength), D is the diameter of the tablet, and T is the tablet thickness.
Friability
Ten tablets of known weights from each batch were placed in a friability tester (ERWEKA, TAR 20, Germany) and were subjected to combined effects of
abrasion and shock by placing them in the plastic chamber that revolves at 25 rpm for 4 min. The tablets were then dusted and weighed, and the percent loss in weight was calculated as friability.
Disintegration test
Disintegration test was carried out according to USP 30/NF-25 specification (2007). Six tablets of known weight from each batch were placed in a disintegration tester (CALEVA, G.B. Caleva Ltd., UK) filled with
distilled water at 37 ± 2 o
C. The tablets were considered completely disintegrated when all the particles passed through the wire mesh.
Dissolution test
The dissolution test was carried out according to the USP/NF specification using dissolution apparatus Type II (ERWEKA, DT600, Germany), rotated at 50 rpm in 900 ml of phosphate buffer (pH 5.8), maintained at 37 ±
0.5 o
using UV/Visible spectrophotometer (JENWAY, 6505, England) at 243 nm. Standard calibration curve of paracetamol was used for determining the quantities released.
Statistical analysis
Statistical analysis was carried out using Analysis of variance (ANOVA) with statistical software Origin 8 (OriginLabTM Corporation, USA). Tukey multiple comparison test was used to compare the individual difference in the physicochemical and tablet properties of the starches. At 95% confidence interval, p values less than or equal to 0.05 were considered statistically significant. The results are reported as mean and standard deviation (SD).
RESULTS AND DISCUSSION
Acid recovery yield
The recovery yield of the acid-hydrolyzed starch is presented in Figure 1. The recovery yield of acid-hydrolyzed starch decreased gradually with increasing acid hydrolysis time. Hydrolysis was rapid for about the first 8 days and much slower from 8 to 32 days. The initial rapid hydrolysis phase was mainly attributed to the hydrolysis of the amorphous phase, and the later slower phase to the hydrolysis of the crystalline phase.
0 5 10 15 20 25 30 35
0 50 60 70 80 90 100
R
e
co
ve
ry
yi
e
ld
(%
)
Hydrolysis time (d)
Recovery yield
Figure 1: Recovery yield of dioscorea starch after acid hydrolysis.
The amorphous areas of the starch granules have a looser structure than the crystalline regions which is easier for attack by the hydrogen ions (Wang & Wang,
2001; Franco et al., 2002; Jiang et al., 2011). Based on the result, hydrolysis of day eight was selected for further studies since hydrolysis of starch for the first eight days were rapid and beyond day eight, the reaction was very slow and could be considered as constant.
Powder properties of starches
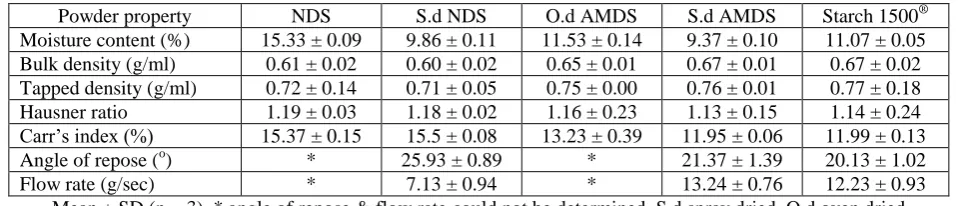
The powder properties ofNDS, Spray dried NDS, Oven dried AMDS, Spray dried AMDS and Starch 1500® are presented in Table 2. The rank order of the moisture content is NDS > oven dried AMDS > Starch 1500® > spray dried NDS > spray dried AMDS. The NDS appears to have the maximum moisture content this might be because it was air dried in comparison to oven dried AMDS (at 40 °C) and spray dried NDS and AMDS. In this study, all of the starches have moisture content within the limits recommended for commercial starches of 10-20 % (Soni et al., 1993). Reduction in moisture content reduces chances of microbial spoilage and hydrolysis thereby increasing the stability and shelf-life of the derivatives (Lateef & Kolawole, 2009; Kemas et al., 2012).
Bulk and tapped densities give an insight on the packing arrangement of particles and the compaction profile of a material (Russel and Lantz, 2005). In this study, the rank order of bulk and tapped density was Starch 1500® > spray dried AMDS > oven dried AMDS > NDS > spray dried NDS. The particle size and shape of the starches may be responsible for the differences in the density values which affect the packing arrangement of the powder particles. AMDS showed comparable bulk and tapped densities with that of Starch 1500® (p > 0.05) (see Table 2).
Hausner ratio and Carr’s index are considered as indirect measurements of powder flowability (Lateef & Kolawole, 2009).Hausner ratio less than 1.25 indicate good flow, whereas greater than 1.25 indicates poor flow and Carr’s index values 5 to 10, 12 to 16, 18 to 21, and 23 to 35 represent excellent, good, fair and poor flow properties, respectively (Wells, 2002). NDS showed significantly higher Carr’s index and Hausner ratio than AMDS and Starch 1500® (P < 0.05) indicating poor compressibility and flow property of NDS. The spray dried AMDS showed comparable Carr’s index and Hausner ratios to that of Starch 1500® (P < 0.05).
Table 2: Powder properties ofdioscorea starches and starch 1500®.
Powder property NDS S.d NDS O.d AMDS S.d AMDS Starch 1500®
Moisture content (%) 15.33 ± 0.09 9.86 ± 0.11 11.53 ± 0.14 9.37 ± 0.10 11.07 ± 0.05
Bulk density (g/ml) 0.61 ± 0.02 0.60 ± 0.02 0.65 ± 0.01 0.67 ± 0.01 0.67 ± 0.02
Tapped density (g/ml) 0.72 ± 0.14 0.71 ± 0.05 0.75 ± 0.00 0.76 ± 0.01 0.77 ± 0.18
Hausner ratio 1.19 ± 0.03 1.18 ± 0.02 1.16 ± 0.23 1.13 ± 0.15 1.14 ± 0.24
Carr’s index (%) 15.37 ± 0.15 15.5 ± 0.08 13.23 ± 0.39 11.95 ± 0.06 11.99 ± 0.13
Angle of repose (o) * 25.93 ± 0.89 * 21.37 ± 1.39 20.13 ± 1.02
Flow rate (g/sec) * 7.13 ± 0.94 * 13.24 ± 0.76 12.23 ± 0.93
The angle of repose θ could be used as a qualitative measure of the cohesiveness or the tendency of powdered or granulated materials to flow. Flow is graded as excellent, good, fair and passable for angle of repose 25-30◦, 31-35◦, 36-40◦ and 41-45◦, respectively (Mukesh et al., 2011). Comparable angle of reposes were recorded for spray dried AMDS (21.37 ± 1.39)
and Starch 1500 ®
(20.13 ± 1.02) (P < 0.05); characteristics of material with excellent flow property (Mukesh et al., 2011). Moreover, direct measure of the flow property showed that spray dried AMDS and Starch 1500® have comparable flow rates of 13.24 ± 0.76 and 12.23 ± 0.93, respectively (P < 0.05). Better flow properties of the spray dried AMDS might be attributed to spray drying process since the method is known to produce free flowing spherical particles (Limwong et al., 2004).
Solubility and swelling power
The solubility and swelling power measurements were carried out at different temperatures between 25 and 85 °C (Figure 2 and 3). As clearly indicated in Figure 2, there was rapid increase in the swelling power of all the starches studied as the temperature increased up to 75 °C, and at slower rates above 75 °C. This might be due to the loss of granule structures of the starches at higher temperatures resulting in slower swelling capacity (Chang et al., 1995). This type of behaviour was also observed by Iromidayo et al. (2010). It can be seen that the swelling profile of AMDS (both oven & spray dried) is significantly lower than that of the native starch (p > 0.05). These could be due to acid hydrolysis which reduces polymer chain length and hydrolyse the amorphous part of the starch granules (Wang & Wang, 2001; Odeku and Picker-Freyer, 2009; Himjyoti et al., 2011). Significant change was not observed between the swelling power of NDS and AMDS after spray drying (p < 0.05).
20 30 40 50 60 70 80 90 0
2 4 6 8 10 12 14 16 18 20
Sw
e
lli
n
g
p
o
w
e
r
(g
/g
)
Temprature (°C)
NDS
Oven dried AMDS Spray dried NDS Spray dried AMDS Starch 1500®
Figure 2: Swelling power of dioscorea starches (native
and acid modified) and Starch 1500 ®
at different temperatures.
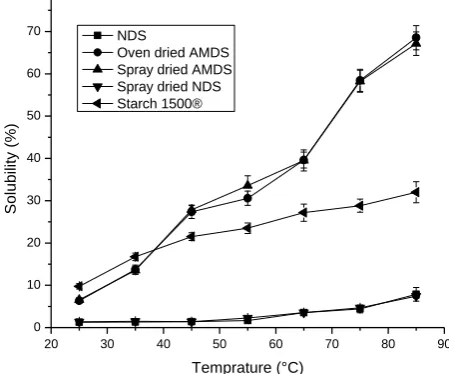
As depicted in Figure 3, the AMDS (both oven & spray dried) are more soluble than the native starches. The increase in solubility values may be due to shortening of the chain lengths of the starch, corresponding to the weakening of the hydrogen bonds (Osunsam et al., 1989).It has also been reported that the high solubility of acid modified starch with increasing temperature may be due to the loss of granular structure and release of amylose fraction of the starch, as the amylose molecules are preferentially solubilized and leached from swollen granules (Stone et al., 1984). Similar results were also reported by Odeku & Picker-Freyer (2009) and Mutungi et al. (2010). The solubilities of NDS & AMDS were not affected by drying method since comparable solubilities were found between air and spray dried NDS as well as between oven and spray dried AMDS (P > 0.05).
20 30 40 50 60 70 80 90
0 10 20 30 40 50 60 70 80
So
lu
b
ili
ty
(%
)
Temprature (°C) NDS
Oven dried AMDS Spray dried AMDS Spray dried NDS Starch 1500®
Figure 3: Solubility of dioscorea starches (native and
acid modified) and Starch 1500® at different temperatures.
Effect of lubricant concentration on crushing strength and friability
The crushing strength and friability of tablets produced from spray dried NDS, spray dried AMDS and Starch
1500 ®
at different lubricant concentrations are depicted in Figures 4 and 5, respectively. As shown in Figure 4, the crushing strength values decreased as the concentration of lubricant increased. This might be due to the altered physical properties caused by the lubricant that create a waxy covering and interfere with the interactive bonding forces between the particles to be compressed thus interfering with the eventual strength of the resulting tablets (Jarosz & Parrott, 1984; Mollan & Celik, 1996). The crushing strength of spray dried AMDS tablets were significantly higher than those of
spray dried NDS and Starch 1500 ®
0.0 0.5 1.0 1.5 2.0 0
20 30 40 50 60 70 80 90
C
ru
sh
in
g
st
re
n
g
th
(N
)
Magnesium stearate concentration (%)
Spray dried NDS Spray dried AMDS Starch 1500®
Figure 4: Crushing strength of spray dried NDS and
AMDS in comparison with Starch 1500 ®
tablets at different concentrations of magnesium stearate.
Friability is the ability of a tablet to withstand the movement of shipping and handling without breaking or chipping (Sheskey et al., 1995). Friability value less than 1% weight loss is considered acceptable (BP, 2009). Figure 5 shows the friability profiles of spray
dried NDS, spray dried AMDS and Starch 1500 ®
at different magnesium stearate concentrations. As clearly indicated in the figure, tablets formulated from Starch
1500 ®
at 0 and 0.5% magnesium stearate concentrations and tablets containing spray dried AMDS at magnesium stearate concentration of 0 to 1% had acceptable friability values (< 1%) but spray dried NDS showed friability values of > 1% at all magnesium stearate concentrations; moreover, tablets formulated with 1.5% magnesium stearate concentration broke during friability evaluation. Furthermore, less friable tablets were obtained from spray dried AMDS than Starch
1500 ®
at all levels of magnesium stearate concentration.
0.0 0.5 1.0 1.5 2.0
0.0 0.5 1.0 1.5 2.0 2.5 3.0 3.5
F
ri
a
b
ili
ty
(%
)
Magnesium stearate concentration (%) Spray dried NDS Spray dried AMDS Starch 1500®
Figure 5: Friability of spray dried NDS and AMDS in
comparison with Starch 1500 ®
tablets at different concentrations of magnesium stearate.
Effect of lubricant concentration on disintegration time
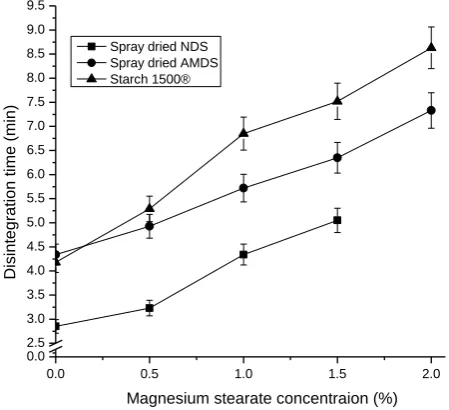
Figure 6 shows the relationship between the lubricant concentration and disintegration time of tablets prepared with spray dried NDS, spray dried AMDS and Starch 1500®. One of the undesirable side effects of lubricant addition to pharmaceutical formulation is the prolongation of tablet disintegration time (Timucin & Murat, 2008). Generally, disintegration time increased with increased concentration of magnesium stearate. These results are in agreement with the result of Aoshima et al. (2005). This delayed disintegration might be due to the hydrophobic membrane that magnesium stearate forms on the surface of the powder particles which limits the hydration of tablets (Sameer et al., 2009). Tablets formulated from spray dried AMDS possess a markedly shorter disintegration period
than Starch 1500 ®
, though their strength is much higher. Relatively increased disintegration period of tablets
formulated from Starch 1500 ®
might be attributed to the formation of gel-like layer which is formed in combination with water (Jitka & Irena, 2011).
0.0 0.5 1.0 1.5 2.0
0.0 2.5 3.0 3.5 4.0 4.5 5.0 5.5 6.0 6.5 7.0 7.5 8.0 8.5 9.0 9.5
D
isi
n
te
g
ra
ti
o
n
t
ime
(mi
n
)
Magnesium stearate concentraion (%) Spray dried NDS
Spray dried AMDS Starch 1500®
Figure 6: Disintegration time of spray dried NDS, spray
dried AMDS and Starch 1500 ®
tablets at different concentrations of magnesium stearate.
Effect of paracetamol concentration on crushing strength
Figure 7 shows the relationship between tablet strength and the amount (in percentage) of paracetamol that the starches can accommodate. It can be seen that tablet strength declined with increasing amount of paracetamol. The crushing strength of spray dried AMDS tablets were hard enough up to 40% of paracetamol. The crushing strength of the spray dried AMDS tablets was significantly higher as compared to
spray dried NDS and Starch 1500 ®
20 25 30 35 40 45 50 0
20 25 30 35 40 45 50 55 60 65 70 75
C
ru
sh
in
g
st
re
n
g
th
(N
)
Paracetamol content (%)
Spray dried NDS Spray dried AMDS Starch 1500®
Figure 7: Crushing strength of tablets formulated from
spray dried NDS, spray dried AMDS and Starch 1500 ®
at different paracetamol concentrations.
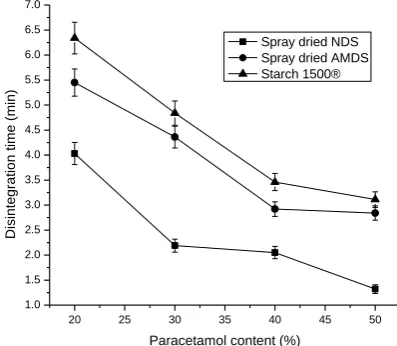
Disintegration time of directly compressed paracetamol tablets
Disintegration exposes a greater surface area of tablets to the dissolution medium; hence it plays an important role in a tablet’s dissolution before the active drug substance is finally released from the tablet’s structure into the body (Lateef & Kolawole, 2009). Figure 8 shows the declining disintegration time of tablets formulated from spray dried NDS, spray dried AMDS
and Starch 1500 ®
with increasing paracetamol concentration. Reduction of disintegration time might be explained on the basis of tablet weakness with paracetamol content increment. Generally the disintegration time is related to hardness. When the hardness increases, the disintegration time increases and the dissolution rate also decrease (Adenuga et al., 2008). The disintegration time of the spray dried AMDS was intermediate between spray dried NDS and Starch 1500®. Moreover, the disintegration times of all paracetamol tablets were much lower than the Pharmacopeal limit of <15 min (USP, 2007).
20 25 30 35 40 45 50 1.0
1.5 2.0 2.5 3.0 3.5 4.0 4.5 5.0 5.5 6.0 6.5 7.0
D
isi
n
te
g
ra
ti
o
n
t
ime
(mi
n
)
Paracetamol content (%)
Spray dried NDS Spray dried AMDS Starch 1500®
Figure 8: The disintegration time of tablets formulated from spray dried NDS, spray dried AMDS and Starch
1500 ®
at different paracetamol concentrations.
Dissolution of directly compressed paracetamol tablet
Figure 9 shows the dissolution profiles of F11, F14, F21, F24, F31 and F34. The amount of paracetamol released from the tablets was increased as the concentration of paracetamol increased; however, the variation was not significant (p > 0.05). This might be attributed to the reduction of tablet hardness upon increasing paracetamol concentration which results in faster dissolution rate. The amounts dissolved from formulations at lower amounts of paracetamol concentration (20% w/w) in 30 min were in the order: spray dried NDS (95.1 %) > spray dried AMDS (94.3
%) > Starch 1500 ®
(91.5 %); however, the variation was not significant (p > 0.05). All formulations fulfilled the specification of the USP 30/NF 25 (2007), ie., > 80% of the tablet content should be released within 30 min.
0 10 20 30 40 50 60 0
20 40 60 80 100 120
C
u
mu
la
ti
ve
re
le
a
se
(%
)
Time (min)
F11 F14 F21 F24 F31 F34
Figure 9: Dissolution profiles of spray dried NDS, spray
dried AMDS & Starch 1500 ®
at 20 & 50% paracetamol concentrations.
CONCLUSION
The physicochemical properties of AMDS compared
well, in many respects, with those of Starch 1500 ®
. No significant difference was found in tapped & bulk
densities of AMDS and Starch 1500 ®
. Spray dried AMDS showed excellent flow property and compactibility, which indicates its potential use as a directly compressible excipient.
The lubricant sensitivity test revealed that spray dried AMDS showed less lubricant sensitivity than that of
spray dried NDS and Starch 1500 ®
by yielding tablets with higher crushing strength and acceptable friability values up to 1% magnesium stearate concentrations. Moreover, spray dried AMDS revealed higher dilution potential than those of spray dried NDS and Starch
1500 ®
good dilution potential make AMDS a good candidate for directly compressible excipient.
From the foregoing, it can be concluded that AMDS can
be used as an alternative to Starch 1500 ®
as directly compressible excipient in tablet formulations.
REFERENCES
1. Adenuga Y.A., Odeku O.A., Adegboye T.A., Itiola O.A. (2008). Comparative evaluation of the binding properties of two species of khaya gum polymer in paracetamol tablet formulation, Pharm. Dev. Techno. 13: 473-480.
2. Aoshima H., Miyagisnima A., Nozawa Y., Saduka Y., Sonobe T. (2005). Glycerin fatty acid esters as a new lubricant of tablets, Int. J. Pharm. 293: 25-34.
3. Atichokudomchai N., Shobsngob S., Chinachoti P., Varavinit S. (2001). Study of some physicochemical properties of high-crystalline tapioca starch, Starch/Stärke 53: 577 - 581. 4. BP (2009). British pharmacopeia: The Pharmaceutical Press,
Her Majesty’s Stationery Office, London, vol. I- VI. 5. Chang Y.L., Shao Y.Y., Tseng K.H. (1995). Gelation
mechanism and rheological properties of rice starch, Cereal Chem. 74: 339.
6. Daramola B., Osanyinlusi S.A. (2006). Investigation on modification of cassava starch using active components of ginger roots (Zinger officinale Roscoe), Afr.J.Biotechnol. 5: 917-920.
7. Elessandra R.Z., Alvaro R.G. (2011). Impact of heat-moisture treatment and annealing in starches: A review, Carbohyd Polym83: 317–328.
8. Franco C.M.L., Cabral R.A.F., Tavares D.Q. (2002). Structural and physicochemical characteristics of lintnerized native and sour cassava starches, Starch/ Stärke54: 469–475. 9. Gebre-Mariam T., Schmidt P.C. (1998). Some physico-chemical properties of dioscorea starch from Ethiopia,
Starch/Stärke 50: 242 - 246.
10. Himjyoti D., Sanjib K.P., Dipankar K., Charu L.M. (2011). Effect of acid concentration and treatment time on acid– alcohol modified jackfruit seed starch properties, Food Chem. 128: 284–291.
11. Iromidayo B.O., Adeniyi T.A., Kayode O.A. (2010). Effect of heat moisture treatment on the functional and tabletting properties of corn starch, African J. Pharmacy and Pharmacol.4: 498-510.
12. Jarosz P.J., Parrott E.L. (1984). Effect of lubricants on tensile strengths of tablets, Drug Develop. and Indust. Pharmacy10: 259–273.
13. Jiang Q., Gao W., Li X., Zhang J., Huang L. (2011). Effect of acid-ethanol on the physicochemical properties of Dioscorea opposita Thunb. and Pueraria thomsonii Benth. Starches,
Starch/ Stärke63: 302–310.
14. Jitka M., Irena E. (2011). A study of the compaction process and the properties of tablets made of a new co-processed starch excipient, Drug Develop. & Ind. Pharm.37: 576–582. 15. Kemas U.C., Nep E.I., Agbowuro A.A., Ochekpe N.A. (2012). Effect of chemical modification on the proximate composition of Plectranthus esculentus starch and characterization using FTIR spectroscopy, World J. pharm. Res. 5: 1234-1249.
16. Limwong V., Suthanthavibul N., Kulvanich P. (2004). Spherical composite particles of rice starch and microcrystalline cellulose: a new coprocessed excipient for direct compression, AAPS Pharm. Sci. Tech. 5:1-10. 17. Mitrevej A., Faroongsarng D., Sinchaipanid N. (1996).
Compression behavior of spray dried rice starch, Int. J. Pharm. 140: 61 – 68.
18. Mollan M.J., Celik M. (1996). The effects of lubrication on the compaction and post compaction properties of directly compressible maltodextrins, Int. J. Pharm. 144: 1-9.
19. Mukesh C.G., Rajesh K.P., Manali D.P., Bhavika H.Z. (2011). Peparation and evaluation of material properties of co-processed diluents containing modified starch and dicalcium phosphate, IJPSR2: 543-551.
20. Mutungi C., Onyango C., Rost F., Doert T., Jaros D., Rohm H. (2010). Structural and physicochemical properties and in vitro digestibility of recrystallized linear a-D-(1α4) glucans derived from mild-acid-modified cassava starch, Food Res. Int. 43: 1144–1154.
21. Odeku O.A., Akinwande B.L. (2011). Effect of the mode of incorporation on the disintegrant properties of acid modified water and white yam starches, Saudi Pharm. J.19: 95–105. 22. Odeku O.A., Picker-Freyer K.M. (2009). Characterization of
acid modified Dioscorea starches as direct compression excipient, Pharm. Dev. Tech. 14: 259-270.
23. Olayemi O.J., Oyi A.R., Allagh T.S. (2008). Comparative evaluation of maize, rice and wheat starch powders as pharmaceutical excipients, J.Pharm. Sci.7: 131-138. 24. Omojola M.O., Manu N., Thomas S.A. (2011). Effect of acid
hydrolysis on the physicochemical properties of cola starch,
Afr.J. Pure and Appl. Chem. 5: 307-315.
25. Osunsam A.T., Akingbala J.O., Oguntimein G.B. (1989). Effects of storage on starch content and modification of cassava starch, Starch/ Stearke 41: 54–57.
26. Parrott E.L. (1989). Comparative evaluation of a new direct compression excipient Soludex-15, Drug Dev. Ind.Pharm.
15:561-583.
27. Russel J., Lantz J. (2005). Unit Operations and Mechanical Properties: Particle and Powder Bed Properties.
Pharmaceutical Dosage Forms, 3
rd
ed, Marcel Dekker Inc., New York, pp. 166-167.
28. Sameer G.L., Yu Y.Y., Ajay K.B. (2009). Effects of disintegration-promoting agent, lubricants and moisture treatment on optimized fast disintegrating tablets, Int. J. Pharmaceutics365: 4–11.
29. Sheskey P.J., Robb R.T., Moore R.D. (1995). Effects of lubricant level, method of mixing and duration of mixing on a controlled release matrix tablet containing hydroxypropyl methylcellulose, Drug Dev. Ind. Pharm. 21: 2151-2165. 30. Soni P.L., Sharma H., Dun D., Gharia M.M. (1993).
Physicochemical properties of Quercus leucotrichophora
(Oak) starch, Starch/Starke45: 127-130.
31. Stone, L. A., Loenz, K., Collins, F. (1984). The Starch of Amaranthus: physicochemical properties and functional characteristics, Starch/starke36 (7): 232.
32. Timucin U., Murat T. (2008). Hexagonal boron nitride as a tablet lubricant and a comparison with conventional lubricants, Int. J. Pharmaceutics53: 45–51.
33. USP 30/ NF 25 (2007), United States Pharmacopoeial Convention, Inc, Rockville, Maryland.
34. Wang L., Wang Y. (2001). Structures and physicochemical properties of acid-thinned corn, potato and rice starches,
Starch/Stärke 53: 570 - 576.
35. Wells J. (2002). Pharmaceutical preformulation: The physicochemical properties of drug substances. In: Aulton, M. E. (ed.), Pharmaceutics: The Science of Dosage Form
Design, 2
nd