The Impact of Vicarious Experiences and Field Experience Classroom
Characteristics on Preservice Elementary Science Teaching Efficacy
Ron Wagler
The University of Texas at El Paso
Abstract
The purpose of this study was to investigate the impact of vicarious experiences and field experience classroom characteristics (e.g., student socioeconomic status) on preservice science teaching efficacy. The participants were forty six preservice elementary teachers enrolled in a field experience based elementary science education course and twenty inservice teachers. A pretest was administered to the preservice elementary teachers early in the semester and consisted of demographic questions and the Science Teaching Efficacy Belief Instrument B (STEBI-B). A posttest was administered to the preservice elementary teachers at the end of the semester and consisted of field experience questions and the STEBI-B. The field experience inservice teachers provided personal, professional, and classroom characteristics data in the middle of the semester.
Unique to this study is the finding that enactive mastery experiences did not change the preservice elementary teacher’s science teaching efficacy during their field experiences as Bandura’s self-efficacy theory proposes. Also unique to this study are the findings that variables of student ethnicity, student socioeconomic status and preservice teacher program placement were significant predictors of the preservice elementary teachers’ science teaching efficacy during their vicarious experiences. Even though variables of student ethnicity, student socioeconomic status and preservice teacher program placement negatively impacted preservice science teaching efficacy levels, preservice teachers should be placed in these environments when effective support exists. This support has
the potential to reverse the negative declines observed in the preservice elementary teacher’s science teaching efficacy scores and better equip the preservice elementary teacher with the techniques needed to meet the diverse needs of their students.
Correspondence concerning this manuscript should be addressed to Dr. Ron Wagler, The University of Texas at El Paso, Department of Teacher Education, 500 West University Avenue, Education Building 601, El Paso, TX 79968, Email: [email protected]
Introduction
studies, which predominately utilized the Teacher Efficacy Scale (Gibson & Dembo, 1984), focused on capturing teacher efficacy in a nonspecific context. More recently there has been a movement to develop teacher efficacy instruments and conduct studies, again rooted in Bandura’s self-efficacy theory, that focus on more specific contexts of teaching such as science teaching.
According to Bandura’s self-efficacy theory, vicarious experiences are one of the main sources that influence the efficacy of the individual teacher and “alter efficacy beliefs through transmission of competencies and comparison with the attainment of others;” (Bandura, 1997, p. 79). Multiple studies have provided evidence of the role that vicarious experiences play in influencing self-efficacy (Bandura, 1986; Bandura & Jourden, 1991; Bandura & Menlove, 1968). A vicarious experience, within the context of teacher efficacy, refers to an individual observing another individual teach. Vicarious experiences are a common component of preservice teacher education programs and occur during the preservice teacher’s field experiences. The impact that a vicarious experiences has on an individual’s teacher efficacy varies for a preservice teachers versus an experienced inservice teacher.
Even though field observations (i.e., vicarious experiences) are a major component of preservice elementary teacher training programs, no research has been done to evaluate the impact these vicarious experiences have on the teaching efficacy of preservice elementary teachers. Furthermore, the relationship between the field experience classroom characteristics (e.g., student socioeconomic status), where the preservice elementary teachers conducted their vicarious experiences, and science teaching efficacy has also not been explored. These are two important components of effective science teaching and learning within the context of preservice teacher training programs and nothing is empirically known about their interactions. The purpose of this study was to investigate the impact preservice elementary teacher field observations (i.e., vicarious experiences) and field experience classroom characteristics had on preservice elementary science teaching efficacy.
Theoretical Framework
A Brief Historical Overview of Efficacy Research
In the late 1970’s a second line of efficacy thought developed from Bandura’s theory of self-efficacy (Bandura, 1977). Bandura (1997) defines self-efficacy as “beliefs in one’s capabilities to organize and execute the courses of action required to produce given attainments” (p. 3). “Self-efficacy is a future-oriented belief about the level of competence a person expects he or she will display in a specific situation” (Tschannen-Moran et al., 1998, p. 207). Bandura also proposed that “self-efficacy beliefs influence thought patterns and emotions that enable actions in which people expend substantial effort in pursuit of goals, persist in the face of adversity, rebound from temporary setbacks, and exercise some control over events that affect their lives” (Tschannen-Moran et al., 1998, p. 210). Bandura’s theory of self-efficacy would later influence the development of such efficacy instruments as the Teacher Efficacy Scale (Gibson & Dembo, 1984), the Ashton Vignettes (Ashton, Buhr, & Crocker, 1984), the Science Teaching Efficacy Belief Instrument (STEBI) (Riggs & Enochs, 1990), the Ohio State Teacher Efficacy Scale (Tschannen-Moran et al., 1998) and others.
Vicarious Experience: A Principle Source of Efficacy
According to self-efficacy theory (Bandura, 1997), beliefs “are constructed from four principle sources of information” (Bandura, 1997, p. 79): enactive mastery experience; vicarious experience; verbal persuasion; and physiological and affective states. Within the context of teaching, an enactive mastery experience is the act of teaching by the individual. A vicarious experience is an individual observing another individual teach. Verbal persuasion is any teaching information conveyed to the individual by another individual. Physiological and affective states are physiological and emotional states an individual experiences while engaging in events associated with the first three principle sources of information. Tschannen-Moran et al. (1998) and other educational researchers had used Bandura’s four principle sources of information in their teacher efficacy models and teacher efficacy instruments.
Bandura proposes that modeling from another individual is an effective tool for enhancing the self-efficacy of an individual during a vicarious experience. Within the context of field experiences this occurs when the preservice field experience teacher observes, as a participating observer or as a passive observer, an inservice teacher teach. In this example, the inservice teacher (the model) has the potential, during the vicarious experience, to influence the science teaching efficacy of the preservice teacher.
According to Bandura when a person observes another similar individual successfully model a given event, individual efficacy beliefs are typically raised. Conversely, when a person observes another similar individual fail at a given event, individual efficacy beliefs typically decline (Bandura, 1997). Successful events are much more effective at increasing efficacy if the individual being observed is deemed competent by the observer (Bandura, 1997). Competence at a given task, activity or event has been shown to be more effective at increasing efficacy than the age of the model, sex of the model or other personal characteristics (Bandura, 1997). “Model competence is an especially influential factor when observers have a lot to learn and models have much they can teach them by instructive demonstration of skills and strategies” (Bandura, 1997, p.101).
Preservice Elementary Science Teaching Efficacy Research
Because teacher efficacy is believed to be both subject-matter and context specific (Tschannen et al., 1998), Riggs and Enochs (1990) developed the Science Teaching Efficacy Belief Instrument (STEBI) to measure efficacy of science teaching in inservice teachers. The authors identified two uncorrelated factors within STEBI, which they named personal science teaching efficacy (PSTE) and science teaching outcome expectancy (STOE). The PSTE scale measured a teachers’ belief in their ability to
perform a given behavior; the STOE scale measured a teachers’ belief that effective teaching can result in student learning (Riggs & Enochs, 1990). Enochs and Riggs (1990) later developed the Science Teaching Efficacy Belief Instrument B (STEBI-B). The STEBI-B is identical to the STEBI except items 20 and 25 have been removed and the verb tenses of some of the 23 items have been changed. These changes were made so the instrument, which was originally designed for inservice teachers, could be used with preservice teachers (Enochs & Riggs, 1990).
Schoon and Boone’s (1998) work with preservice elementary teachers using the STEBI-B (Enochs & Riggs, 1990) has shown there is an association between elementary teachers’ low science efficacy beliefs and alternative science concepts. The study found that holding certain alternative concepts about science such as planets can only be seen with a telescope, dinosaurs lived the same time as cave-men, and that north is toward the top of a map of Antarctica were linked to preservice teachers with low science teaching efficacy. The study also found that preservice teachers that held fewer numbers of alternative concepts had significantly higher science teaching efficacy levels (Schoon & Boone, 1998).
in the elementary curriculum is considered, “the findings of their study suggest that teaching in an integrated fashion and planning interdisciplinary units would seem to be no more effective than traditional teaching in terms of developing the science teaching efficacy of the students” (King & Wiseman, 2001, p. 149).
There are also data to suggest that the number of high school science subjects studied can have a long term effect on the science efficacy of preservice teachers. Mulholland, Dorman and Odgers (2004) used the STEBI-B to assess the science teaching efficacy of 314 elementary preservice teachers. They found that the preservice teachers’ PSTE scores were positively related to the number of science subjects studied at the high school level but not to their STOE scores. Completing two science teaching classes with the preservice teacher training program also had a significant positive effect on the PSTE but not on the STOE of the subjects.
Utley, Moseley and Bryant (2005) explored the impact an elementary methods course and student teaching had on both science and mathematics preservice teacher efficacy. Their study, which used both the STEBI-B and the Mathematics Teacher Efficacy Beliefs Instrument (MTEBI) (Huinker & Enochs, 1995), found both a positive and negative relationship between science and mathematics teaching efficacy in their sample population of elementary preservice teachers. Specifically, as the preservice teachers progressed in their methods courses their mathematics and science teacher efficacy also increased significantly. Both science and mathematics efficacy showed a slight decrease after student teaching.
Moseley and Utley (2006), in a related study, found that preservice elementary teachers’ mathematics and science teaching efficacy were impacted by an earth systems science course that incorporated both mathematics and science content. Science teaching efficacy, science teaching outcome expectancy and personal mathematics teaching efficacy increased over the semester for students enrolled in this course. Students not enrolled in the course did not experience this increase.
Palmer (2006) conducted a longitudinal study with preservice elementary teachers to see if their science teaching efficacy beliefs changed over time. The STEBI-B was used. It was found that the preservice elementary teacher’s science teaching efficacy beliefs increased from the beginning of a science methods course to the end of a science methods course. The STEBI-B was administered nine months after the end of the science methods course and the efficacy increase experienced during the science methods course was still present.
Socioeconomic Status, Ethnicity and Educational Outcomes
scored about two-thirds of a standard deviation below whites in math (the equivalent of roughly 10 points on a test with a mean of 100 and a standard deviation of 15) and just under half a standard deviation (7–8 points) below whites in reading” (Duncan & Magnuson, 2005, p. 36).
Duncan and Magnuson (2005) considered “whether the disparate socioeconomic circumstances of families in which white, black, and Hispanic children grow up account for the racial and ethnic gaps in school readiness among American preschoolers” (Duncan & Magnuson, 2005,p. 35). Their study, which surveyed “links between socioeconomic resources and test score gaps indicates that resource differences account for about half of the standard deviation—about 8 points on a test with a standard deviation of 15—of the differences” (Duncan & Magnuson, 2005,p. 35).
Student SES and educational outcomes has also been found to be correlated (Arnold & Doctoroff, 2003; Duncan, Yeung, Brooks-Gunn, & Smith, 1998; Duncan & Brooks-Gunn, 2000; Lee & Burkam, 2002; McLoyd, 1998; Yeung, Linver, & Brooks-Gunn, 2002) with the general trend being the higher a student’s SES, the stronger her or his educational outcomes are likely to be (Noel & de Broucker, 2001; Organisation for Economic Co-operation and Development, 2004; Palardy, 2008). Parents from low SES households are less likely to read to their children (Federal Interagency Forum on Child and Family Statistics, 2005; Lee & Burkam, 2002) and less involved in their children’s schooling (Evans, 2004). Low SES children also have less exposure to books at home (Evans, 2004; Lee & Burkam, 2002; Vernon-Feagans, Hammer, Miccio, & Manlove, 2002).
Schools that are located in low SES areas face many socioeconomic problems such as mental health issues, higher levels of unemployment, “migration of the best qualified young people and, not least, low educational achievement (Gore & Smith, 2001). To compound this, schools in these areas often face other pressures such as challenging pupil behaviour, high levels of staff turnover, and a poor physical environment” (Muijs, Harris, Chapman, Stoll, & Russ, 2004, p. 150). “Sirin (2005) confirmed that “family SES at the student level is one of the strongest correlates of academic performance” (p. 438). For example, higher socioeconomic status students typically have higher scores on standardized achievement tests and are more likely to complete secondary school and university than their peers from lower SES backgrounds (Blossfeld & Shavit,1993; Willms, 1999)” (Perry & McConney, 2010, p. 1138).
When research associated with improving schools in disadvantaged areas in assessed, a small number of broad positive themes arise (Muijs, Harris, Chapman, Stoll, & Russ, 2004). These themes include “a focus on teaching and learning, leadership, creating an information-rich environment, creating a positive school culture, building a learning community, continuous professional development, involving parents, external support and resources” (Muijs, Harris, Chapman, Stoll, & Russ, 2004, p. 149).
Methodology
Research Questions
Two research questions defined the study:
Research Question 1: What was the impact of the vicarious experiences (i.e., preservice elementary teacher field observations) on the preservice elementary teacher’s science teaching efficacy?
Research Question 2: What was the impact of the characteristics of the field experience classroom (e.g., student socioeconomic status), within the given school where the vicarious experiences occurred, on the preservice elementary teacher’s science teaching efficacy?
Participants
The participants consisted of forty six undergraduate elementary preservice teachers (45 Female, 1 Male; Mean Age: 22, Minimum Age: 20, Maximum Age: 29, Median Age: 22; 41 White, 4 American Indian/or Alaskan, 1 Hispanic/Latino) who were enrolled in a field experience based elementary science education course at a large Midwestern state university and twenty inservice teachers (19 Female, 1 Male; Mean Age: 44, Minimum Age: 24, Maximum Age: 59, Median Age: 40; 18 White, 2 American Indian/or Alaskan) whose classrooms served as sites for the preservice teachers’ field experiences. For the demographics of the students in the inservice teachers classrooms see Table 4. The course the preservice elementary teachers were enrolled in involved direct observations of inservice teachers in classroom environments (i.e., kindergarten through eighth grade). Twelve of the forty six preservice teachers were also enrolled in a more rigorous elementary preservice teacher program that allows for more teaching and more observation (i.e., 90 hours) than the program the other thirty four preservice teachers were enrolled in. These thirty four preservice teachers were enrolled in an elementary preservice teacher program that required 45 hours of observation. For both programs no procedures were in place to ensure that these teaching events included multiple classroom contexts with diverse students. Neither program implemented, over the course of the semester, teaching events that progressed from less frequent to more frequent, less challenging to more challenging nor from less complex to more complex.
Instrument
(Strongly Disagree) to 5 (Strongly Agree). After thorough analyses, Enochs and Riggs (1990) concluded that the STEBI-B could be considered reliable and reasonably valid with a stable and unified factor structure.
Procedures
At the beginning of the semester, before field experiences began, the preservice teachers provided demographic data and completed the STEBI-B. At the end of the same semester, after field experiences were completed, the preservice teachers rated the inservice teacher they observed during their educational field experiences, provided data about classroom events that occurred while doing their field experiences and again completed the STEBI-B. Table 3 presents the variables that correspond to the questions the preservice teachers answered. In the middle of the spring semester the field experience inservice teachers provided personal, professional, and classroom characteristics data. Table 4 presents the variables that correspond to the questions the inservice teachers answered.
Statistical Analysis
The researcher applied the ANCOVA analysis models to assess possible correlations between the two factors (PTSE and STOE) and all collected data variables associated with the preservice teachers, the inservice teachers, the demographics of the classroom students and the characteristics of the classrooms where the field experiences occurred (See Table 3 and 4).
Results
Testing Instruments Data Analysis
Principal Components Analysis. Principal Components Analysis (PCA) was
performed on the participants Science Teaching Efficacy Belief Instrument B (STEBI-B) pretest and posttest responses. PCA transforms a set of correlated variables into a smaller set of uncorrelated variables (Johnson, 1998). This uncorrelated set of variables is called the principal components. Using PCA is advisable in determining the number of factors to use in factor analysis (Johnson, 1998). PCA found two components for the STEBI-B pretest and the STEBI-B posttest responses. For the STEBI-B pretest response variable, two principal components accounted for 40.3% of the variance. Two principal components accounted for 47.7% of the variance for the STEBI-B posttest response variables. Based on the PCA results, factor analysis was run with two factors for the STEBI-B pretest and posttest.
Bootstrapped Factor Analysis. Due to the small sample size, bootstrapped factor
the posttest were combined. The Appendix presents these combined factor loadings for the STEBI-B pretest and posttest. Item #6 was used as PSTE based on the original instrument (Enochs & Riggs, 1990) and item #9 was omitted from the current study based on incorrect factor loading.
Cronbach’s Alpha Reliability Analysis. Cronbach’s alpha reliability analysis was
conducted on both factors of the STEBI-B pretest and posttest. Table 1 contains the results. All STEBI-B Cronbach’s alpha reliability results were above the 0.7 cut off that defines satisfactory internal reliability of an instrument. Concerning the specific STEBI-B Cronbach’s alpha reliability results it should be noted that the internal reliability of the instrument increased from the pretest to the posttest for factor 1 (PSTE) and factor 2 (STOE). This trend further increases the validity of conclusions associated with the STEBI-B.
Table 1
Cronbach’s Alpha Reliabilities
STEBI-B Factor 1(PSTE) Factor 2 (STEO)
Pretest Posttest Pretest Posttest
.846 .909 .727 .770
Summary Testing Instrument Statistics. Table 2 presents the means, standard
deviations, t-test values and probabilities for the pretest and posttest scores on the STEBI-B. Statistics for both factors PSTE and STOE linked with the STEBI-B are presented for both the pretest and posttest. A t-test (α = 0.10) revealed that the PSTE posttest mean of 3.96 was significantly greater than the pretest mean of 3.78 (t = -2.519, p = 0.015). Similarly, the STOE posttest mean of 3.69 was significantly greater than the pretest mean of 3.49 (t = -1.979, p = 0.054).
Table 2
STEBI-B Summary Testing Instrument Statistics
PSTE pretest PSTE posttest STOE pretest STOE posttest
Mean 3.78 3.96 3.49 3.69
S.D. 0.524 0.603 0.527 0.535
t-test -2.519 -1.979
P(t) 0.015 0.054
Introduction to Research Question 1 and 2 Analysis
model. This variable selection method selects the most parsimonious set of factors for the ANCOVA linear model. The categories associated with each variable for research question 1 (See Table 3) and for research question 2 (See Table 4) were based on the distribution of the data for each specific category. To ensure the results were interpretable the responses were grouped into a manageable number of categories. There was also an attempt to equalize the number of subjects in each category in order to pick up true existing differences between the categories.
Research Question 1 Analysis
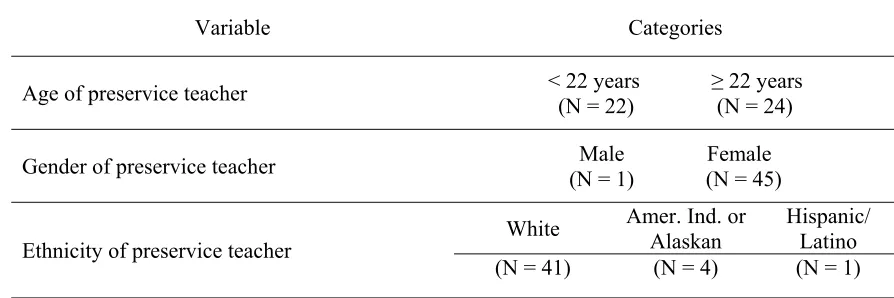
Table 3 lists the variables associated with research question 1. Each variable is presented along with the categories related to that variable. N denotes the number of preservice elementary teachers in the category. The ANCOVA analysis model takes the total number of science lessons (i.e., one lesson is equal to 30 minutes) the preservice teacher taught (i.e., enactive mastery experience) and subtracts it from the total number of hours the preservice teachers observed (i.e., vicarious experiences) the inservice teacher. The total number of hours the preservice teachers observed the inservice teacher was 45 hours during the semester for the rigorous teacher education program and 90 hours during the semester for the more rigorous program. For example, if a preservice elementary teacher that was enrolled in the rigorous teacher program taught (i.e., enactive mastery experience) four science lessons (i.e., 2 hours total) during the semester, then they observed an inservice teacher for 43 hours. The same statistical procedure is carried out for the “total number of lessons the preservice teacher taught.” The ANCOVA model takes all of this into account so an observing (i.e., vicarious experiences) variable is not needed in Table 3 and would introduce problems with multicollinearity.
Table 3
Variables and Categories Associated with Research Question 1
Variable Categories
Age of preservice teacher < 22 years ≥ 22 years
(N = 22) (N = 24)
Gender of preservice teacher (N = 1) (N = 45) Male Female
Ethnicity of preservice teacher White
Amer. Ind. or Alaskan
Hispanic/ Latino
(N = 41) (N = 4) (N = 1)
Rating of the inservice field experience teacher
by the preservice teacher Likert Scale 1-5 (Poor to Excellent)
Total number of lessons the preservice teacher taught
1 2-4 5-10 12-50
(N = 12) (N = 10) (N = 13) (N = 11)
Number of science lessons the preservice
teacher taught (N = 14) 0 1 (N = 22) (N = 10) 2-10
Self-rating of the science lessons taught by the
preservice teacher Likert Scale 1-5 (Poor to Excellent)
Self-rating of all lessons taught by the
preservice teacher Likert Scale 1-5 (Poor to Excellent)
STEBI-B Results. For both PSTE and STOE, the ANCOVA model for research question 1 had no statistically significant independent variables (α = 0.10).
Research Question 2 Analysis
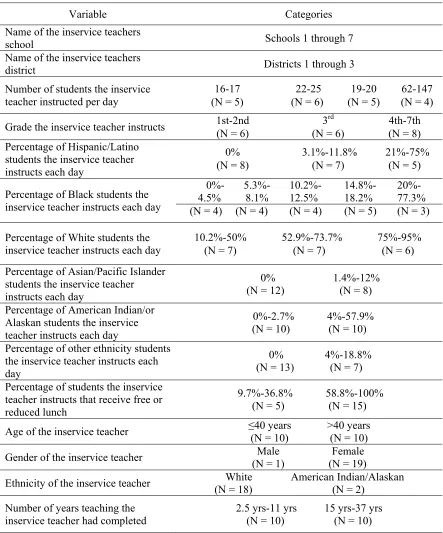
Table 4 lists the variables associated with research question 2. Each variable is presented along with the categories related to that variable. N denotes the number of inservice elementary teachers in the category except for “Type of elementary preservice teacher program” which denotes the number of preservice elementary teachers in this category.
Table 4
Variables and Categories Associated with Research Question 2
Variable Categories Name of the inservice teachers
school Schools 1 through 7
Name of the inservice teachers
district Districts 1 through 3
Number of students the inservice teacher instructed per day
16-17 22-25 19-20 62-147
(N = 5) (N = 6) (N = 5) (N = 4)
Grade the inservice teacher instructs 1st-2nd 3(N = 6) (N = 6) rd 4th-7th (N = 8)
Percentage of Hispanic/Latino students the inservice teacher instructs each day
0% 3.1%-11.8% 21%-75%
(N = 8) (N = 7) (N = 5)
Percentage of Black students the inservice teacher instructs each day
0%- 4.5%
5.3%-8.1%
10.2%-12.5%
14.8%-18.2%
20%-77.3%
(N = 4) (N = 4) (N = 4) (N = 5) (N = 3)
Percentage of White students the inservice teacher instructs each day
10.2%-50% 52.9%-73.7% 75%-95%
(N = 7) (N = 7) (N = 6)
Percentage of Asian/Pacific Islander students the inservice teacher instructs each day
0% 1.4%-12% (N = 12) (N = 8) Percentage of American Indian/or
Alaskan students the inservice teacher instructs each day
0%-2.7% 4%-57.9% (N = 10) (N = 10)
Percentage of other ethnicity students the inservice teacher instructs each day
0% 4%-18.8% (N = 13) (N = 7) Percentage of students the inservice
teacher instructs that receive free or reduced lunch
9.7%-36.8% 58.8%-100% (N = 5) (N = 15)
Age of the inservice teacher ≤40 years >40 years
(N = 10) (N = 10)
Gender of the inservice teacher Male Female
(N = 1) (N = 19)
Ethnicity of the inservice teacher (N = 18) (N = 2) White American Indian/Alaskan
Number of years teaching the inservice teacher had completed
2.5 yrs-11 yrs 15 yrs-37 yrs (N = 10) (N = 10)
Note. Table 4 continues on the next page
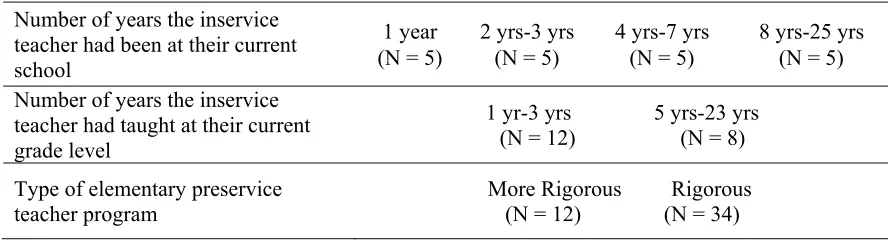
Variables and Categories Associated with Research Question 2, continued
Number of years the inservice teacher had been at their current school
1 year 2 yrs-3 yrs 4 yrs-7 yrs 8 yrs-25 yrs
(N = 5) (N = 5) (N = 5) (N = 5)
Number of years the inservice teacher had taught at their current grade level
1 yr-3 yrs 5 yrs-23 yrs (N = 12) (N = 8)
Type of elementary preservice teacher program
More Rigorous Rigorous (N = 12) (N = 34)
STEBI-B Results. The final ANCOVA model for research question 2, PSTE of
the STEBI-B test includes three independent variables as well as the covariate. Table 5 contains the ANCOVA model results. In the ANCOVA table, ‘Group’ refers to the collective effect of the independent variables in the model while ‘Covariate’ refers to the effect of the covariate (the pretest score on the STEBI-B) on the response variable (the posttest score of the STEBI-B).
Table 5
ANCOVA Model Results for Research Question 2, PSTE of the STEBI-B
Df Sum of Sq Mean Sq F Value Pr(F)
Group 3 1.024 2.563 0.094*
Covariate 1 3.080 3.080 23.138 <.001*
Error 15 1.997 0.133
*p< .10
The test for the significance of the covariate in the model resulted in an F test statistic of F* = 23.138 and an estimated p-value less than 0.001. The overall F test for equality of the means for each level of the independent variable was F* = 2.563 and had an estimated significance level of 0.094. PSTE of the STEBI-B yielded an ANCOVA model with one independent variable. The significant predictor for the ANCOVA model was the number of students that received free or reduced lunch (p = 0.020). Table 6 contains the means for PSTE of the STEBI-B posttest associated with the ANCOVA linear model. Adjusted means are computed for each category of each independent variable holding all other variables, including the covariate, constant using their respective mean values.
Table 6
Means for PSTE of the STEBI-B Posttest Associated with the ANCOVA
Variable Mean of Posttest STEBI-B
Percentage of students the inservice teacher instructs that
receive free or reduced lunch (9.7%-36.8%) 3.71
Percentage of students the inservice teacher instructs that
receive free or reduced lunch (58.8%-100%) 3.42
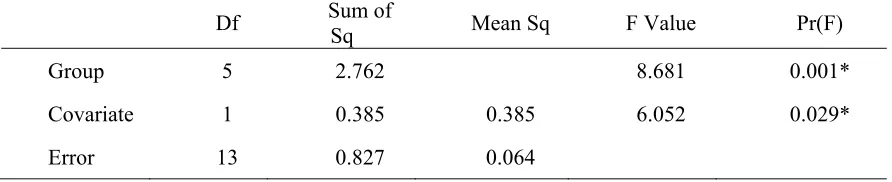
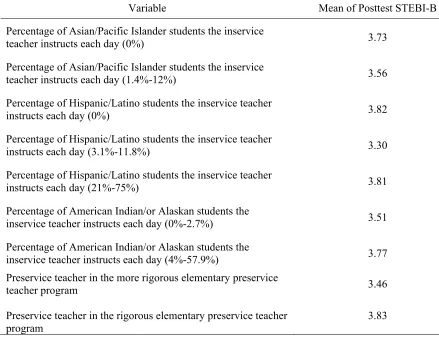
STOE of the STEBI-B yielded an ANCOVA model with four independent variables. Table 7 presents the ANCOVA results. Note that the test for the significance of the covariate yielded a significant F test (F* = 6.052, p = 0.029). The test for overall equality of the group means was also significant (F* = 8.681, p = 0.001). For the demographics of the students in the inservice teachers classrooms see Table 4. The significant predictors for the ANCOVA model included the percentage of Asian/Pacific Islander students (p = 0.087), the percentage of Hispanic/Latino students (p = 0.001), the percentage of American Indian/or Alaskan students (p = 0.029), and the indicator variable for the more rigorous elementary preservice teacher program participation (p = 0.006) (See Table 8).
Table 7
ANCOVA Model Results for Research Question 2, STOE of the STEBI-B
Df Sum of Sq Mean Sq F Value Pr(F)
Group 5 2.762 8.681 0.001*
Covariate 1 0.385 0.385 6.052 0.029*
Error 13 0.827 0.064
Table 8 contains the means for each level of each independent variable.
Table 8
Means for STOE of the STEBI-B Posttest Associated with the ANCOVA
Variable Mean of Posttest STEBI-B
Percentage of Asian/Pacific Islander students the inservice
teacher instructs each day (0%) 3.73
Percentage of Asian/Pacific Islander students the inservice
teacher instructs each day (1.4%-12%) 3.56
Percentage of Hispanic/Latino students the inservice teacher
instructs each day (0%) 3.82
Percentage of Hispanic/Latino students the inservice teacher
instructs each day (3.1%-11.8%) 3.30
Percentage of Hispanic/Latino students the inservice teacher
instructs each day (21%-75%) 3.81
Percentage of American Indian/or Alaskan students the
inservice teacher instructs each day (0%-2.7%) 3.51
Percentage of American Indian/or Alaskan students the
inservice teacher instructs each day (4%-57.9%) 3.77
Preservice teacher in the more rigorous elementary preservice
teacher program 3.46
Preservice teacher in the rigorous elementary preservice teacher program
3.83
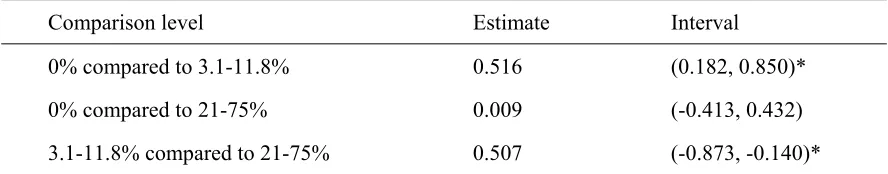
Table 9
Tukey Simultaneous Confidence Intervals for STOE of the STEBI-B
Comparison level Estimate Interval
0% compared to 3.1-11.8% 0.516 (0.182, 0.850)*
0% compared to 21-75% 0.009 (-0.413, 0.432)
3.1-11.8% compared to 21-75% 0.507 (-0.873, -0.140)*
*Significant interval
Research Findings
The research findings associated with the correlated variables of the study will be addressed in this section. These variables include the percentage of students that received free and reduced lunch for the personal science teaching efficacy (PSTE) factor. For the science teaching outcome expectancy (STOE) factor, the variables addressed will be percentage of Asian/Pacific Islander students, percentage of Hispanic/Latino students, percentage of American Indian/or Alaskan students and type of preservice teacher program.
Correlated Variables of the Study
Research Question 1. None of the variables associated with research question 1 (See Table 3) were found to be correlated to the preservice elementary teachers posttest PSTE and posttest STOE scores (α = 0.10). These variables included age, gender and ethnicity of the preservice teacher; rating of the inservice field experience teacher by the preservice teacher; total number of lessons the preservice teacher taught; number of science lessons the preservice teacher taught; self-rating of the science lessons taught by the preservice teacher and self-rating of all lessons taught by the preservice teacher.
Research Question 2. Five of the variables associated with research question 2
(See Table 4) were found to be correlated to the preservice elementary teacher’s posttest STEBI-B scores (α = 0.10). One variable, the percentage of students that received free and reduced lunch, (See Table 6) was found to be correlated to the preservice elementary teacher’s posttest PSTE scores. Four variables (See Table 8) were found to be correlated to the preservice elementary teacher’s posttest STOE scores. These variables were the percentage of Asian/Pacific Islander students, the percentage of Hispanic/Latino students, the percentage of American Indian/or Alaskan students and the type of preservice teacher program. The findings associated with research question 2 will be presented in this order.
PSTE, Percentage of Students that Received Free and Reduced Lunch. The
who received free and reduced lunch between 9.7% and 36.8% had a Likert-scale score closer to “Agree (4)” (Mean = 3.71) versus the mean score of the preservice teacher in an observation classroom with a percentage of students that received free and reduces lunch from 58.8% to 100% had a Likert-scale score between the midpoint of “Agree (4)” and “Uncertain (3)” (Mean = 3.42).
Based on this data we can conclude that if a preservice teacher was in an observation classroom with a percentage of students who received free and reduced lunch that fell between 9.7 and 36.8% their posttest STEBI-B PSTE score would be 0.29 higher than a preservice teacher who was in an observation classroom with a percentage of students who received free and reduced lunch between 58.8% and 100%.
STOE, Percentage of Asian/Pacific Islander Students. The preservice elementary
teachers posttest STOE scores were found to be correlated to the percentage of Asian/Pacific Islander students present in the preservice teachers observation classroom (p = 0.087). The posttest mean score (See Table 8) of the preservice teacher in an observation classroom with a no Asian/Pacific Islander students had a Likert-scale score closer to “Agree (4)” (Mean = 3.73) versus the mean score of the preservice teacher in an observation classroom with between 1.4% and 12% Asian/Pacific Islander students had a Likert-scale score between the midpoint of “Agree (4)” and “Uncertain (3)” (Mean = 3.56).
Based on this data we can conclude that if a preservice teacher was in an observation classroom with no Asian/Pacific Islander students their posttest STEBI-B STOE score would be 0.17 higher than a preservice teacher who was in an observation classroom with between 1.4% and 12% Asian/Pacific Islander students.
STOE, Percentage of Hispanic/Latino Students. The preservice elementary
teachers posttest STOE scores were found to be correlated to the percentage of Hispanic/Latino students present in the preservice teachers observation classroom (p = 0.001). The posttest mean score (See Table 8) of the preservice teacher in an observation classroom with no Hispanic/Latino students (Mean = 3.82) and 21% to 75% (Mean = 3.81) Hispanic/Latino students had a Likert-scale score close to “Agree (4)” versus the mean score of the preservice teacher in an observation classroom with 3.1% to 11.8% Hispanic/Latino students had a Likert-scale score closer to “Uncertain (3)” (Mean = 3.30). Table 7 also contains the Tukey simultaneous confidence intervals to determine where the means are significantly different since there are three levels. Note that the posttest STEBI-B factor 2 means for level 0% and level 3.1% to 11.8% are different as are the means for level 3.1% to 11.8% and level 21% to 75%. However, the means for level 0% and 21% to 75% are not statistically different.
0.51 higher than a preservice teacher who was in an observation classroom with 3.1% to 11.8% Hispanic/Latino students.
STOE, Percentage of American Indian/or Alaskan Students. The preservice
elementary teachers posttest STOE scores were found to be correlated to the percentage of American Indian/or Alaskan students present in the preservice teachers observation classroom (p = 0.029). The posttest mean score (See Table 8) of the preservice teacher in an observation classroom with a 4% to 57.9% American Indian/or Alaskan students had a Likert-scale score closer to “Agree (4)” (Mean = 3.77) versus the mean score of the preservice teacher in an observation classroom with 0% to 2.7% American Indian/or Alaskan students had a Likert-scale score between the midpoint of “Agree (4)” and “Uncertain (3)” (Mean = 3.51).
Based on this data we can conclude that if a preservice teacher was in an observation classroom with 4% to 57.9% American Indian/or Alaskan students their posttest STEBI-B STOE score would be 0.26 higher than a preservice teacher who was in an observation classroom with 0% to 2.7% American Indian/or Alaskan students.
STOE, Type of Preservice Teacher Program. The preservice elementary teachers
posttest STOE scores were found to be correlated to the type of preservice teacher program the preservice teachers were participating in (p = 0.006). The posttest mean score (See Table 8) of the preservice teacher not in the more rigorous program had a Likert-scale score closer to “Agree (4)” (Mean = 3.83) versus the mean score of the preservice teacher in the more rigorous program had a Likert-scale score between the midpoint of “Agree (4)” and “Uncertain (3)” (Mean = 3.46).
Based on this data we can conclude that if a preservice teacher was not in the more rigorous program their posttest STEBI-B STOE score would be 0.37 higher than a preservice teacher who was in the more rigorous program. Note that the impact that a vicarious experiences has on an individual’s teacher efficacy varies for a preservice teachers versus an experienced inservice teacher.
Implications
Research Question 1
None of the variables associated with research question 1 (See Table 3) were found to be correlated to the preservice elementary teachers posttest PSTE and posttest STOE scores. This finding is not noteworthy except for the variable “number of science lessons the preservice teacher taught” (See Table 3). According to Bandura’s self-efficacy theory, “enactive mastery experiences are the most influential source of efficacy
three categories based on the number of science teaching lessons they taught (0, 1 and 2-10) during their field experiences.
The ANCOVA model found no correlation between the preservice elementary teacher’s science teaching efficacy scores (PSTE and STEO) and the number of science teaching lessons (i.e., enactive mastery experiences) the preservice elementary teacher’s taught during their field experiences. This is an interesting finding and unique to this study. Based on Bandura’s assertion that “enactive mastery experiences are the most
influential source of efficacy information” (Bandura, 1997, p. 80) the assumption can be made that the number of science teaching lessons (i.e., enactive mastery experiences) the preservice elementary teacher’s taught during their field experiences should have some
statistically significant impact, positive or negative, on the preservice elementary teacher’s science teaching efficacy scores (PSTE and STEO). This is an area where a future large scale study is warranted.
This future study would be most informative in an elementary student teaching internship setting. Student teaching interns would be identified that had performed varying amounts of enactive mastery experiences (i.e., science teaching events) during their student teaching internship. These enactive mastery experiences would be measured in total hours over the entire internship. The student teaching interns would be given the Science Teaching Efficacy Belief Instrument B (STEBI-B) before the enactive mastery experiences had occurred and after these enactive mastery experiences were complete. Other quantitative/qualitative data would be collected to assess the student teaching intern’s perceived beliefs concerning the efficaciousness of the enactive mastery experiences they performed during the entire internship. Other perceived quantitative/qualitative data would be collected, from the student teaching intern, to verify their perceived beliefs concerning the support they received during their student teaching internship. This data would be used to rank the student teaching interns into a hierarchy that spanned from overall extremely negative enactive mastery experiences to overall extremely positive enactive mastery experiences (Likert Scale: extremely negative [1] to extremely positive [5]). These student teaching intern rankings could then be statistically weighted based on the number of hours of enactive mastery experience the student teaching interns experienced.
decrease in STEBI-B scores (PSTE and STEO) by the end of their student teaching internship.
Research Question 2
Variables of student ethnicity, student SES and preservice teacher training program placement were significant predictors of the preservice teachers’ science teaching efficacy during their vicarious experiences. This is the first teacher efficacy study to find statistically significant correlations between these variables in a vicarious experience setting. Within the current study, the correlated variables consisted of specific student ethnicities (See Table 8) and low student SES (See Table 6) negatively impacting preservice elementary teacher’s science teaching efficacy beliefs. The more rigorous elementary preservice teacher program (See Table 8) also negatively impacted the preservice elementary teacher’s science teaching efficacy beliefs.
Even though variables of student ethnicity, student SES and program placement negatively impacted preservice science teaching efficacy levels, preservice teachers should be placed in these environments when effective support exists (Guskey, 1986;
Guskey, 1989; Tschannen-Moran et al., 1998). This support should come from the coordinated efforts of the preservice teacher’s program faculty, their field experience inservice teacher and the cooperating field experience school (Tschannen-Moran et al., 1998). All three supporting entities should integrate preservice teacher training and school field experiences with research that addresses the complex interconnected relationship between SES, ethnicity and educational outcomes (e.g., Coleman et al., 1966; Duncan & Magnuson, 2005; Evans, 2004; Lee & Bryk, 1989; Lee & Smith, 1993, 1995; Lee et al., 1997; McNeal, 1997; Palardy, 2008; Park & Palardy, 2004; Perry & McConney, 2010; Sirin, 2005) and the implementation of effective research-based themes that have been demonstrated to improve schools in disadvantaged areas (Muijs, Harris, Chapman, Stoll, & Russ, 2004).
Furthermore, the field experience inservice teachers should be trained in effective mentoring techniques (Wagler & Moseley, 2005). These techniques, when used effectively by the inservice teacher, have the potential to increase the supportive role the mentoring inservice teacher can play in ensuring the preservice teacher’s field experiences are as efficacious as possible (Tschannen-Moran et al., 1998). Support and training of this nature has the potential to reverse the negative declines observed in the preservice elementary teacher’s science teaching efficacy scores and better equip the preservice elementary teacher with the skills needed to meet the diverse needs of their students (Wagler & Moseley, 2005).
cognitively understand why this drop has occurred, acquire the skills necessary to overcome the challenge, successfully overcome the challenge through effective teaching and return to a healthy teacher efficacy level (Tschannen-Moran et al., 1998).
Without this type of nurturing apprentice-like teacher training program the preservice teacher may end their field experiences with a lower level of teacher efficacy than before they began their field experiences. These same preservice teachers may be thrust into their student teaching internship, where support is typically less available, and may experience an even greater decline in preservice teacher efficacy (Hoy & Woolfolk, 1990; Tschannen-Moran et al., 1998; Wagler & Moseley, 2005; Utley, Moseley & Bryant, 2005). The end result may be a newly certified first year teacher that begins their first inservice year with a lower level of efficacy than before they began their preservice field experiences. It can be hypothesized that if the teacher’s efficacy continues to decrease over their first teaching year, the teacher’s ability to construct a highly effective learning environment will decrease and their probability of leaving the teaching profession will increase (Burley, Hall, Villeme, & Brockmeier, 1991; Hall, Burley, Villeme, & Brockmeier, 1992).
Conclusion
Unique to this study is the finding that enactive mastery experiences did not change the preservice elementary teacher’s science teaching efficacy during their field experiences as Bandura’s self-efficacy theory proposes. Also unique to this study are the findings that variables of student ethnicity, student SES and preservice teacher program placement were significant predictors of the preservice elementary teachers’ science teaching efficacy during their vicarious experiences. Even though variables of student ethnicity, student SES and preservice teacher program placement negatively impacted preservice science teaching efficacy levels, preservice teachers should be placed in these environments when effective support exists. This support has the potential to reverse the
negative declines observed in the preservice elementary teacher’s science teaching efficacy scores and better equip the preservice elementary teacher with the techniques needed to meet the diverse needs of their students.
References
Armor, D., Conroy-Oseguera, P., Cox, M., King, N., McDonnell, L., Pascal, A., Pauly, E., & Zellman, G. (1976). Analysis of the school preferred reading programs in selected Los Angeles minority schools (Rep. No. R-2007-LAUSD). Santa
Monica, CA: RAND. (ERIC document Reproduction Service No. 130 243).
Arnold, D. H., & Doctoroff, G. L. (2003). The early education of socioeconomically disadvantaged children. Annual Review of Psychology, 54, 517–545.
Ashton, P. (1985). Motivation and the teacher’s sense of efficacy. In C. Ames and R. Ames (Eds.), Research on motivation in education: Vol. 2. The classroom milieu
Ashton, P., & Webb, R. (1986). Making a difference: Teachers’ sense of efficacy and student achievement. New York: Longman.
Bandura, A. (1977). Self-efficacy: Toward a unifying theory of behavior change.
Psychology Review, 84, 191-215.
Bandura, A. (1986). Social foundations of thought and action: A social cognitive theory.
Englewood Cliffs, N.J.: Prentice-Hall.
Bandura, A. (1997). Self-efficacy: The exercise of control. New York: W. H. Freeman.
Bandura, A. & Menlove, F. L. (1968). Factors determining vicarious extinction of avoidance behavior through symbolic modeling. Journal of Personality and Social Psychology, 8, 99-108.
Bandura, A. & Jourden, F. J. (1991). Berman, P., McLaughlin, M., Bass, G., Pauly, E., & Zellman, G. (1977). Federal programs supporting education change : Vol. VII. Factors affecting implementation and continuation (Rep. No. R-1589/7-HEW).
Santa Monica, CA: RAND. (ERIC Document Reproduction Service No. 140 432).
Blossfeld, H. -P., & Shavit, Y. (1993). Persisting barriers: Changes in educational opportunities in thirteen countries. In Y. Shavit & H.-P. Blossfeld (Eds.),
Persistent inequality (pp.1–24). Boulder, CO: Westview.
Burley, W. W., Hall, B. W., Villeme, M. G., & Brockmeier, L. L. (1991, April) A path analysis of the mediating role of efficacy in first-year teachers’ experiences, reactions, and plans. Paper presented at the annual meeting of the American
Educational Research Association, Chicago.
Coleman, J. S., Campbell, C., Hobson, J., McPartland, F., Mood, F., et al. (1966).
Equality of educational opportunity. Washington, DC: U.S. Government Printing
Office.
Duncan, G. J., Yeung, W. J., Brooks-Gunn, J., & Smith, J. R. (1998). How much does childhood poverty affect the life chances of children? American Sociological Review, 63, 406–423.
Duncan, G. J., & Brooks-Gunn, J. (2000). Family poverty, welfare reform, and child development. Child Development, 71, 188–196.
Duncan, G. J., & Magnuson, K. A. (2005). Can family socioeconomic resources account for racial and ethnic test score gaps? The Future of Children, 15, 35–54. doi:10.1353/foc.2005.0004.
Evans, G. W. (2004). The environment of childhood poverty. American Psychologist, 59, 77–92.
Federal Interagency Forum on Child and Family Statistics. (2005). America’s children: Key indicators of well-being, 2005. Washington, DC: U.S. Government Printing
Office.
Gibson, S., & Dembo, M. (1984). Teacher efficacy: A construct validation. Journal of Educational Psychology, 76(4),569-582.
Gore, T., & Smith, N. (2001). Patterns of educational attainment in the British coalfields.
Sheffield, UK: Department for Education and Skills.
Guskey, T. (1981). Measurement of responsibility teachers assume for academic successes and failures in the classroom. Journal of Teacher Education, 32, 44–51.
Guskey, T. (1982). Differences in teachers’ perceptions of personal control of positive versus negative student learning outcomes. Contemporary Educational Psychology, 7, 70–80.
Guskey, T. (1986). Staff development and the process of teacher change. Educational Researcher, 15(5), 5-12.
Guskey, T. (1988). Teacher efficacy, self-concept, and attitudes toward the implementation of instructional innovation. Teaching and Teacher Education, 4,
63–69.
Guskey, T. (1989). Attitude and perceptual change in teachers. International Journal of Educational Research, 13, 439-453.
Hall, B., Burley, W., Villeme, M., & Brockmeier, L. (1992). An attempt to explicate teacher efficacy beliefs among first year teachers. Paper presented at the annual
meeting of the American Educational Research Association, San Francisco.
Hoy, W. K., & Woolfolk, A. E. (1990). Socialization of student teachers. American Educational Research Journal, 27, 279-300.
Huinker, D., & Enochs, L. (1995). Mathematics teaching efficacy beliefs instrument (MTEBI). Milwaukee: University of Wisconsin, Center for Mathematics and
Science Education Research.
Johnson, Dallas. (1998). Applied Multivariate Methods for Data Analysts. New York:
Duxbury Press.
King, K. P., & Wiseman, D. L. (2001). Comparing science efficacy beliefs of elementary education majors in integrated and non-integrated teacher education coursework.
Lee, V. E., & Bryk, A. S. (1989). A multilevel model of the social distribution of high school achievement. Sociology of Education, 62, 172–192.
Lee, V. E., & Smith, J. B. (1993). Effects of school restructuring on the achievement and engagement of middle-grade students. Sociology of Education, 66, 164–187.
Lee, V. E., & Smith, J. B. (1995). Effects of high school restructuring and size on gains in achievement and engagement for early secondary school students. Sociology of Education, 68, 241–279.
Lee, V. E., Smith, J. B., & Croninger, R.G. (1997). How high school organization influences the equitable distribution of learning in mathematics and science.
Sociology of Education, 70, 128–150.
Lee, V. E., & Burkam, D. T. (2002). Inequality at the starting gate: Social background differences in achievement as children enter school. Washington, DC: Economic
Policy Institute.
McLoyd, V. C. (1998). Socioeconomic disadvantage and child development. American Psychologist, 53, 185–204.
McNeal, R. B. (1997). High school dropouts: A closer examination of school effects.
Social Science Quarterly, 78, 209–222.
Moseley, C. & Utley, J. (2006). The effect of an integrated science and mathematics content-based course on science and mathematics teaching efficacy of preservice elementary teachers. Journal of Elementary Science Education, 18(2), 1-12.
Muijs, D., Harris, A., Chapman, C., Stoll, L., & Russ, J. (2004). Improving schools in socioeconomically disadvantaged areas—A review of research evidence. School Effectiveness and School Improvement, 15, 149-175.
Mulholland, J., Dorman, J. P., & Odgers, B. M. (2004). Assessment of science teacher efficacy of preservice teachers in an Australian university. Journal of Science Teacher Education, 15(4), 313-331.
Noel, S., & de Broucker, P. (2001). Intergenerational inequities: A comparative analysis of the influence of parents’ educational background on length of schooling and literacy skills. In W. Hutmacher, D. Cochrane, & N. Bottani (Eds.), In pursuit of equity in education: Using international indicators to compare equity policies
(pp. 277–298). Dordrecht, The Netherlands: Kluwer Academic.
Organisation for Economic Co-operation and Development. (2004). Learning for tomorrow’s world: First results from PISA 2003. Paris: Author.
Palmer, D. (2006). Durability of changes in self-efficacy of preservice primary teachers.
International Journal of Science Education, 28(6), 655–671.
Park, E., & Palardy, G. J. (2004). The impact of parental involvement and authoritativeness on academic achievement: A cross ethnic comparison. In S.J.
Paik & H. Walberg (Eds.), Advancing educational productivity: Policy implications from national databases (pp. 95–122). Greenwich, CT: Information Age.
Perry, L. B. & McConney, A. (2010). Does the SES of the school matter? An examination of socioeconomic status and student achievement using PISA 2003.
Teachers College Record, 112(4), 1137–1162.
Riggs, I., & Enochs, L. (1990). Towards the development of an elementary teacher’s science teaching efficacy belief instrument. Science Education, 74, 625-638.
Rotter, J. B. (1966). Generalized expectancies for internal versus external control of reinforcement. Psychological Monographs, 80, 1-28.
Schoon, K. J., & Boone, W. J. (1998). Self-efficacy and alternative conceptions of
science of preservice elementary teachers. Science Education, 82, 553-568.
Sirin, S. R. (2005). Socioeconomic status and academic achievement: A meta-analytic review of research. Review of Educational Research, 75, 417–453.
Tschannen-Moran, M., Woolfolk Hoy, A. W., & Hoy, W. K. (1998). Teacher efficacy: Its meaning and measure. Review of Educational Research, 68, 202-248.
Utley, J., Moseley, C., & Bryant, R. (2005). Relationship between science and mathematics teaching efficacy of preservice elementary teachers. School Science and Mathematics, 105(2), 40-45.
Vernon-Feagans, L., Hammer, C. S., Miccio, A., & Manlove, E. (2002). Early language and literacy skills in low-income African American and Hispanic children. In S. B. Neuman & D. K. Dickinson (Eds.), Handbook of early literacy research (pp.
192–210). New York: Guilford Press.
Wagler, R. & Moseley, C. (2005). Preservice teacher efficacy: Effect of a secondary education methods course and student teaching. Teacher Education and Practice, 18(4), 442-457.
Whitty, G. (2001). Education, social class and social exclusion. Education and Social Justice, 1(1), 2–8.
Willms, J. D. (1999). Quality and inequality in children’s literacy: The effects on families, schools, and communities. In D. P. Keating & C. Hertzman (Eds.),
Developmental health and the wealth of nations: Social, biological, and educational dynamics (pp. 72–93). New York: Guilford Press.
Yeung, W. J., Linver, M. R., & Brooks-Gunn, J. (2002). How money matters for young children’s development: Parental investment and family processes. Child Development, 73, 1861–1879.
Appendix
STEBI-B Original Factor Analysis
Item # Original Instrument Factorc
Loadings Factor 1 PSTE Factor 2 STOE Pretest 1 3 4 6 7 8 11 14 15 16 17 18 19 20 21 22 STOE PSTE STOE PSTEa STOE PSTE STOE STOE STOE STOE PSTE PSTE PSTE PSTE PSTE PSTE - 0.709 - - - 0.707 - - - - 0.676 0.751 0.646 0.562 0.543 0.588 0.625 - 0.494 0.594 0.494 - 0.761 0.619 0.654 0.628 - - - - - - Posttest 1 3 4 5 6 7 8 9 12 13 14 16 17 18 19 21 23 STOE PSTE STOE PSTE PSTEa STOE PSTE STOEb PSTE STOE STOE STOE PSTE PSTE PSTE PSTE PSTE - 0.519 - 0.793 0.734 - 0.649 0.503 0.791 - - - 0.709 0.859 0.778 0.775 0.695 0.713 - 0.816 - - 0.469 - - - 0.506 0.574 0.639 - - - - -
Note. Cut off for Factor Loading of >.45
aDouble Factor Loading. Item 6 was used as PSTE based on the original instrument (Enochs & Riggs, 1990).
STEBI-B Combined Factor Analysis
Item # Positive/Negative
Wording Original Instrument Factor Loadings Pretest Posttest Factor 1 PSTE 3 5 6 8 12 17 18 19 20 21 22 23 N P N N P N P N N N P N PSTE PSTE PSTE PSTE PSTE PSTE PSTE PSTE PSTE PSTE PSTE PSTE 0.709 0.326 0.375 0.707 0.367 0.676 0.751 0.646 0.562 0.543 0.588 0.378 0.519 0.793 0.734 0.649 0.791 0.709 0.859 0.778 0.437 0.775 0.270 0.695 Factor 2 STOE 1 4 7 11 13 14 15 16 P P P P N P P P STOE STOE STOE STOE STOE STOE STOE STOE 0.625 0.494 0.494 0.761 0.203 0.619 0.654 0.628 0.713 0.816 0.469 0.314 0.506 0.574 0.420 0.639 Note. Cut off for Factor Loading of >.45