Fil a t ov a, Ol g a A., D e e c k e , Volk e r B., Fo r d , Jo h n K.B., M a t ki n , C r ai g O., B a r r e t t-L e n n a r d , L a n c e G., G u z e ev, Mi k h ail A., B u r di n , Alex a n d r M . a n d H o y t, E ri c h ( 2 0 1 2 ) C all d iv e r si ty in t h e N o r t h P a cific kill e r w h al e p o p u l a tio n s: i m plic a tio n s fo r d i al e c t e v ol u tio n a n d p o p ul a tio n h i s t o ry. Ani m al B e h a vio ur, 8 3 ( 3). p p . 5 9 5-6 0 3 .
Do w n l o a d e d fr o m : h t t p ://i n si g h t . c u m b r i a . a c . u k /i d/ e p ri n t/ 1 9 7 8 /
U s a g e o f a n y i t e m s f r o m t h e U n i v e r s i t y o f C u m b r i a’ s i n s t i t u t i o n a l r e p o s i t o r y ‘I n s i g h t ’ m u s t c o n f o r m t o t h e f o l l o w i n g f a i r u s a g e g u i d e l i n e s .
Any it e m a n d it s a s s o ci a t e d m e t a d a t a h el d i n t h e U niv e r si ty of C u m b r i a ’s in s ti t u ti o n al r e p o si t o r y I n si g h t ( u nl e s s s t a t e d o t h e r wi s e o n t h e m e t a d a t a r e c o r d ) m a y b e c o pi e d , di s pl ay e d o r p e rf o r m e d , a n d s t o r e d i n li n e wi t h t h e JIS C f ai r d e a li n g g ui d eli n e s ( av ail a bl e h e r e) fo r e d u c a t i o n al a n d n o t-fo r-p r ofi t a c tiviti e s
p r o v i d e d t h a t
• t h e a u t h o r s , ti tl e a n d full bi blio g r a p h i c d e t ail s of t h e it e m a r e ci t e d cl e a rly w h e n a n y p a r t
of t h e w o r k is r ef e r r e d t o v e r b a lly o r i n t h e w ri t t e n fo r m
• a h y p e rli n k/ U RL t o t h e o ri gi n al I n si g h t r e c o r d of t h a t it e m is i n cl u d e d i n a n y ci t a ti o n s of t h e w o r k
• t h e c o n t e n t is n o t c h a n g e d i n a n y w a y
• all fil e s r e q ui r e d fo r u s a g e of t h e it e m a r e k e p t t o g e t h e r wi t h t h e m a i n it e m fil e.
Yo u m a y n o t
• s ell a n y p a r t of a n it e m
• r e f e r t o a n y p a r t of a n it e m wi t h o u t ci t a ti o n
• a m e n d a n y it e m o r c o n t e x t u ali s e it i n a w a y t h a t will i m p u g n t h e c r e a t o r ’s r e p u t a t i o n
• r e m ov e o r a l t e r t h e c o py ri g h t s t a t e m e n t o n a n it e m .
T h e full p oli cy c a n b e fo u n d h e r e.
Call diversity in the North Pacific killer whale populations: implications
1
for dialect evolution and population history
2
Olga A. Filatovaa,*, Volker B. Deeckeb,e, John K.B. Fordc, Craig O. Matkind, Lance G. 3
Barrett-Lennarde, Mikhail A. Guzeevf, Alexandr M. Burding, Erich Hoyth 4
aDepartment of Vertebrate Zoology, Faculty of Biology, Moscow State University, Russia 5
bSea Mammal Research Unit, Scottish Oceans Institute, University of St. Andrews, UK 6
cPacific Biological Station, Fisheries and Oceans Canada, Nanaimo, BC 7
dNorth Gulf Oceanic Society, Homer, Alaska, USA 8
eVancouver Aquarium Marine Science Centre, BC, Canada 9
fDepartment of Vertebrate Zoology, Faculty of Biology and Soil Sciences, St. Petersburg State 10
University, Russia
11
gKamchatka Branch of Pacific Institute of Geography FEB RAS, Petropavlovsk-Kamchatsky, Russia 12
hWhale and Dolphin Conservation Society, UK 13
14
*Corresponding author: Olga A. Filatova, Department of Vertebrate Zoology, Faculty of Biology,
15
Moscow State University, Vorobyovy gory 1/12, Moscow 119992, e-mail: [email protected], tel. +7 903
16 2366474. 17 18 Correspondence: 19
Volker B. Deecke: Sea Mammal Research Unit, Scottish Oceans Institute, University of St. Andrews, St.
20
Andrews, Fife, KY16 8LB, UK
21
John K.B. Ford: Pacific Biological Station, 3190 Hammond Bay Road, Fisheries and Oceans Canada,
22
Nanaimo, BC V9T 6N7
23
Craig O. Matkin: North Gulf Oceanic Society, 3430 Main St Suite B1, Homer, Alaska, AK99603, USA
24
Lance G. Barrett-Lennard: Vancouver Aquarium Marine Science Centre, P.O. Box 3232, Vancouver, BC,
25
Canada V6B 3X8
26
Mikhail A. Guzeev: Department of Vertebrate Zoology, Faculty of Biology and Soil Sciences,
27
Universitetskaya emb., 7/9, St. Petersburg State University, St. Petersburg 199034, Russia
28
Alexandr M. Burdin: Kamchatka Branch of Pacific Institute of Geography FEB RAS, Pr. Rybakov 19-a,
29
Petropavlovsk-Kamchatsky, 683024, Russia
30
Erich Hoyt: 29A Dirleton Avenue, North Berwick, Scotland EH39 4BE, UK
Although killer whale (Orcinus orca) dialects have been studied in detail in several 33
populations, little attempt has been made to compare dialect characteristics between populations. 34
In this study we investigated geographical variation in monophonic and biphonic calls among 35
four resident populations from the North Pacific Ocean: Southern and Northern Vancouver 36
Island residents, southern Alaska residents, and eastern Kamchatka residents. We tested 37
predictions about call variation across populations which are due to an accumulation of random 38
errors and innovations by vertical cultural transmission. Call frequency contours were extracted 39
and compared using a dynamic time-warping algorithm. We found that the diversity of 40
monophonic calls was substantially higher than the diversity of biphonic calls for all populations. 41
Repertoire diversity appeared to be related to the population size: in larger populations, 42
monophonic calls were more diverse and biphonic calls were less diverse. We suggest that the 43
evolution of both monophonic and biphonic calls is caused by an interaction between stochastic 44
processes and directional selection, but the relative effect of directional selection is greater for 45
biphonic calls. Our analysis revealed no direct correlation between call repertoire similarity and 46
geographical distance. Call diversity within pre-defined call categories – types and subtypes – 47
showed a high degree of correspondence between populations. Our results suggest that dialect 48
evolution is a complex process influenced by an interaction between directional selection, 49
horizontal transmission and founder effects. We suggest several scenarios for how this might 50
have arisen and the implications of these scenarios for call evolution and population history. 51
Keywords: dialect, killer whale, acoustic repertoire, evolution, call type. 52
Vocal variation among groups of animals may occur at different levels. Variations in 54
vocalisations between neighbouring groups of potentially interbreeding individuals are called 55
dialects, whereas differences in acoustic repertoires over long distances and between populations 56
that normally do not interbreed are referred to as geographic variation (Conner 1982). Dialects 57
are common in birds (Baker & Cunningham 1985), but rare in mammals, being mostly limited to 58
cetaceans (e.g., Ford 1991; Rendell & Whitehead 2003), bats (e.g., Boughman 1997; Esser & 59
Schubert 1998; Yoshino et al. 2008) and humans (Labov 2001). In contrast, geographic variation 60
in vocal repertoires is common among both bird and mammalian populations (e.g., Krebs & 61
Kroodsma 1980; Slobodchikoff et al. 1998; Mitani et al. 1999). 62
Killer whales are widely distributed throughout the world’s oceans (Forney & Wade 63
2007). Different populations display substantial variation in diet, behaviour, morphology and 64
genetics (Ford et al. 1998; Pitman & Ensor 2003; Foote et al. 2009; Morin et al. 2010). Rather 65
than being genetically coded, the vocal repertoire of killer whales is thought to be learned 66
(Bowles et. al. 1988; Ford 1991; Deecke 2000; Foote et al. 2006), which leads to formation of 67
dialects between neighbouring groups in some populations and geographic variation between 68
distant populations. 69
As a species, killer whales feed on a wide variety of prey, but different populations often 70
show a high degree of dietary specialization (Ford et al. 1998; Saulitis et al. 2000; Ford & Ellis 71
2006). In several regions, sympatric populations show little or no dietary overlap and represent 72
different ecotypes (Ford et al. 1998; Saulitis et al. 2000; Pitman & Ensor 2003). Three killer 73
whale ecotypes have been described from the North Pacific and these differ in social structure, 74
morphology, genetics and behaviour: residents specialize on fish and live in large stable social 75
units (Ford & Ellis 2006; Ivkovich et al. 2010), transients hunt primarily marine mammals and 76
live in smaller more fluid social groups (Baird & Dill 1996; Ford et al. 1998), and offshores are 77
probably fish specialists (Ford et al. 2011) and live in large groups with an unknown social 78
Dialects have been described for several resident killer whale populations from the North 80
Pacific (Ford 1991; Yurk et al. 2002; Filatova et al. 2007) and for killer whales from the 81
northeastern Atlantic (Strager 1995). Resident killer whales from the North Pacific have a 82
complex nested social structure comprised of 1) matrilines containing a matriarch and all her 83
descendants, which always travel together; 2) pods containing a set of matrilines that associate 84
frequently and use a common repertoire of stereotyped calls, which represents the vocal dialect 85
of the pod; 3) acoustically distinct clans comprised of pods which share some repertoire calls; 86
and 4) populations or communities containing one or more associating clans (Ford 1991; Ford 87
2002; Ivkovich et al. 2010). 88
Several distinct populations of resident killer whales have been identified in the North 89
Pacific: Southern and Northern Vancouver Island residents, southern Alaskan residents in the 90
northeastern Pacific (Ford 2002; Matkin et al. 1999), eastern Kamchatka residents in the 91
northwestern Pacific (Ivkovich et al. 2010) and a number of less studied putative populations 92
around the Aleutian and Kuril Islands and in the Bering and Okhotsk seas. Genetic and other 93
research on these populations (Barrett-Lennard 2000; Hoelzel et al. 2002) has not, to date, 94
provided detailed information about historical relationships among them. 95
It has been suggested that repertoires of stereotyped calls may serve as a marker of 96
maternal relatedness. Divergence between vocal repertoires of killer whale pods is thought to 97
happen gradually as pods grow bigger and matrilines spend less and less time together (Ford 98
1991). Vocal learning involves a series of call mistakes and innovations, which gradually make 99
vocal repertoires diverge. For these reasons, Ford (1991) suggested a direct relationship between 100
the maternal ancestry of different pods within clans and the degree of similarity of their vocal 101
repertoires: the more distant the common maternal ancestry between pods, the fewer calls shared 102
within their repertoires. This prediction was confirmed by Deecke et al. (2010), who showed that 103
the similarity of one call type across matrilines was correlated with matriarch relatedness in spite 104
These findings suggest that populations with more recent common maternal ancestry 106
must have more similar repertories as well. Although killer whale dialects have been described in 107
detail in several populations, few studies have examined vocal variation between killer whale 108
populations. Yurk (2005) compared distribution of call syllables among subpopulations and 109
showed that distinct lower frequency syllables were shared between clans but differed between 110
populations, whereas upper frequency syllables varied between clans of the same population. 111
Foote & Nystuen (2008) showed that the frequency parameters of calls varied across ecotypes 112
(resident, transient and offshore). In this paper, we investigate the variation of whole frequency 113
contours across the three North Pacific resident killer whale populations. 114
Comparing killer whale acoustic repertoires is complicated by the fact that killer whale 115
sounds are not structurally homogenous. Killer whale sounds comprise several distinct structural 116
categories, common to all killer whale populations studied to date. Killer whale sounds include 117
whistles, echolocation clicks and pulsed calls. Most pulsed calls are highly stereotyped and can 118
be easily divided into call types (Ford 1991) with varying degrees of variability within types. 119
Many call types have an overlapping, independently modulated high-frequency component (Fig. 120
1); this phenomenon is usually referred to as “biphonation” (Wilden et al. 1998; Fitch et al. 121
2002) or, when two independent sources are responsible, “two-voiced calling” (Zollinger et al. 122
2008). Since the mechanism responsible for this pattern in killer whales is unknown, we use the 123
former term in this paper. 124
Biphonic sounds have been described in mammals as diverse as canids (Wilden et al. 125
1998; Riede et al. 2000, Volodin & Volodina 2002), primates (Fisher et al. 2001, Brown et al. 126
2003; Riede et al. 2004) and cetaceans (Tyson et al. 2007). While the functional significance of 127
biphonation in calls is not readily understood, its presence in the vocalisations of different 128
species suggests a potentially important communicative role. Proposed functions include the 129
enhancement of individual recognition (Aubin et al. 2000; Fitch et al. 2002; Volodina et al. 130
suggested that differences in the directionality of the lower- and higher-frequency components in 132
biphonic calls can provide information on the orientation of a caller relative to a listener (Miller 133
2002). Differences in usage of biphonic and monophonic calls in diverse social contexts suggest 134
that they may have distinct functions in killer whale communication with biphonic calls 135
functioning mostly as group identifiers and monophonic calls serving as short-range contact 136
signals (Filatova et al. 2009). Moreover, biphonic and monophonic calls show substantial 137
differences in source levels (Miller 2006) and structure (Filatova et al. 2007), which suggests 138
that they should be considered two distinct structural categories. 139
In this study we examined geographical variation in monophonic and biphonic calls 140
among four resident populations from the North Pacific Ocean: Southern and Northern 141
Vancouver Island residents, southern Alaska residents, and eastern Kamchatka residents (Fig. 2). 142
We tested predictions about call variation across populations which are due to an accumulation 143
of random errors and innovations by vertical cultural transmission. First, we compared the 144
diversity of monophonic and biphonic calls within these populations. Second, we compared the 145
similarity of monophonic and biphonic calls between each pair of populations. Finally, we 146
measured call diversity within pre-defined call categories – types and subtypes, and examined 147
whether call diversity within these categories differed across populations. 148
Methods
149
The study populations
150
Southern Vancouver Island resident killer whales (referred to below as SR) inhabit the 151
coastal waters of British Columbia and Washington State. The core area of this population is in 152
the waters of southern Vancouver Island, but they sometimes range south to Monterey Bay, 153
California. The population consists of the single acoustic clan – J-clan (Ford 1991), which 154
comprised 86 individuals in 2003 (van Ginneken et al. 2005). 155
Northern Vancouver Island resident killer whales (referred to below as NR) inhabit the 156
north to southeastern Alaska (approximately 48°N to 58°N). The population is comprised of 158
three acoustic clans: A-clan, G-clan and R-clan (Ford 1991). 159
Southern Alaskan resident killer whales (referred to below as AR) range from 160
southeastern Alaska to Kodiak Island (Matkin et al. 1999) and possibly into the Aleutian Islands 161
and the Bering Sea (Allen & Angliss 2010). This population includes two acoustic clans: AB-162
clan and AD-clan (Yurk 2002). 163
Eastern Kamchatka resident killer whales (referred to below as KR) were encountered 164
along the eastern coast of Kamchatka peninsula from Avacha Gulf to Karaginsky Gulf and east 165
to the Commander Islands. This population comprises three acoustic clans: Avacha clan, K19 166
clan and K20 clan (Filatova 2007). 167
Some overlap exists in the ranges of the northeastern Pacific populations: SR overlap 168
with NR in the waters of Vancouver Island, and NR overlap with AR in southeastern Alaska 169
(Ford et al. 2000). Despite this overlap, none of the populations have been observed to mix (Ford 170
et al. 2000). 171
Data collection
172
Sound recordings used for this study were taken from the existing long-term databases. 173
Recordings of Southern residents were made from 1980-2009, Northern residents from 1988-174
1999, southern Alaskan residents from 1984-2008, and eastern Kamchatka residents from 2000-175
2009. All recording systems had a flat frequency response from at least 0.1 to 7 kHz, although in 176
most cases this extended up to 20 kHz. We only included recordings that had sufficient 177
frequency bandwidth and signal-to-noise ratio to clearly display all call features. 178
The recordings were made from small (4-9 m) boats. Photographs were taken during all 179
recording sessions and compared to identification catalogues to confirm pod and population 180
identity, as described in Bigg et al. (1990). 181
In the recording sessions made directly for this study, all approaches to the whales were 182
approached at slow speed at 45° to the whale’s course when they were traveling and left the 184
group immediately after the photographs of all group members were obtained. To make sound 185
recordings, we moved the boat 200-300 m ahead of the animals and waited until they passed us. 186
If the whales were feeding or milling, we stayed at a distance of 100-300 m from them to avoid 187
disturbing their natural behaviour. When the animals showed strong avoidance behaviour (e.g. 188
change in the direction of movement away from the boat), we stopped our activities and kept a 189
distance of at least 500 m from the group. 190
Acoustic and statistical analysis
191
We classified calls according to existing catalogues (Ford 1987; Yurk et al. 2002; 192
Filatova et al. 2004). For Alaska and Kamchatka, however, some call types were split and others 193
were added according to the results of more recent studies (see Filatova et al. 2007; Yurk et al. 194
2010). Two calls from each type/subtype were used for the analysis, with some exclusion of rare 195
call types for which we were not able to obtain at least two call samples of adequate quality. If a 196
call type had no subtypes, two samples from this call type were used. For call types that fell into 197
discrete subtypes, two samples from each subtype of this type were used. When possible, the 198
pairs of call samples from the same type/subtype were selected from different encounters and 199
different years to cover the presumed variation in the call structure. For calls which did not fall 200
into discrete subtypes but showed apparent group-specific variations (e.g., N12, see Ford 1991), 201
two calls from the opposite sides of the structural continuum were selected. In total, 348 samples 202
of 174 call types/subtypes were used for the analysis: 34 SR monophonic, 28 SR biphonic, 34 203
NR monophonic, 62 NR biphonic, 48 AR monophonic, 40 AR biphonic, 46 KR monophonic, 56 204
KR biphonic. Because our primary interest was call evolution, rare calls were of equal interest to 205
common calls, and we did not weight call similarities by the frequency with which each call 206
occurred. 207
Call contours were extracted using a custom-made MATLAB (The Mathworks, Inc., 208
(available online at www.russianorca.org/sound_pro.htm). After the operator selected enough 210
points to track all modulations of the contour from the fundamental frequency and harmonics, 211
the algorithm performed the generalization of frequency points by dividing them by the band 212
number and joined them into a set of frequency measurements of the fundamental frequency, 213
which were then smoothed and interpolated to produce a vector of frequency measurements with 214
the sampling interval 0.01 s (Fig. 3). For biphonic calls, contours were extracted both from the 215
low- and the high-frequency components. Calls were identified as biphonic if they contained the 216
overlapping high-frequency component (Fig. 1). 217
Similarity of calls was measured using dynamic time-warping. Dynamic time-warping is 218
an algorithm developed for the automated recognition of human speech that allows limited 219
compression and expansion of the time axis of a signal to maximise frequency overlap with a 220
reference signal (e.g., Itakura 1975). For this study, we used a modified version of the warping 221
algorithm of Deecke & Janik (2006). Percent similarity of contours was calculated by dividing 222
the smaller frequency value by the larger value at each point and multiplying by 100: 223
S(i) = min [M(i), N(i)] /max[M(i), N(i)]*100 224
where M is the reference contour and N the input contour. From the resulting similarity matrix, a 225
cost matrix was constructed that kept a running tab on the similarities of the elements making up 226
the curves while adding up these costs to give a final number called the “similarity” between the 227
contours. In our algorithm, each element of the cost matrix was obtained by comparing the 228
weighted sum of similarity values from two columns and two rows distant from the weighted 229
diagonal. 230
Because the algorithm of Deecke & Janik (2006) only allows expansion or compression 231
of the time axis by a factor of three, the algorithm cannot be used to compare calls that differ in 232
length by more than a factor of three. In this case, their similarity is considered zero percent. 233
This constraint biased the results in comparisons where many short or long contours were 234
additional algorithm that stretched the shorter contour through interpolation to make it one point 236
longer than 1/3 of the longer contour. 237
For each pair of contours within each sample set, we measured their relative similarity in 238
frequency using this dynamic time-warping algorithm. By generating all possible pairwise 239
comparisons between call samples from sample sets, we used N samples to generate 0.5*N*(N - 240
1) comparisons. Since the correlation structure of this data set was unknown, we assumed that all 241
data points generated with the same sample were correlated. To achieve independence between 242
the analysis units, we calculated the mean similarity for each call sample and used it as the unit 243
of analysis for the further comparison. 244
For the measurements of intra-population call similarity, we calculated the similarity
245
between each pair of calls from each major category (monophonic/biphonic) within each 246
population. 247
For the comparison of intra- and inter-population similarity of calls, we calculated the
248
inter-population similarity for each pair of populations as a set of similarity values between each 249
call from the first population and each call from the second population. The median inter-250
population similarity obtained by this method would depend not only on the true similarity 251
between populations, but also on the intra-population call similarity of each population. To get a 252
less biased inter-population similarity measure, we divided the median inter-population 253
similarity by the median of the pooled intra-population similarity values for each pair of 254
populations. 255
To measure call similarity within types and subtypes, we divided each of the six
intra-256
population sets of similarity values into the following three subsets: a) similarity values between 257
pairs of calls from the different types; b) similarity values between pairs of calls from the same 258
type; and c) similarity values between pairs of calls from the same subtype. To test for 259
sets from all three populations were used. To test the differences in the type/subtype threshold 261
across populations, subsets b) and c) were compared for the each pair of populations. 262
Statistical analysis was performed using R software (R Development Core Team 2010). 263
Distribution of similarity values in most cases differed significantly from normal, so we used the 264
non-parametric two-tailed Mann-Whitney U-test for all statistical comparisons. Bonferroni 265
correction was applied in cases of multiple pairwise comparisons. A Mantel matrix permutation 266
test (Schnell et al. 1985) was used to estimate the correlation of call similarity and geographical 267
distance between populations. Distances were approximate based on the core summer 268
distribution as the full extent of population ranges is unknown. In all statistical comparisons the 269
significance level was accepted to be 0.05. 270
Results
271
Intra-population call similarity of monophonic and biphonic calls
272
We compared levels of similarity among monophonic calls with the levels of similarity 273
among biphonic calls. Within each of the four populations, call similarity was significantly less 274
among monophonic calls than it was among the biphonic calls in each population (monophonic 275
vs biphonic, Mann-Whitney U-test, KR: U = 109, N1 = 46, N2 = 56, p < 0.0001; AR: U = 89, N1
276
= 48, N2 = 40, p < 0.0001; NR: U = 98, N1 = 34, N2 = 62, p < 0.0001) except SR in which the
277
difference was close to significant (U = 338, N1 = 34, N2 = 28, p = 0.051). Differences between
278
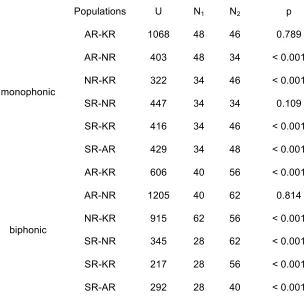
populations within these two categories were less pronounced (Fig. 4) though also significant in 279
all cases except AR vs KR and NR vs SR monophonic, AR vs NR biphonic (Table 2). 280
SR had the highest median similarity (that is, the lowest call diversity) for monophonic 281
calls followed by NR, AR and KR. KR had the highest median similarity for biphonic calls 282
followed by AR, NR and SR. Including the higher-frequency component into the analysis of 283
biphonic calls increased the call similarity within all populations (Table 1). In this case, KR 284
Intra- and inter-population similarity of calls
286
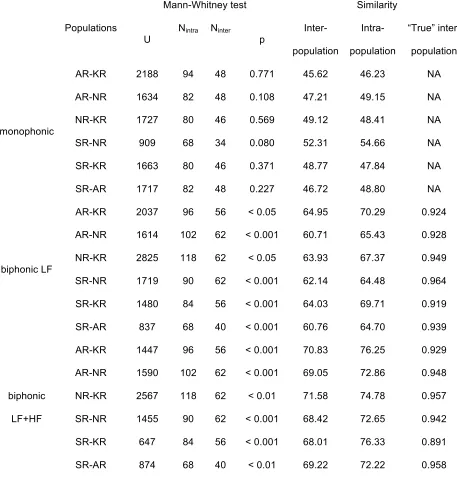
We compared intra- and inter-population similarity of monophonic and biphonic calls in 287
the each pair of populations (Table 3). Differences in intra- and inter-population similarity of 288
monophonic calls were non-significant for all comparisons. Intra-population similarity of 289
biphonic calls was significantly higher than inter-population similarity for all comparisons 290
(Table 3). 291
The fact that the inter-population similarity of monophonic calls did not differ 292
significantly from the intra-population similarity means that monophonic calls are equally 293
diverse within and between populations. For this reason we did not compare the inter-population 294
similarity of monophonic calls between pairs of populations. 295
Inter-population similarity of biphonic calls was the highest between AR and KR, 296
followed by KR-SR, NR-KR, NR-SR, SR-AR and NR-AR (Table 3). After dividing this value 297
by the intra-population similarity to obtain the “true” similarity measure, SR and NR were the 298
most similar, followed by NR-KR, SR-AR, AR-NR, AR-KR and SR-KR (Fig. 5A). 299
Inter-population similarity of biphonic calls compared by analyzing both the lower-300
frequency and the higher-frequency components was the highest between KR and NR, followed 301
by KR-AR, SR-AR, NR-AR, SR-NR and SR-KR (Table 3). After dividing this value by the 302
intra-population similarity, SR and AR were the most similar, followed by NR-KR, AR-NR, SR-303
NR, AR-KR and SR-KR (Fig. 5B). The correlation between approximate geographical distance 304
and call similarity measured by the lower-frequency component and by both the lower-frequency 305
and the higher-frequency components was non-significant (Fig.5). 306
Call similarity within types and subtypes
307
We measured the similarity between monophonic and biphonic calls from different types, 308
calls from the same type, and calls from the same subtype for each population (Table 4). 309
Similarities between calls from different types followed the pattern revealed by the comparison 310
lower than between biphonic calls (U = 826, N1 = 86, N2 = 71, p < 0.0001; Fig. 6). The
312
difference in similarity between monophonic and biphonic calls within types and subtypes was 313
non-significant. The differences in similarity of calls within types and subtypes across different 314
populations were non-significant. 315
316
Discussion
317
The comparison of monophonic and biphonic calls from the four North Pacific resident 318
killer whale populations revealed a pronounced difference in the degree of similarity between 319
monophonic and biphonic calls for each population. For all four populations, the diversity of 320
monophonic calls was higher than the diversity of biphonic calls. Differences between 321
populations in the diversity of call types from the corresponding category (monophonic or 322
biphonic) were less pronounced. This result suggests that monophonic and biphonic calls have 323
different principles of evolution that are shared among the different resident populations. This 324
supports the suggestion that monophonic and biphonic calls are discrete categories. 325
Our results are consistent with previous studies which found differences in source levels 326
(Miller 2006), directionality (Miller 2002) and usage (Filatova et al. 2009) between monophonic 327
and biphonic calls. Miller (2006) measured source levels of different killer whale sounds and 328
showed that monophonic calls exhibited mean source levels lower than biphonic calls. This 329
variation in intensity suggests that killer whale pulsed calls fall into two functional groups: 330
‘‘long range’’ biphonic calls with a mean estimated active space of 10–16 km in sea state zero 331
and ‘‘short-range’’ monophonic calls with an active space of 5–9 km (Miller 2006). Miller 332
(2002) showed that the relative energy in the high-frequency components of biphonic calls was 333
significantly greater when animals were moving toward the hydrophone array than away from it. 334
It is likely that this difference could help listening whales to determine the direction of 335
movement of a caller. Filatova et al. (2009) showed that the proportion of biphonic calls in the 336
in the area. The combination of these findings suggests that biphonic calls function mostly as 338
group identifiers and help whales to define group affiliation and monitor the position of group 339
members over long ranges. The function of monophonic calls is less clear, but, like killer whale 340
whistles (Thomsen et al. 2002), they may serve as short-range communication signals. 341
The similarity of diversity levels in monophonic and biphonic calls in four populations 342
raises the question of whether the repertoire structure in resident killer whales is genetically or 343
culturally inherited. It is now generally accepted that killer whales acquire the detailed structure 344
of stereotyped calls in their repertoire through vocal learning (Bowles et al. 1988; Ford 1991: 345
Deecke et al. 2000; Foote et al. 2006); however, other aspects of the vocal repertoire could be 346
innate. Many songbirds learn their songs from fathers or neighbouring males, but despite some 347
variation their song remains species-specific and retains a certain structure. Moreover, gradual 348
differences in the function, usage and raw structural difference of the songs versus calls appear 349
to be innate in songbirds (Marler 2004). The same is probably true for human languages: 350
although languages are learned and therefore extremely diverse, there is some inherited structure 351
common to all human languages (Pinker 1994; but see Evans & Levinson 2009). 352
The comparison of stereotyped call repertoires among populations produced rather 353
unexpected results. The classical theory of call change through random drift predicts that the 354
highest call similarity should occur in populations that are geographically close and therefore 355
may share the recent common ancestors. However, our analysis revealed no direct correlation 356
between call repertoire similarity and geographical distance (Fig. 5). There are several possible 357
explanations for this. First, it is possible that call evolution is too fast to be phylogenetically 358
meaningful on a population scale: call repertoires may be already so diverse that they retain no 359
signs of common ancestry, and all similarities could be the result of random convergence. It has 360
been suggested in resident killer whales that females choose mates with the most dissimilar 361
dialects (Barrett-Lennard 2000). This would drive sexual selection towards faster call evolution 362
and second degree cousins). The opposite selection force may be caused by the need of killer 364
whale groups to possess markers of population identity. Biphonic calls of all three clans of the 365
eastern Kamchatka resident population have certain frequency features in common (Filatova et 366
al. 2007). In southern Alaska resident killer whales, distinct lower frequency syllables are shared 367
by clans within this population (Yurk 2005). In Northern residents, most stereotyped whistle 368
types are structurally identical in two of the three acoustic clans (Riesch et al. 2006). Northern 369
and Southern resident populations in British Columbia share a substantial part of their 370
geographical range but retain strong behavioural reproductive isolation, although it is not 371
obvious if the isolation is based on acoustic or other cues. 372
The interaction of these opposite evolutionary forces (diversifying and standardizing) 373
may lead to the “maximum diversity within the permitted range”, where the “range” is 374
represented by vocal population markers. This scenario is consistent with the fact that in our 375
study the diversity of biphonic and monophonic calls between populations was very similar to 376
that within populations, suggesting that every population had already reached some optimal level 377
of diversity for each call category. Moreover, the intra- and inter-population diversity of 378
monophonic calls did not differ significantly, suggesting that for monophonic calls the pressure 379
to standardise is lower. 380
It is interesting to note that the diversity of monophonic and biphonic calls appears to be 381
negatively correlated. This pattern is also related to the population size: monophonic calls are 382
more diverse and biphonic calls are less diverse in larger populations. Although the SR 383
population of about 86 animals (van Ginneken et al. 2005) is the smallest of the four populations, 384
it has the highest diversity of biphonic calls and the lowest diversity of monophonic calls, 385
followed by the NR with 216 animals (Ford et al. 2000), KR (650 individuals; T.V. Ivkovich 386
unpublished data) and AR (more than 1000 individuals; Allen & Angliss 2010). In human 387
languages, speaker population size was shown to be a significant predictor of phonemic 388
(Atkinson 2011). Our results demonstrate that the diversity of monophonic calls follows the 390
same pattern as phonemic diversity in human languages, which suggests that their evolution is 391
driven by the same stochastic processes that also affect human phonemes (Labov 2001). By 392
contrast, diversity in biphonic calls shows the opposite pattern. This may be caused by the fact 393
that in larger populations the inbreeding risk is lower, and the need for unique vocal population 394
markers is higher, which shifts the balance of diversifying and standardizing forces in favour of 395
the latter. Therefore, we suggest that the evolution of both monophonic and biphonic calls is 396
caused by an interaction between stochastic processes and directional selection, but the relative 397
effect of directional selection is greater for biphonic calls. 398
An alternative hypothesis suggests that call similarity between populations does reflect 399
their ancestry, but the ancestry is not directly correlated with geographical distance. Killer 400
whales are highly mobile and phylogeographic structure could very easily be disturbed by long-401
distance movements. For example, genetic studies showed that the resident killer whales of the 402
North Pacific are more related to the North Atlantic killer whales than to sympatric transient 403
populations (Morin et al. 2010). This suggests a complex and multi-stage history of population 404
formation and colonisation of the North Pacific Ocean. Moreover, the southern Alaskan resident 405
population possesses two haplotypes of the control region of mitochondrial DNA; one matches 406
with the single haplotype of the Northern resident population, the other with the single haplotype 407
of the Southern resident population (Barrett-Lennard 2000) and the eastern Kamchatkan resident 408
population (Hoelzel et al. 2007). It is possible that the AR population retains genetic diversity of 409
an ancestral population, while the NR, SR and KR populations have reduced diversity due to a 410
founder effect. Founder effects have been shown to reduce the diversity of syllables in bird songs 411
(Baker & Jenkins 1987) and phonemic diversity in human languages (Atkinson 2011). This is in 412
agreement with the reduced diversity in KR biphonic and NR and SR monophonic calls, but it is 413
in contradiction to the high diversity in SR biphonic calls. However, the information currently 414
similarity is required to reveal the population history of North Pacific killer whales. A 416
comparison of repertoire similarity with mitochondrial haplotype similarity across populations 417
can provide an important insight into population history and dialect evolution. 418
Similarities of biphonic stereotyped call repertoires measured by the low-frequency 419
component and by both the low- and the high-frequency components were generally not 420
consistent, although they agreed in some aspects (Fig. 5 A, B). It appears that the evolution of 421
low-frequency and high-frequency components of biphonic calls is not always parallel, 422
suggesting that it may be influenced by different factors. The inclusion of the high-frequency 423
component in the analysis of the intra-population similarity always increased the similarity 424
values (Table 1), indicating that the high-frequency component is less diverse within populations 425
than the low-frequency component. It is possible that the high frequency component may be a 426
more stable and reliable marker of population relatedness, than the more diverse and variable 427
low-frequency component. Alternatively, the stability of the high-frequency component may be 428
related to the radiation pattern of biphonic calls. The higher-frequency component is more 429
directional than the lower-frequency component (Miller 2002), so it is clearly audible only when 430
the signaller is orientated towards the receiver. Therefore, the more omnidirectional lower-431
frequency component would appear to be more useful for the long-range recognition of pod 432
members. This may result in the higher contour variability in the lower-frequency component to 433
make the call more discernible. Consequently, the type-specific variation in the contour shape of 434
the higher-frequency component may be redundant because the call type is already identifiable 435
by the lower-frequency component. In that case, the function of the higher-frequency 436
component may be restricted to marking the orientation of a signaler while the lower-frequency 437
component marks the pod membership. 438
The diversity of calls within type and subtype categories had a high degree of 439
correspondence between populations, despite the fact that the initial categorisations were made 440
of some other odontocetes (e.g., Weilgart & Whitehead 1990), killer whale pulsed calls are 442
highly stereotyped showing little variation within call types, but there are consistent differences 443
between them. Differences within type/subtype diversity between populations were non-444
significant. Moreover, the difference in diversity between monophonic and biphonic calls was 445
non-significant within types and subtypes. This suggests that the observers had rather similar 446
ideas of what they meant by call type and subtype. No one has yet provided a satisfactory 447
definition of “call type” in killer whales, and the most common description of the categorisation 448
process refers to “the distinctive audible characteristics of the calls”. Call structure changes 449
subtly but continuously over time (Deecke et al. 2000), and call type divergence is thought to be 450
a gradual process (Bigg et al. 1990; Ford 1991). Consequently, calls of different matrilines can 451
differ to a greater or lesser extent, and it is not always obvious where to place the border. Deecke 452
and Janik (2006) performed an automatic neural network categorisation of calls recorded from 453
North Pacific transient killer whales and identified 8 monophonic and 5 biphonic call types. Our 454
study provides an equally objective approach to call categorisation by comparing contours and 455
using a threshold similarity level to delineate call types. 456
In conclusion, our results suggest that divergence of vocal repertoires may not result 457
solely from the accumulation of random errors and innovations by vertical cultural transmission. 458
Repertoire diversity appears to be related to the population size: monophonic calls are more 459
diverse and biphonic calls are less diverse in larger populations. Call similarity across 460
populations does not correspond with geographical distance. All this suggests that dialect 461
evolution is a complex process subject to an interaction between directional and non-directional 462
agents of structural change. These may include opposing selecting forces to diversify and 463
standardise vocal repertoires, horizontal transmission of calls, as well as random drift. 464
Acknowledgements
465
This research was supported by the Russian Fund for Fundamental Research (grant 11-466
04-00460-а), the Whale and Dolphin Conservation Society, Vancouver Aquarium and
Department of Fisheries and Oceans Canada. The North Gulf Oceanic Society provided support 468
for collection of recordings in Alaska.VBD was supported by a Marie-Curie Intra-European
469
Fellowship. We are grateful to Harald Yurk for providing the recordings of Alaskan killer whales 470
and supervision in their classification. We are grateful to Mayuko Otsuki for selecting the 471
samples of Southern resident calls. 472
473
References
474
Allen, B. M. & Angliss, R. P. 2010. Alaska Marine Mammal Stock Assessments, 2009. 475
NOAA Technical Memorandum NMFS-AFSC-206, Department of Commerce, NOAA/NMFS, 476
Seattle, 276 p. 477
Atkinson, Q. D. 2011. Phonemic diversity supports a serial founder effect model of 478
language expansion from Africa. Science, 332, 346-349.
479
Aubin, T., Jouventin, P., & Hildebrand, C. 2000. Penguins use the two-voice system to 480
recognize each other. Proceedings of the Royal Society B: Biological Sciences, 267, 1081–1087.
481
Baird, R. W. & Dill, L. M. 1996. Ecological and social determinants of group size in 482
transient killer whales. Behavioral Ecology, 7, 408-416. 483
Baker, A. J. & Jenkins, P. F. 1987. Founder effect and cultural evolution of songs in an 484
isolated population of chaffinches, Fringilla coelebs, in the Chatham Islands. Animal Behaviour, 485
35, 1793-1803.
486
Baker, M. C. & Cunningham, M. A. 1985. The biology of bird-song dialects. 487
Behavioral and Brain Sciences, 8, 85-100. 488
Barrett-Lennard, L. G. 2000. Population structure and mating patterns of killer whales, 489
Orcinus orca, as revealed by DNA analysis. Ph.D. thesis, University of British Columbia, 490
Bigg, M. A., Olesiuk, P. F., Ellis, G. M., Ford, J. K. B. & Balcomb, K. C. 1990. Social 492
organization and genealogy of resident killer whales (Orcinus orca) in the coastal waters of 493
British Columbia and Washington State. Report of the International Whaling Commission, 494
Special Issue 12, 383–405. 495
Boughman, J. W. 1997. Greater spear-nosed bats give group-distinctive calls. 496
Behavioral Ecology and Sociobiology, 40, 61-70. 497
Bowles, A. E., Young, W. G. & Asper, E. D. 1988. Ontogeny of stereotyped calling of a 498
killer whale calf, Orcinus orca, during her first year. Rit Fiskideildar, 11, 251-275. 499
Brown, C. H., Alipour, F., Berry, D. A. & Montequin, D. 2003. Laryngeal 500
biomechanics and vocal communication in the squirrel monkey (Saimiri boliviensis). Journal of 501
the Acoustical Society of America, 113, 2114-2126. 502
Conner, D. A. 1982. Dialects versus geographic variation in mammalian vocalisations. 503
Animal Behaviour, 30, 297-298. 504
Deecke, V. B., Ford, J. K. B. & Spong, P. 2000. Dialect change in resident killer whales 505
(Orcinus orca): implications for vocal learning and cultural transmission. Animal Behaviour, 60,
506
629-638. 507
Deecke, V. B. & Janik, V. M. 2006. Automated categorization of bioacoustic signals: 508
Avoiding perceptual pitfalls, Journal of the Acoustical Society of America, 119, 645–653.
509
Deecke, V. B., Barrett-Lennard, L. G., Spong, P. & Ford, J. K. B. 2010. The structure 510
of stereotyped calls reflects kinship and social affiliation in resident killer whales (Orcinus orca). 511
Naturwissenschaften, 97, 513–518. 512
Esser, K.-H. & Schubert, J. 1998. Vocal dialects in the lesser spear-nosed bat 513
Phyllostomus discolor. Naturwissenschaften, 85, 347-349. 514
Evans, N. & Levinson, S. C. 2009. The myth of language universals: Language diversity 515
and its importance for cognitive science. Behavioral and Brain Sciences, 32, 429-448.
Filatova, O. A., Burdin, A. M., Hoyt, E. & Sato, H. 2004. A catalogue of discrete calls 517
of resident killer whales (Orcinus orca) from the Avacha Gulf of Kamchatka Peninsula. 518
Zoologicheskyi Journal, 83, 1169-1180. (in Russian). 519
Filatova, O. A., Fedutin, I. D., Burdin, A. M. & Hoyt, E. 2007. The structure of the 520
discrete call repertoire of killer whales Orcinus orca from Southeast Kamchatka. Bioacoustics, 521
16, 261-280. 522
Filatova, O. A., Fedutin, I. D., Nagaylik, M. M., Burdin, A. M. & Hoyt, E. 2009. 523
Usage of monophonic and biphonic calls by free-ranging resident killer whales (Orcinus orca) in 524
Kamchatka, Russian Far East. Acta ethologica, 12, 37-44.
525
Fischer, J., Hammerschmidt, K., Cheney, D. L. & Seyfarth, R. M. 2001. Acoustic 526
features of female chacma baboon barks. Ethology, 107, 33-54.
527
Fitch, W. T., Neubauer, J. & Herzel, H. 2002. Calls out of chaos: The adaptive 528
significance of nonlinear phenomena in mammalian vocal production. Animal Behaviour, 63,
529
407-418. 530
Foote, A. D., Griffin, R. M., Howitt, D., Larsson, L., Miller, P. J. O. & Hoelzel, A. R.
531
2006. Killer whales are capable of vocal learning. Biology Letters, 2, 509–512.
532
Foote, A. D. & Nystuen, J. A. 2008. Variation in call pitch among killer whale ecotypes. 533
Journal of the Acoustical Society of America, 123, 1747-1752. 534
Foote, A. D., Newton, J., Piertney, S. B., Willerslev, E.& Gilbert, M. T. P. 2009. 535
Ecological, morphological and genetic divergence of sympatric North Atlantic killer whale 536
populations. Molecular Ecology, 18, 5207–5217.
537
Ford, J. K. B. 1987. A catalogue of underwater calls produced by killer whales (Orcinus 538
orca) in British Columbia. Canadian Department of Fisheries and Oceans, Nanaimo, 161 pp. 539
Ford, J. K. B. 1991. Vocal traditions among resident killer whales (Orcinus orca) in 540
coastal waters of British Columbia. Canadian Journal of Zoology, 69, 1454-1483.
Ford, J. K. B. 2002. Killer whales. In: The encyclopedia of marine mammals (Ed. by W. 542
F. Perrin, B. Würsig & J. G. M. Thewissen), pp. 669-676. New York: Academic Press. 543
Ford, J. K. B., Ellis, G. M., Barrett-Lennard, L. G., Morton, A. B., Palm, R. S. &
544
Balcomb, K. C. 1998. Dietary specialization in two sympatric populations of killer whales 545
(Orcinus orca) in coastal British Columbia and adjacent waters. Canadian Journal of Zoology, 546
76, 1456–1471.
547
Ford, J. K. B., Ellis, G. M. & Balcomb, K. C. 2000. Killer Whales. Vancouver, 548
Toronto, Canada: University of British Columbia Press. 549
Ford, J. K. B. & Ellis, G. M. 2006. Selective foraging by fish-eating killer whales 550
Orcinus orca in British Columbia. Marine Ecology Progress Series, 316, 185-199.
551
Ford, J. K. B., Ellis, G. M., Matkin, C. O., Wetklo, M.H., Barrett-Lennard L. G. &
552
Withler R. E. 2011. Shark predation and tooth wear in a population of northeastern Pacific killer 553
whales. (Orcinus orca). Aquatic Biology, 11, 213-224.
554
Forney, K. A. & Wade, P. 2007. Worldwide distribution and abundance of killer 555
whales. In: Whales, Whaling and Ecosystem (Ed. by J. Estes), pp. 145–162. Berkeley, CA: 556
University of California Press. 557
Hoelzel, A. R., Natoli, A., Dahlheim, M. E., Olavarria, C., Baird, R. W. & Black, N.
558
A. 2002. Low worldwide genetic diversity in the killer whale (Orcinus orca): Implications for
559
demographic history. Proceedings of the Royal Society B: Biological Sciences, 269, 1467–1473.
560
Hoelzel, A. R., Hey, J., Dahlheim, M. E., Nicholson, C., Burkanov, V. N., & Black, N.
561
A. 2007. Evolution of population structure in a highly social top predator, the killer whale. 562
Molecular Biology and Evolution, 24, 1407–1415.
563
Itakura, F. 1975. Minimum prediction residual principle applied to speech recognition. 564
IEEE Transactions on Acoustics, Speech, and Signal Processing, 23, 67-72.
Ivkovich, T. V., Filatova, O. A., Burdin, A. M., Sato, H. & Hoyt, E. 2010. The social 566
organization of resident-type killer whales (Orcinus orca) in Avacha Gulf, Northwest Pacific, as 567
revealed through association patterns and acoustic similarity. Mammalian Biology, 75, 198-210.
568
Krebs, J. R. & Kroodsma, D. E. 1980. Repertoires and geographical variation in bird 569
song. In: Advances in the study of behaviour, vol. 11 (Ed. by J. S. Rosenblatt, R. A. Hinde, C. 570
Beer & M. C. Busnel), pp. 134–177. New York: Academic Press. 571
Labov, W. 2001. Principles of Linguistic Change: Social Factors. Oxford: Blackwell. 572
Marler, P. 2004. Bird Calls: Their Potential for Behavioral Neurobiology. Annals of the 573
New York Academy of Sciences, 1016, 31–44.
574
Matkin, C. O., Ellis, G. M., Saulitis, E. L., Barrett-Lennard, L. G., & Matkin, D.
575
1999. Killer Whales of Southern Alaska. Homer, Alaska: North Gulf Oceanic Society. 576
Miller, P. J. O. 2002. Mixed-directionality of killer whale stereotyped calls: a direction 577
of movement cue? Behavioral Ecology and Sociobiology, 52, 262-270,
578
Miller, P. J. O. 2006. Diversity in sound pressure levels and estimated active space of 579
resident killer whale vocalizations. Journal of Comparative Physiology A, 192, 449-459.
580
Mitani, J. C., Hunley, K. L. & Murdoch, M. E. 1999. Geographic variation in the calls 581
of wild chimpanzees: a reassessment. American Journal of Primatology, 47, 133–151.
582
Morin, P. A., Archer, F. I., Foote, A. D., Vilstrup, J., Allen, E. E., Wade, P., Durban,
583
J., Parsons, K., Pitman, R., Li, L., Bouffard, P., Abel Nielsen, S. C., Rasmussen, M.,
584
Willerslev, E., Gilbert, M. T. P. & Harkins, T. 2010. Complete mitochondrial genome 585
phylogeographic analysis of killer whales (Orcinus orca) indicates multiple species. Genome 586
Research, 20, 908-916. 587
Pinker, S. 1994. The Language Instinct. Cambridge, MA: MIT Press. 588
Pitman, R. L. & Ensor, P. 2003. Three forms of killer whales (Orcinus orca) in 589
Antarctic waters. Journal of Cetacean Research and Management, 5, 131-139.
R Development Core Team. 2010. R: A language and environment for statistical 591
computing. Vienna, Austria: R Foundation for Statistical Computing. 592
Rendell, L. E. & Whitehead, H. 2003. Vocal clans in sperm whales (Physeter 593
macrocephalus). Proceedings of the Royal Society B: Biological Sciences, 270, 225-231. 594
Riede, T., Herzel, H., Mehwald, D., Seidner, W., Trumler, E., Tembrock, G. &
595
Böhme, G. 2000. Nonlinear phenomena and their anatomical basis in the natural howling of a 596
female dog-wolf breed. Journal of the Acoustical Society of America, 108, 1435-1442.
597
Riede, T., Owren, M. J. & Arcadi, A. C. 2004. Nonlinear acoustics in pant hoots of 598
common chimpanzees (Pan troglodytes): Frequency jumps, subharmonics, biphonation, and 599
deterministic chaos. American Journal of Primatology, 64, 277-291.
600
Riesch, R., Ford, J. K. B. & Thomsen, F. 2006. Stability and group specificity of 601
stereotyped whistles in resident killer whales, Orcinus orca, off British Columbia. Animal 602
Behaviour, 71, 79-91. 603
Saulitis, E. L., Matkin, C. O., Barrett-Lennard, L. G., Heise, K. A. & Ellis, G. M.
604
2000. Foraging strategies of sympatric killer whale (Orcinus orca) populations in Prince William 605
Sound. Marine Mammal Science, 16, 94-109.
606
Schnell, G. D., Watt, D. J. & Douglas, M. E. 1985. Statistical comparison of proximity 607
matrices: Applications to animal behaviour. Animal Behaviour, 33, 239-253.
608
Slobodchikoff, C. N., Ackers, S. H. & van Ert, M. 1998. Geographic variation in alarm 609
calls of Gunnison's prairie dogs. Journal of Mammalogy, 79, 1265-1272.
610
Strager, H. 1995. Pod specific call repertoires and compound calls of killer whales, 611
Orcinus orca Linnaeus, 1758, in waters of Northern Norway. Canadian Journal of Zoology, 73,
612
1037–1047. 613
Thomsen, F., Franck, D. & Ford, J. K. B. 2002. On the communicative significance of 614
whistles in wild killer whales (Orcinus orca). Naturwissenschaften, 89, 404–407.
Tyson, R. B., Nowacek, D. P. & Miller, P. J. O. 2007. Nonlinear phenomena in the 616
vocalizations of North Atlantic right whales (Eubalaena glacialis) and killer whales (Orcinus 617
orca). Journal of the Acoustical Society of America, 122, 1365-1373. 618
van Ginneken, A., Ellifrit, D. & Balcomb, K. C. 2005. Official orca survey: field guide 619
to orcas of the Pacific Northwest the Southern Resident Community 1973–2005. Friday Harbor, 620
WA: Center for Whale Research. 621
Volodin, I. A. & Volodina, E. V. 2002. Biphonation as a prominent feature of dhole 622
Cuon alpinus sound. Bioacoustics, 13, 105-120. 623
Volodina, E. V., Volodin, I. A., Isaeva, I. V. & Unck, C. 2006. Biphonation may 624
function to enhance individual recognition in the dhole, Cuon alpinus. Ethology, 112, 815-825.
625
Weilgart, L. S. & Whitehead, H. 1990. Vocalizations of the North Atlantic pilot whale 626
(Globicephala melas) as related to behavioral contexts. Behavioral Ecology and Sociobiology, 627
26, 399-402. 628
Wilden, I., Herzel, H., Peters, G. & Tembrock, G. 1998. Subharmonics, biphonation 629
and deterministic chaos in mammal vocalization. Bioacoustics, 9, 171-196.
630
Yoshino, H., Armstrong, K. N., Izawa, M., Yokoyama, J. & Kawata, M. 2008. 631
Genetic and acoustic population structuring in the Okinawa least horseshoe bat: are intercolony 632
acoustic differences maintained by vertical maternal transmission? Molecular Ecology, 17,
633
4978–4991. 634
Yurk, H. 2005. Vocal culture and social stability in resident killer whales (Orcinus orca). 635
Ph.D. thesis, University of British Columbia, Vancouver. 636
Yurk, H., Barrett-Lennard, L. G., Ford, J. K. B. & Matkin, C. O. 2002. Cultural 637
transmission within maternal lineages: vocal clans in resident killer whales in Southern Alaska. 638
Animal Behaviour, 63, 1103-1119.
Yurk, H., Filatova, O. A., Matkin, C. O., Barrett-Lennard, L. G. & Brittain, M.
640
2010. Sequential habitat use by two resident killer whale (Orcinus orca) clans in Resurrection 641
Bay, Alaska, as determined by remote acoustic monitoring. Aquatic Mammals, 36, 67-78.
642
Zollinger, S. A., Riede, T. & Suthers, R. A. 2008. Two-voice complexity from a single 643
side of the syrinx in northern mockingbird (Mimus polyglottos) vocalizations. The Journal of 644
Experimental Biology, 211, 1978–1991. 645
Table 1. Median time-warped frequency contour similarity (in %) between monophonic and 647
biphonic call types of different resident killer whale populations in the North Pacific, calculated 648
by the low-frequency component (LF) and by both low- and high-frequency components 649
(LF+HF). 650
651
Population Median similarity
monophonic
KR 45.75
AR 46.58
NR 54.47
SR 55.01
biphonic LF
KR 72.16
AR 66.38
NR 65.08
SR 60.55
biphonic
LF+HF
KR 77.73
AR 72.36
NR 72.87
SR 71.19
652
Table 2. Results of Mann-Whitney U-test comparison of intra-population call similarity of 654
monophonic and biphonic calls across different resident populations. 655
656
Populations U N1 N2 p
monophonic
AR-KR 1068 48 46 0.789
AR-NR 403 48 34 < 0.001
NR-KR 322 34 46 < 0.001
SR-NR 447 34 34 0.109
SR-KR 416 34 46 < 0.001
SR-AR 429 34 48 < 0.001
biphonic
AR-KR 606 40 56 < 0.001
AR-NR 1205 40 62 0.814
NR-KR 915 62 56 < 0.001
SR-NR 345 28 62 < 0.001
SR-KR 217 28 56 < 0.001
SR-AR 292 28 40 < 0.001
Table 3. Results of Mann-Whitney U-test comparison of intra- and inter-population similarity, 659
median time-warped frequency contour similarity (in %) and “true” median similarity between 660
repertoires of different resident killer whale populations in the North Pacific. 661
662
Populations
Mann-Whitney test Similarity
U
Nintra Ninter
p
Inter-
population
Intra-
population
“True” inter-
population
monophonic
AR-KR 2188 94 48 0.771 45.62 46.23 NA
AR-NR 1634 82 48 0.108 47.21 49.15 NA
NR-KR 1727 80 46 0.569 49.12 48.41 NA
SR-NR 909 68 34 0.080 52.31 54.66 NA
SR-KR 1663 80 46 0.371 48.77 47.84 NA
SR-AR 1717 82 48 0.227 46.72 48.80 NA
biphonic LF
AR-KR 2037 96 56 < 0.05 64.95 70.29 0.924
AR-NR 1614 102 62 < 0.001 60.71 65.43 0.928
NR-KR 2825 118 62 < 0.05 63.93 67.37 0.949
SR-NR 1719 90 62 < 0.001 62.14 64.48 0.964
SR-KR 1480 84 56 < 0.001 64.03 69.71 0.919
SR-AR 837 68 40 < 0.001 60.76 64.70 0.939
biphonic
LF+HF
AR-KR 1447 96 56 < 0.001 70.83 76.25 0.929
AR-NR 1590 102 62 < 0.001 69.05 72.86 0.948
NR-KR 2567 118 62 < 0.01 71.58 74.78 0.957
SR-NR 1455 90 62 < 0.001 68.42 72.65 0.942
SR-KR 647 84 56 < 0.001 68.01 76.33 0.891
SR-AR 874 68 40 < 0.01 69.22 72.22 0.958
Table 4. Median and mean (in parentheses) time-warped frequency contour similarity (in 665
%) between all calls within the vocal repertoire belonging to the different call types, between 666
calls belonging to the same call type and calls of the same subtype for different resident killer 667
whale populations in the North Pacific. For biphonic calls, similarity of the low-frequency 668
component and both components combined are given separately. 669 Population different types same types same subtypes monophonic KR 44.99 (45.87) 89.19 (84.03) 91.40 (89.95)
AR 45.53 (44.82) 90.44 (85.17) 91.83 (86.26) NR 51.40 (50.12) 85.34 (82.47) 90.79 (90.04) SR 53.51 (52.88) 91.56 (86.77) 92.84 (91.74) biphonic - LF KR 71.15 (68.34) 92.62 (91.26) 93.87 (92.04) AR 65.88 (63.61) 88.69 (84.4) 93.76 (92.17) NR 64.46 (64.97) 90.73 (89.1) 93.45 (91.45) SR 59.30 (57.16) 87.66 (76.44) 93.97 (91.26) biphonic – LF+HF KR 77.42 (75.05) 92.88 (91.43) 93.53 (92.51) AR 72.21 (70.97) 89.63 (89.66) 94.74 (93.97) NR 72.44 (71.74) 92.51 (90.69) 95.08 (92.58)
(69.25) (83.79) (93.35)
670
Figure captions 672
1. Spectrograms of monophonic (left) and biphonic (right) calls. Note the low-frequency
673
component (LFC) with multiple harmonics in both sounds and the high-frequency 674
component (HFC) which is not a multiple of the LFC in the biphonic call. 675
2. Map of the North Pacific Ocean showing the home ranges of the resident killer whale
676
populations investigated in this study. 677
3. Example of frequency contours extracted from the low-frequency component (LFC) and
678
the high-frequency component (HFC) of a K27 call from the eastern Kamchatka resident 679
population. 680
4. Intra-population time-warped frequency contour similarity between monophonic and
681
biphonic calls of four resident killer whale populations. Horizontal lines represent 682
medians, boxes interquartiles, and whiskers a 90% confidence interval. 683
5. “True” similarity (inter-population divided by intra-population time-warped frequency
684
contour similarity) of biphonic stereotyped call repertoires plotted by the approximate 685
geographical distance between four resident killer whale populations. (a) – similarity 686
measured by the low-frequency component; (b) - similarity measured by both the low- 687
and the high-frequency components. 688
6. Time-warped frequency contour similarity between monophonic and biphonic calls from
689
different types, from same types and from same subtypes. Horizontal lines represent 690
medians, boxes interquartiles, and whiskers a 90% confidence interval. 691
692
694
696
698
700
702