R E S E A R C H A R T I C L E
Open Access
Transcriptomic analyses reveal the
underlying pro-malignant functions of
PTHR1 for osteosarcoma via activation of
Wnt and angiogenesis pathways
Shenglong Li
1†, Yujin Dong
2†, Ke Wang
3†, Zhe Wang
4and Xiaojing Zhang
1*Abstract
Background:Increasing evidence has indicated parathyroid hormone type 1 receptor (PTHR1) plays important roles for the development and progression of osteosarcoma (OS). However, its function mechanisms remain unclear. The goal of this study was to further illuminate the roles of PTHR1 in OS using microarray data.
Methods:Microarray data were available from the Gene Expression Omnibus database under the accession number GSE46861, including six tumors from mice with PTHR1 knockdown (PTHR1.358) and six tumors from mice with control knockdown (Ren.1309). Differentially expressed genes (DEGs) between PTHR1.358 and Ren.1309 were identified using the LIMMA method, and then, protein–protein interaction (PPI) network was constructed using data from STRING database to screen crucial genes associated with PTHR1. KEGG pathway enrichment analysis was performed to investigate the underlying functions of DEGs using DAVID tool.
Results:A total of 1163 genes were identified as DEGs, including 617 downregulated (Lef1, lymphoid enhancer-binding factor 1) and 546 upregulated genes (Dkk1, Dickkopf-related protein 1). KEGG enrichment analysis indicated upregulated DEGs were involved in Renin-angiotensin system (e.g., Agt, angiotensinogen) and Wnt signaling pathway (e.g., Dkk1), while downregulated DEGs participated in Basal cell carcinoma (e.g., Lef1). A PPI network (534 nodes and 2830 edges) was constructed, in which Agt gene was demonstrated to be the hub gene and its interactive genes (e.g., CCR3, CC chemokine receptor 3; and CCL9, chemokine CC chemokine ligand 9) were inflammation related.
Conclusions:Our present study preliminarily reveals the pro-malignant effects of PTHR1 in OS cells may be mediated by activating Wnt, angiogenesis, and inflammation pathways via changing the expressions of the crucial enriched genes (Dkk1, Lef1, Agt-CCR3, and Agt-CCL9).
Keywords:Osteosarcoma, PTHR1, Wnt pathway, Angiogenesis, Inflammation
Background
Osteosarcoma (OS) is the most frequent primary malig-nant bone tumor developed in the metaphyses of long bones during childhood and adolescence, with an esti-mated incidence of approximately 3.5 per million [1, 2]. Despite intensive multiagent chemotherapy and surgical
resection have dramatically increased the 5-year survival rate to 70%, death still occurs in about 30% of patients with OS due to recurrence and metastasis (specially to the lung) [1, 2]. Thus, improving understanding of the mechanisms of OS progression and exploiting under-lying strategies for malignancy suppression has justifiably attracted a great deal of attention.
Recently, accumulating evidence has indicated para-thyroid hormone type 1 receptor (PTHR1), a G-protein-coupled receptor, may play important roles in the patho-genesis of OS. PTHR1 is found to be highly expressed in * Correspondence:[email protected]
†Equal contributors
1Department of Bone and Soft Tissue Tumor Surgery, Cancer Hospital of
China Medical University, Liaoning Cancer Hospital & Institute, 44, Xiaoheyan Road, Dadong District, Shenyang, Liaoning 110042, China
Full list of author information is available at the end of the article
OS cells and tissues (especially in metastatic or relapsed samples) [3–7]. Over-expression of PHTR1 promotes proliferation, motility, and invasion of OS cells, which can be reversed by shRNA-mediated gene silencing [3, 7, 8]. Further studies suggest PHTR1 may exert the tumor-promoting effects through being activated by its ligands, including parathyroid hormone (PTH) and parathyroid hormone-related peptide (PTHrP) [9, 10]. Upon activa-tion by PTH/PTHrP, PTHR1 induces the generaactiva-tion of cyclic AMP (cAMP) from ATP through adenylyl cyclase followed by the release of cAMP-dependent protein ki-nases [9–11]. Active protein kinases (PKA, PKC, or ERK) move to the nucleus and phosphorylates transcrip-tion factors, such as cAMP-response element-binding protein (CREB) and runt-related transcription factor 2 (Runx-2) which ultimately lead to the development of OS through regulating the expression their target genes (TGF-b1, transforming growth factor b1; CTGF, con-nective tissue growth factor; FGF-2, fibroblast growth factor; HAS2, HA-synthase-2 [3, 12, 13]). However, the functions of PTHR1 in OS remain not fully understood.
The goal of this study was to further illuminate the mechanisms of PTHR1 by analyzing the microarray data of OS [8]. Differentially expressed genes (DEGs) between OS tissues with and without PTHR1 knockdown were identified and then protein–protein interaction (PPI) network was constructed to screen crucial genes associ-ated with PTHR1, which was not performed in the study of Ho et al. [8]. Our studies may provide new insights into the mechanisms of PTHR1 in OS and reveal some potential targets for treatment of OS.
Methods
Microarray data
The microarray data of OS were extracted from the Gene Expression Omnibus (GEO) database (http:// www.ncbi.nlm.nih.gov/geo/) under the accession number GSE46861 [8], which contained six tumors with shRNA PTHR1 knockdown and six tumors with shRNA control knockdown. The tumor tissues were obtained from Balb/c nu/nu mice undergoing mouse OS80 cell line in-jection into the back flank and grown for 4 weeks. Mouse OS80 was transfected with either renilla lucifer-ase shRNA control (Ren.1309) or a shRNA specific for PTHR1 (PTHR1.358). Thus, PTHR1.358 and Ren.13096 cell samples were used to descript these two groups in the following analysis.
Data normalization and DEG identification
The raw data (CEL files) downloaded from the Affymetrix Mouse Gene 1.0 ST Array platform GPL6246 were preprocessed and normalized using the Robust Multichip Average (RMA) algorithm [14] as implemented in the Bioconductor R package (http://www.bioconductor.org/
packages/release/bioc/html/affy.html). The DEGs between PTHR1.358 and Ren.13096 cell samples were identified using the Linear Models for Microarray data (LIMMA) method [15] in the Bioconductor R package (http:// www.bioconductor.org/packages/release/bioc/html/limma. html). After thettest, thepvalue was corrected with the Benjamini-Hochberg (BH) algorithm [16]. Genes with an adjusted p < 0.05 and |logFC(fold change)| > 0.5 were considered differentially expressed.
PPI network construction
To screen crucial genes associated with PTHR1, the DEGs were imported into the PPI data that were col-lected from acknowledged STRING 10.0 (Search Tool for the Retrieval of Interacting Genes; http://string-db.org/) database [17]. The PPIs with combined scores > 0.7 were selected to construct the PPI network which was visualized using Cytoscape software 2.8 (www.cytos-cape.org/) [18]. Three topological properties, including degree [the number of interactions per node (protein)], betweenness (the number of shortest paths that pass through each node), and closeness centrality (the average length of the shortest paths to access all other proteins in the network) were calculated using the CytoNCA plu-gin in cytoscape software (http://apps.cytoscape.org/ apps/cytonca) [19] to rank the nodes in the PPI network. In addition, the Molecular Complex Detection (MCODE) plugin of Cytoscape software was also employed to identify functionally related and highly in-terconnected clusters from the PPI network with a de-gree cutoff of 2, node score cutoff of 0.2, k-core of 2, and maximum depth of 100 (http://baderlab.org/Soft-ware/MCODE) [20]. Significant modules were identified with MCODE score≥4 and nodes≥6.
Function enrichment analysis
Gene ontology (GO) and Kyoto encyclopedia of genes and genomes (KEGG) pathway enrichment analyses were performed to investigate the underlying functions of all DEGs and the DEGs in PPI network using The Database for Annotation, Visualization and Integrated Discovery (DAVID) 6.8 online tool (http://david.abcc.n-cifcrf.gov). A modified Fisher Exact p value < 0.05 was chosen as the cutoff point for GO and KEGG analyses.
Results
Identification of DEGs
significantly downregulated (logFC = −0.6919, adjusted
p value = 0.0002), indirectly demonstrating the knock-down model had been established successfully.
Function enrichment analysis
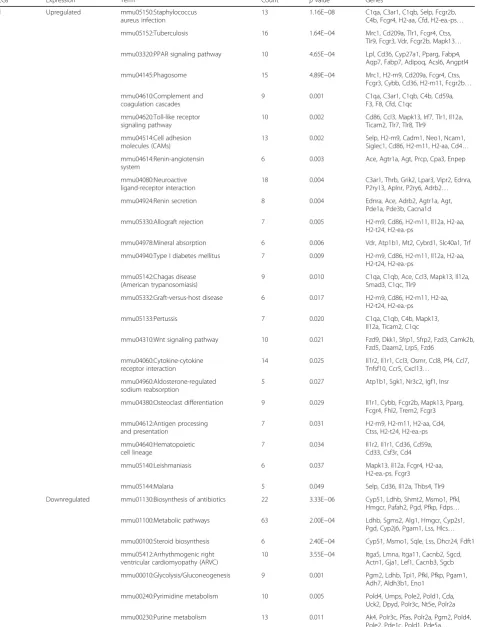
The above differential genes were subjected to the online tool DAVID for function enrichment analysis with the mouse genome as background andp< 0.05 as the cutoff point. As a result, 24 KEGG pathways were enriched for upregulated DEGs, including Renin-angiotensin system (e.g., Agt, angiotensinogen), Renin secretion (e.g., Agt), and Wnt signaling pathway (e.g., Dkk1), while 16 path-ways were for downregulated DEGs, including basal cell carcinoma (e.g., Lef1) (Table 2).
In addition, several GO terms, including 909 biological process (GO-BP), 63 cellular component (GO-CC), and 109 molecular function (GO-MF) categories were also enriched for upregulated DEGs, while 578 GO-BP, 42 GO-CC, and 48 GO-MF categories were for downregu-lated DEGs. To simplify the results, only the GO terms containing PTHR1 gene was displayed in this study (Fig. 1) because no KEGG pathway was obtained for PTHR1 gene. As expected, PTHR1 was found to be in-volved in cell proliferation process.
PPI network construction
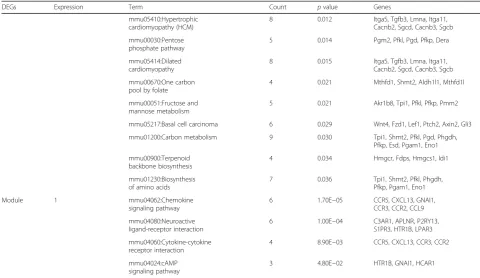
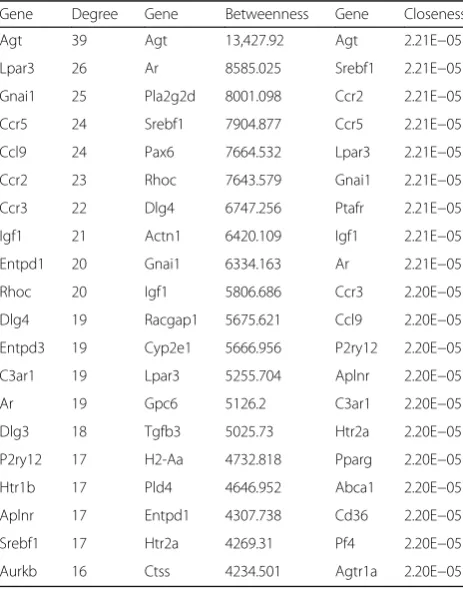
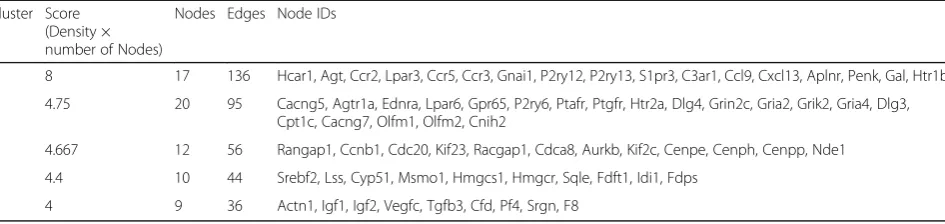
A PPI network, including 534 nodes and 2830 edges (interaction relationships), was constructed after map-ping the DEGs into the PPI data (Fig. 2; Additional file 1). By calculating the degree, betweenness, and close-ness centrality, Agt gene was found to be the most key hub gene (Table 3). More interestingly, Agt was shown to interact with PTHR1 in PPI network, further indicat-ing PTHR1 may promote the development of OS by in-fluencing the expression of this gene. The importance of this gene was also confirmed in the module analysis (Fig. 3). Five modules were screened according to the given parameters (Table 4), among which module 1 (in-cluding Agt) was considered as the most significant with MCODE score = 8 and nodes = 17. Function enrichment analysis of module 1 (Table 2) showed chemokine- and cytokine-related inflammation pathways may be crucial, in which all enriched genes (CCR5, CXCL13, GNAI1, CCR3, CCR2, CCL9) could interact with Agt gene (Fig. 3; Additional file 1), indirectly illustrating the important role of Agt in OS.
Discussion
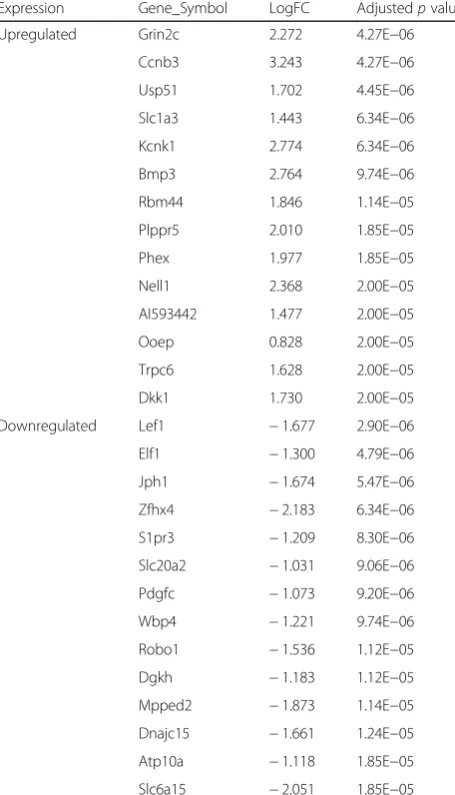
Using the microarray data of OS provided by Ho et al. [8], we found PTHR1 knockdown could induce the up-regulation of Dkk1, but the downup-regulation of Lef1. Dkk1 is thought to act as a soluble inhibitor for Wnt sig-naling [21], while transcription factor Lef1 mediates Wnt signaling pathway by binding with its co-activator β-catenin [22]. Several studies have demonstrated that activation of Wnt signaling promotes OS cell prolifera-tion and invasion [23], but contrast results can be ob-tained after its inhibition [24, 25]. Accordingly, we believe Wnt pathway genes (Dkk1 and Lef1) may be an important downstream targets for PTHR1 to participate in the proliferation and invasion of OS, which was also identified in the study of Ho et al. [8]. Although accu-mulating evidence has confirmed the high expression of Lef1 regulates cell proliferation, migration, invasion, and cancer stem-like cell self-renewal, leading to poor prog-nosis of patients [26, 27], their roles in OS remain rarely reported, and thus, this gene may be a new target for further exploration. The role of Dkk1 in OS remains still Table 1Top 15 upregulated and downregulated genes
differentially expressed between Pth1r knockout osteosarcoma cells and control
Expression Gene_Symbol LogFC Adjustedpvalue
Upregulated Grin2c 2.272 4.27E−06
Ccnb3 3.243 4.27E−06
Usp51 1.702 4.45E−06
Slc1a3 1.443 6.34E−06
Kcnk1 2.774 6.34E−06
Bmp3 2.764 9.74E−06
Rbm44 1.846 1.14E−05
Plppr5 2.010 1.85E−05
Phex 1.977 1.85E−05
Nell1 2.368 2.00E−05
AI593442 1.477 2.00E−05
Ooep 0.828 2.00E−05
Trpc6 1.628 2.00E−05
Dkk1 1.730 2.00E−05
Downregulated Lef1 −1.677 2.90E−06
Elf1 −1.300 4.79E−06
Jph1 −1.674 5.47E−06
Zfhx4 −2.183 6.34E−06
S1pr3 −1.209 8.30E−06
Slc20a2 −1.031 9.06E−06
Pdgfc −1.073 9.20E−06
Wbp4 −1.221 9.74E−06
Robo1 −1.536 1.12E−05
Dgkh −1.183 1.12E−05
Mpped2 −1.873 1.14E−05
Dnajc15 −1.661 1.24E−05
Atp10a −1.118 1.85E−05
Slc6a15 −2.051 1.85E−05
Table 2KEGG pathway enrichment of all DEGs and modules
DEGs Expression Term Count pvalue Genes
All Upregulated mmu05150:Staphylococcus aureus infection
13 1.16E−08 C1qa, C3ar1, C1qb, Selp, Fcgr2b, C4b, Fcgr4, H2-aa, Cfd, H2-ea.-ps…
mmu05152:Tuberculosis 16 1.64E−04 Mrc1, Cd209a, Tlr1, Fcgr4, Ctss, Tlr9, Fcgr3, Vdr, Fcgr2b, Mapk13…
mmu03320:PPAR signaling pathway 10 4.65E−04 Lpl, Cd36, Cyp27a1, Pparg, Fabp4, Aqp7, Fabp7, Adipoq, Acsl6, Angptl4
mmu04145:Phagosome 15 4.89E−04 Mrc1, H2-m9, Cd209a, Fcgr4, Ctss, Fcgr3, Cybb, Cd36, H2-m11, Fcgr2b…
mmu04610:Complement and coagulation cascades
9 0.001 C1qa, C3ar1, C1qb, C4b, Cd59a, F3, F8, Cfd, C1qc
mmu04620:Toll-like receptor signaling pathway
10 0.002 Cd86, Ccl3, Mapk13, Irf7, Tlr1, Il12a, Ticam2, Tlr7, Tlr8, Tlr9
mmu04514:Cell adhesion molecules (CAMs)
13 0.002 Selp, H2-m9, Cadm1, Neo1, Ncam1, Siglec1, Cd86, H2-m11, H2-aa, Cd4…
mmu04614:Renin-angiotensin system
6 0.003 Ace, Agtr1a, Agt, Prcp, Cpa3, Enpep
mmu04080:Neuroactive ligand-receptor interaction
18 0.004 C3ar1, Thrb, Grik2, Lpar3, Vipr2, Ednra, P2ry13, Aplnr, P2ry6, Adrb2…
mmu04924:Renin secretion 8 0.004 Ednra, Ace, Adrb2, Agtr1a, Agt, Pde1a, Pde3b, Cacna1d
mmu05330:Allograft rejection 7 0.005 H2-m9, Cd86, H2-m11, Il12a, H2-aa, H2-t24, H2-ea.-ps
mmu04978:Mineral absorption 6 0.006 Vdr, Atp1b1, Mt2, Cybrd1, Slc40a1, Trf
mmu04940:Type I diabetes mellitus 7 0.009 H2-m9, Cd86, H2-m11, Il12a, H2-aa, H2-t24, H2-ea.-ps
mmu05142:Chagas disease (American trypanosomiasis)
9 0.010 C1qa, C1qb, Ace, Ccl3, Mapk13, Il12a, Smad3, C1qc, Tlr9
mmu05332:Graft-versus-host disease 6 0.017 H2-m9, Cd86, H2-m11, H2-aa, H2-t24, H2-ea.-ps
mmu05133:Pertussis 7 0.020 C1qa, C1qb, C4b, Mapk13,
Il12a, Ticam2, C1qc
mmu04310:Wnt signaling pathway 10 0.021 Fzd9, Dkk1, Sfrp1, Sfrp2, Fzd3, Camk2b, Fzd5, Daam2, Lrp5, Fzd6
mmu04060:Cytokine-cytokine receptor interaction
14 0.025 Il1r2, Il1r1, Ccl3, Osmr, Ccl8, Pf4, Ccl7, Tnfsf10, Ccr5, Cxcl13…
mmu04960:Aldosterone-regulated sodium reabsorption
5 0.027 Atp1b1, Sgk1, Nr3c2, Igf1, Insr
mmu04380:Osteoclast differentiation 9 0.029 Il1r1, Cybb, Fcgr2b, Mapk13, Pparg, Fcgr4, Fhl2, Trem2, Fcgr3
mmu04612:Antigen processing and presentation
7 0.031 H2-m9, H2-m11, H2-aa, Cd4, Ctss, H2-t24, H2-ea.-ps
mmu04640:Hematopoietic cell lineage
7 0.034 Il1r2, Il1r1, Cd36, Cd59a, Cd33, Csf3r, Cd4
mmu05140:Leishmaniasis 6 0.037 Mapk13, Il12a, Fcgr4, H2-aa, H2-ea.-ps, Fcgr3
mmu05144:Malaria 5 0.049 Selp, Cd36, Il12a, Thbs4, Tlr9
Downregulated mmu01130:Biosynthesis of antibiotics 22 3.33E−06 Cyp51, Ldhb, Shmt2, Msmo1, Pfkl, Hmgcr, Pafah2, Pgd, Pfkp, Fdps…
mmu01100:Metabolic pathways 63 2.00E−04 Ldhb, Sgms2, Alg1, Hmgcr, Cyp2s1, Pgd, Cyp2j6, Pgam1, Lss, Hlcs…
mmu00100:Steroid biosynthesis 6 2.40E−04 Cyp51, Msmo1, Sqle, Lss, Dhcr24, Fdft1
mmu05412:Arrhythmogenic right ventricular cardiomyopathy (ARVC)
10 3.55E−04 Itga5, Lmna, Itga11, Cacnb2, Sgcd, Actn1, Gja1, Lef1, Cacnb3, Sgcb
mmu00010:Glycolysis/Gluconeogenesis 9 0.001 Pgm2, Ldhb, Tpi1, Pfkl, Pfkp, Pgam1, Adh7, Aldh3b1, Eno1
mmu00240:Pyrimidine metabolism 10 0.005 Pold4, Umps, Pole2, Pold1, Cda, Uck2, Dpyd, Polr3c, Nt5e, Polr2a
controversial. In contrast to the theoretical expectation [28, 29], as well as our result (lower expression in OS), some scholars recently have identified the elevated ex-pression of Dkk1 in OS tissues and cells [30, 31] and blockage of Dkk1 via a monoclonal antibody inhibits OS metastasis [32]. This indicates DKK1 represents a class of Janus-faced molecules with dichotomous roles in OS. We hypothesize the underlying mechanisms may be re-lated with the status of p53 in OS. It has been reported that Dkk-1 can be induced by wild-type p53, but not by mutant p53 (R249S) [33]. Thus, the downregulation of p53 in OS with wild-type p53 may lead to the lower ex-pression of Dkk-1, while Dkk-1 may be increased in a p53-independent manner for OS initiation and mainten-ance when p53 mutant occurs, which is similar to the
regulatory mechanism between p53 and p21 in cancer [34]. Also, a recent study indicates exogenous introduc-tion of p53 and Dkk1 could obviously inhibit the growth of OS cells, cause the cell cycle arrest at G0/G1 phase and apoptosis of OS cells compared with Dkk1 and p53 alone [35], further predicting a synergic relation between p53 and Dkk1. Zhang et al. further found the anti-proliferative effects of ursolic acid in OS cells may be mediated by upregulating p53 and then inhibit Wnt/β -catenin signaling [25]. In addition, p53 loss is observed to activate PTHrP-cAMP-CREB1 signaling [11] which is the downstream molecule of PTHR1 and thus may downregulate Dkk1 for OS as our study reported. How-ever, further studies are also needed to confirm this mechanism of p53-PTHR1-Dkk1 in OS.
Table 2KEGG pathway enrichment of all DEGs and modules(Continued)
DEGs Expression Term Count pvalue Genes
mmu05410:Hypertrophic cardiomyopathy (HCM)
8 0.012 Itga5, Tgfb3, Lmna, Itga11, Cacnb2, Sgcd, Cacnb3, Sgcb
mmu00030:Pentose phosphate pathway
5 0.014 Pgm2, Pfkl, Pgd, Pfkp, Dera
mmu05414:Dilated cardiomyopathy
8 0.015 Itga5, Tgfb3, Lmna, Itga11, Cacnb2, Sgcd, Cacnb3, Sgcb
mmu00670:One carbon pool by folate
4 0.021 Mthfd1, Shmt2, Aldh1l1, Mthfd1l
mmu00051:Fructose and mannose metabolism
5 0.021 Akr1b8, Tpi1, Pfkl, Pfkp, Pmm2
mmu05217:Basal cell carcinoma 6 0.029 Wnt4, Fzd1, Lef1, Ptch2, Axin2, Gli3
mmu01200:Carbon metabolism 9 0.030 Tpi1, Shmt2, Pfkl, Pgd, Phgdh, Pfkp, Esd, Pgam1, Eno1
mmu00900:Terpenoid backbone biosynthesis
4 0.034 Hmgcr, Fdps, Hmgcs1, Idi1
mmu01230:Biosynthesis of amino acids
7 0.036 Tpi1, Shmt2, Pfkl, Phgdh, Pfkp, Pgam1, Eno1
Module 1 mmu04062:Chemokine
signaling pathway
6 1.70E−05 CCR5, CXCL13, GNAI1, CCR3, CCR2, CCL9
mmu04080:Neuroactive ligand-receptor interaction
6 1.00E−04 C3AR1, APLNR, P2RY13, S1PR3, HTR1B, LPAR3
mmu04060:Cytokine-cytokine receptor interaction
4 8.90E−03 CCR5, CXCL13, CCR3, CCR2
mmu04024:cAMP signaling pathway
3 4.80E−02 HTR1B, GNAI1, HCAR1
DEGsdifferentially expressed genes
Furthermore, Agt was also shown to be upregulated after PTHR1 silencing. More interestingly, it could interact with PTHR1 in PPI network, indicating the change in its expres-sion may be a crucial mechanism for explaining the roles of PTHR1 in OS, which was first identified in our study. Func-tion enrichment analysis proved Agt may be involved in Renin-angiotensin system. As is well known, angiogenesis is an indispensable process for tumor growth and meta-static dissemination via providing essential oxygen and nu-trients to proliferating cells and then a route for metastasis delivery [36]. Thus, targeted inhibition of angiogenesis may be potential approaches for prevention of OS progression. AGT, encoded by Agt gene, is a 452-amino-acid-residue protein that can be cleaved by renin to generate angiotensin I (AngI) which has been demonstrated to exert antiangio-genic properties in vitro and in vivo [37], suggesting the underlying anti-tumor activity of AGT. This conclusion has been further verified by recent studies. For example, Bou-quet et al. showed adenovirus-mediated Agt overexpression inhibited tumor growth in preestablished human MDA-MB-231 mammary carcinomas in nude mice compared to controls and blocked tumorigenicity and pulmonary metas-tases of MDA-MB-231 and murine melanoma B16F10 cells when they were injected into C57BL/6 mice [38]. Vincent et al. revealed mice with bitransgenic HCC (hepatocellular carcinoma)/Hu-AGT-TG exhibited a significantly longer survival time than the HCC-TG mice and a decrease in both tumor growth and blood flow velocities of the liver through reducing of endothelial arterial markers (active Notch4, Delta-like 4 ligand and ephrin B2) [39]. However, the mechanism of Agt gene in OS remains unclear. In this Fig. 2The protein–protein interaction network. The red and green
nodes represent the upregulated and downregulated genes, respectively
Table 3Hub genes in the protein–protein interaction network
Gene Degree Gene Betweenness Gene Closeness
Agt 39 Agt 13,427.92 Agt 2.21E−05
Lpar3 26 Ar 8585.025 Srebf1 2.21E−05
Gnai1 25 Pla2g2d 8001.098 Ccr2 2.21E−05
Ccr5 24 Srebf1 7904.877 Ccr5 2.21E−05
Ccl9 24 Pax6 7664.532 Lpar3 2.21E−05
Ccr2 23 Rhoc 7643.579 Gnai1 2.21E−05
Ccr3 22 Dlg4 6747.256 Ptafr 2.21E−05
Igf1 21 Actn1 6420.109 Igf1 2.21E−05
Entpd1 20 Gnai1 6334.163 Ar 2.21E−05
Rhoc 20 Igf1 5806.686 Ccr3 2.20E−05
Dlg4 19 Racgap1 5675.621 Ccl9 2.20E−05
Entpd3 19 Cyp2e1 5666.956 P2ry12 2.20E−05
C3ar1 19 Lpar3 5255.704 Aplnr 2.20E−05
Ar 19 Gpc6 5126.2 C3ar1 2.20E−05
Dlg3 18 Tgfb3 5025.73 Htr2a 2.20E−05
P2ry12 17 H2-Aa 4732.818 Pparg 2.20E−05
Htr1b 17 Pld4 4646.952 Abca1 2.20E−05
Aplnr 17 Entpd1 4307.738 Cd36 2.20E−05
Srebf1 17 Htr2a 4269.31 Pf4 2.20E−05
Aurkb 16 Ctss 4234.501 Agtr1a 2.20E−05
Degreethe number of interactions per node (protein),betweennessthe number of shortest paths that pass through each node,closeness centralitythe average length of the shortest paths to access all other proteins in
the network
study, we also predicted Agt might exert anti-malignancy effects by interacting with inflammation-related genes (such as CCR3, CC chemokine receptor 3; and CCL9, chemokine CC chemokine ligand 9). The relationship between inflam-mation genes and cancer development has been extensively studied. For example, it has been reported that CCR3 is highly expressed in breast cancer samples, especially luminal-like subtype [40]. Knockdown of CCR3 inhibited cellular proliferation, invasion, and migration, which was ERK signaling pathway-dependent [41, 42]. CCL9 was also shown to be highly induced in Gr-1 + CD11b + immature myeloid cells and premetastatic lung of tumor-bearing mice. Knockdown of CCL9 in myeloid cells reduced tumor cell proliferation and metastasis [43].
Conclusion
Our present study preliminarily reveals PTHR1 may play important roles in the development and progression of OS by activating Wnt (Dkk1 and Lef1), angiogenesis, and in-flammation pathways (Agt-CCR3 and Agt-CCL9). Lef1, Agt, CCR3, and CCL9 are all underlying new targets be-cause no studies focused on them in OS. Thus, further in vitro and in vivo experimental studies were necessary to confirm the above findings. In addition, the role of Dkk1 is controversial and whether its expression is dependent on p53 status in OS also needs further investigation.
Additional file
Additional file 1:PPI network construction. (TSV 148kb)
Abbreviations
Agt:Angiotensinogen; AngI: Angiotensin I; BH: Benjamini-Hochberg; BP: Biological processes; CC: Cellular component; CCL9: Chemokine CC chemokine ligand 9; CCR3: CC chemokine receptor 3; CREB: cAMP-response element binding protein; CTGF: Connective tissue growth factor;
DAVID: Database for Annotation, Visualization and Integrated Discovery; DEGs: Differentially expressed genes; Dkk1: Dickkopf-related protein 1; FGF-2: Fibroblast growth factor 2; GO: Gene Ontology; HASFGF-2: HA-synthase-2; HCC: Hepatocellular carcinoma; KEGG: Kyoto encyclopedia of genes and genomes; Lef1: Lymphoid enhancer-binding factor 1; LIMMA: Linear Models for Microarray data; MCODE: Molecular Complex Detection; MF: Molecular function; OS: Osteosarcoma; PPI: Protein-protein interaction; PTH: Parathyroid hormone; PTHR1: Parathyroid hormone type 1 receptor; PTHrP: Parathyroid hormone-related peptide; RMA: Robust Multichip Average; Runx-2:
Runt-related transcription factor 2; STRING: Search Tool for the Retrieval of Interacting Genes; TGF-b1: Transforming growth factor b1
Acknowledgements
We thank the generous support by the Liaoning Cancer Hospital & Institute (Shenyang) and Dalian Municipal Central Hospital Affiliated of Dalian Medical University (Dalian).
We thank Guanying Liu for her numerous constructive comments in the process of writing this manuscript.
Funding
None.
Availability of data and materials
The microarray data GSE46861 were downloaded from the GEO database in NCBI (http://www.ncbi.nlm.nih.gov/geo/).
Authors’contributions
SLL and XJZ participated in the design of this study. SLL and ZW collected important background information and data. SLL and KW performed the statistical and bioinformatics analyses. SLL and YJD drafted the manuscript. All authors read and approved the final manuscript.
Ethics approval
This article does not contain any studies with human participants or animals performed by any of the authors.
As the data used in this study was downloaded from GEO database and no human experiment was involved in this study, there was no informed consent.
Consent for publication
Not applicable.
Competing interests
The authors declare that they have no competing interest.
Publisher’s Note
Springer Nature remains neutral with regard to jurisdictional claims in published maps and institutional affiliations.
Author details
1
Department of Bone and Soft Tissue Tumor Surgery, Cancer Hospital of China Medical University, Liaoning Cancer Hospital & Institute, 44, Xiaoheyan Road, Dadong District, Shenyang, Liaoning 110042, China.2Department of Hand and Foot Surgery, Dalian Municipal Central Hospital Affiliated of Dalian Medical University, Dalian, Liaoning 116033, China.3Molecular Pathology Testing Center, Foshan Chancheng Central Hospital, Foshan, Guangdong 528031, China.4Department of Orthopedics, Zhongshan Hospital Affiliated to Fudan University, Shanghai 200032, China.
Table 4Module analysis
Cluster Score (Density × number of Nodes)
Nodes Edges Node IDs
1 8 17 136 Hcar1, Agt, Ccr2, Lpar3, Ccr5, Ccr3, Gnai1, P2ry12, P2ry13, S1pr3, C3ar1, Ccl9, Cxcl13, Aplnr, Penk, Gal, Htr1b
2 4.75 20 95 Cacng5, Agtr1a, Ednra, Lpar6, Gpr65, P2ry6, Ptafr, Ptgfr, Htr2a, Dlg4, Grin2c, Gria2, Grik2, Gria4, Dlg3, Cpt1c, Cacng7, Olfm1, Olfm2, Cnih2
3 4.667 12 56 Rangap1, Ccnb1, Cdc20, Kif23, Racgap1, Cdca8, Aurkb, Kif2c, Cenpe, Cenph, Cenpp, Nde1
4 4.4 10 44 Srebf2, Lss, Cyp51, Msmo1, Hmgcs1, Hmgcr, Sqle, Fdft1, Idi1, Fdps
Received: 3 June 2017 Accepted: 23 October 2017
References
1. Berner K, Johannesen TB, Berner A, Haugland HK, Bjerkehagen B, Bøhler PJ, et al. Time-trends on incidence and survival in a nationwide and unselected cohort of patients with skeletal osteosarcoma. Acta Oncol. 2015;54:25–33. 2. Moreno F, Cacciavillano W, Cipolla M, Coirini M, Streitenberger P, López MJ,
et al. Childhood osteosarcoma: incidence and survival in Argentina. Report from the National Pediatric Cancer Registry, ROHA Network 2000–2013. Pediatr Blood Cancer. 2017;64:e26533.
3. Yang R, Hoang BH, Kubo T, Kawano H, Chou A, Sowers R, et al. Over-expression of parathyroid hormone type 1 receptor confers an aggressive phenotype in osteosarcoma. Int J Cancer. 2007;121:943–54.
4. Alokail MS, Peddie MJ. Quantitative comparison of PTH1R in breast cancer MCF7 and osteosarcoma SaOS-2 cell lines. Cell Biochem Funct. 2008;26:522–33. 5. Avnet S, Longhi A, Salerno M, Halleen JM, Perut F, Granchi D, et al.
Increased osteoclast activity is associated with aggressiveness of osteosarcoma. Int J Oncol. 2008;33:1231–8.
6. Lupp A, Klenk C, Röcken C, Evert M, Mawrin C, Schulz S. Immunohistochemical identification of the PTHR1 parathyroid hormone receptor in normal and neoplastic human tissues. Eur J Endocrino. 2010;162:979–86.
7. Ho PW, Russell M, Goradia A, Chalk A, Slavin J, Dickins R, et al. Abstract A54: PTHR1 signaling regulates the invasion and differentiation stage of osteosarcoma. Cancer Res. 2014;74:A54.
8. Ho PW, Goradia A, Russell MR, Chalk AM, Milley KM, Baker EK, et al. Knockdown of PTHR1 in osteosarcoma cells decreases invasion and growth and increases tumor differentiation in vivo. Oncogene. 2014;34:2922–33. 9. Walkley CR, Walia MK, Ho PW, Martin TJ. PTHrP, its receptor, and protein
kinase A activation in osteosarcoma. Mol Cell Oncol. 2014;1:e965624. 10. Nikitovic D, Kavasi RM, Berdiaki A, Papachristou DJ, Tsiaoussis J, Spandidos
DA, et al. Parathyroid hormone/parathyroid hormone-related peptide regulate osteosarcoma cell functions: focus on the extracellular matrix (review). Oncol Rep. 2016;36:1787–92.
11. Walia MK, Ho PM, Taylor S, Ng AJ, Gupte A, Chalk AM, et al. Activation of PTHrP-cAMP-CREB1 signaling following p53 loss is essential for osteosarcoma initiation and maintenance. elife. 2016;5.
12. Datsis GA, Berdiaki A, Nikitovic D, Mytilineou M, Katonis P, Karamanos NK, et al. Parathyroid hormone affects the fibroblast growth factor-proteoglycan signaling axis to regulate osteosarcoma cell migration. FEBS J. 2011;278:3782–92. 13. Berdiaki A, Datsis GA, Nikitovic D, Tsatsakis A, Katonis P, Karamanos NK, et al.
Parathyroid hormone (PTH) peptides through the regulation of hyaluronan metabolism affect osteosarcoma cell migration. IUBMB Life. 2010;62:377–86. 14. Irizarry RA, Hobbs B, Collin F, Beazer-Barclay YD, Antonellis KJ, Scherf U, et al.
Exploration, normalization, and summaries of high density oligonucleotide array probe level data. Biostatistics. 2003;4:249–64.
15. Ritchie ME, Phipson B, Wu D, Hu Y, Law CW, Shi W, et al. LIMMA powers differential expression analyses for RNA-sequencing and microarray studies. Nucleic Acids Res. 2015;43:e47.
16. Kim KI, van de Wiel MA. Effects of dependence in high-dimensional multiple testing problems. BMC Bioinformatics. 2008;9:114.
17. Szklarczyk D, Franceschini A, Wyder S, Forslund K, Heller D, Huerta-Cepas J, et al. STRING v10: protein-protein interaction networks, integrated over the tree of life. Nucleic Acids Res. 2015;43:D447–52.
18. Kohl M, Wiese S, Warscheid B. Cytoscape: software for visualization and analysis of biological networks. Methods Mol Biol. 2011;696:291–303. 19. Tang Y, Li M, Wang J, Pan Y, Wu FX. CytoNCA: a cytoscape plugin for
centrality analysis and evaluation of protein interaction networks. Biosystems. 2015;127:67–72.
20. Bader GD, Hogue CW. An automated method for finding molecular complexes in large protein interaction networks. BMC Bioinformatics. 2003;4:2.
21. Khalili S, Rasaee MJ, Bamdad T. 3D structure of DKK1 indicates its involvement in both canonical and non-canonical Wnt pathways. Mol Biol. 2017;51:180–92.
22. Zhou AD, Diao LT, Xu H, Xiao ZD, Li JH, Zhou H, et al.β-catenin/LEF1 transactivates the microRNA-371-373 cluster that modulates the Wnt/β -catenin-signaling pathway. Oncogene. 2012;31:2968–78.
23. Xiao Q, Yang Y, Zhang X, An Q. Enhanced Wnt signaling by methylation-mediated loss of SFRP2 promotes osteosarcoma cell invasion. Tumour Biol. 2016;37:6315–21.
24. Liu X, Li L, Lv L, Chen D, Shen L, Xie Z. Apigenin inhibits the proliferation and invasion of osteosarcoma cells by suppressing the Wnt/β-catenin signaling pathway. Oncol Rep. 2015;34:1035–41.
25. Zhang RX, Li Y, Tian DD, Liu Y, Nian W, Zou X, et al. Ursolic acid inhibits proliferation and induces apoptosis by inactivating Wnt/β-catenin signaling in human osteosarcoma cells. Int J Oncol. 2016;49:1973–82.
26. Wang WJ, Yao Y, Jiang LL, Hu TH, Ma JQ, Ruan ZP, Tian T, Guo H, Wang SH, Nan KJ. Increased LEF1 expression and decreased Notch2 expression are strong predictors of poor outcomes in colorectal cancer patients. Dis Markers. 2013;35:395–405.
27. Gao X, Mi Y, Ma Y, Jin W. LEF1 regulates glioblastoma cell proliferation, migration, invasion, and cancer stem-like cell self-renewal. Tumour Biol. 2014;35:11505–11.
28. Yong WC, Kim TH, Jeong SH, Han JH, Park JS. Strong immunoexpression of Dickkopf-1 is associated with response to bortezomib in multiple myeloma. Blood. 2016;128:3270.
29. Liu Y, Liu YZ, Zhang RX, Wang X, Meng ZJ, Huang J, et al. Oridonin inhibits the proliferation of human osteosarcoma cells by suppressing Wnt/β -catenin signaling. Int J Oncol. 2014;45:795–803.
30. Lee N, Smolarz AJ, Olson S, David O, Reiser J, Kutner R, et al. A potential role for Dkk-1 in the pathogenesis of osteosarcoma predicts novel diagnostic and treatment strategies. Br J Cancer. 2007;97:1552–9.
31. Chen C, Zhou H, Zhang X, Ma X, Liu Z, Liu X. Elevated levels of Dickkopf-1 are associated withβ-catenin accumulation and poor prognosis in patients with chondrosarcoma. PLoS One. 2014;9:e105414.
32. Goldstein SD, Matteo T, Bautista GW, Masanori H, Loeb DM. A monoclonal antibody against the Wnt signaling inhibitor dickkopf-1 inhibits osteosarcoma metastasis in a preclinical model. Oncotarget. 2016;7:21114–23.
33. Wang J, Shou J, Chen X. Dickkopf-1, an inhibitor of the Wnt signaling pathway, is induced by p53. Oncogene. 2000;19:1843–8.
34. Galanos P, Vougas K, Walter D, Polyzos A, Mayamendoza A, Haagensen EJ, et al. Chronic p53-independent p21 expression causes genomic instability by deregulating replication licensing. Nat Cell Biol. 2016;18:777–89. 35. Gao F, Bi B, Liao G. Regulation of exogenous P53 combined with Dickkopf-1
on human osteosarcoma MG-63 cells. Int J Clin Exp Med. 2017;10:9252–8. 36. Wegmanostrosky T, Sotoreyes E, Vidalmillán S, Sánchezcorona J. The
renin-angiotensin system meets the hallmarks of cancer. J Renin-Angiotensin-Aldosterone Syst. 2015;16:227–33.
37. Célérier J, Cruz A, Lamandé N, Gasc JM, Corvol P. Angiotensinogen and its cleaved derivatives inhibit angiogenesis. Hypertension. 2002;39:224–8. 38. Bouquet C, Lamandé N, Brand M, Gasc JM, Jullienne B, Faure G, et al.
Suppression of angiogenesis, tumor growth, and metastasis by adenovirus-mediated gene transfer of human angiotensinogen. Mol Ther. 2006;14:175–82. 39. Vincent F, Bonnin P, Clemessy M, Contrerès JO, Lamandé N, Gasc JM, et al.
Angiotensinogen delays angiogenesis and tumor growth of hepatocarcinoma in transgenic mice. Cancer Res. 2009;69:2853–60. 40. Gong DH, Fan L, Chen HY, Ding KF, Yu KD. Intratumoral expression of CCR3
in breast cancer is associated with improved relapse-free survival in luminal-like disease. Oncotarget. 2016;7:28570–8.
41. Lee YS, Kim SY, Song SJ, Hong HK, Lee Y, Oh BY, et al. Crosstalk between CCL7 and CCR3 promotes metastasis of colon cancer cells via ERK-JNK signaling pathways. Oncotarget. 2016;7:36842–53.
42. Zhu F, Liu P, Li J, Zhang Y. Eotaxin-1 promotes prostate cancer cell invasion via activation of the CCR3-ERK pathway and upregulation of MMP-3 expression. Oncol Rep. 2014;31:2049–54.