O R I G I N A L A R T I C L E
Open Access
Bridge jobs in Europe
Giorgio Brunello
1*and Monica Langella
2* Correspondence: giorgio.brunello@unipd.it
1Department of Economics,
University of Padova, Padova, Italy Full list of author information is available at the end of the article
Abstract
We study the transitions from career to gradual and permanent retirement by a sample of (Continental) European males aged 55 to 70 in the late 2000s. We find that only 14.6% of the workers in this sample moved from a career to a bridge job by the time of the interview, much less than in the United States, where this share is estimated at close to 60%. We use the cross country and time variation in
employment protection legislation and minimum retirement age to study whether recent changes in these labour market institutions have had any effect on the transitions out of career jobs. We find that policies that have increased minimum retirement age and reduced the strictness of employment protection legislation have raised the hazard into gradual retirement in Northern and Central European
countries and the permanence in career jobs in Mediterranean countries. JEL codes:J26, J11, J21
Keywords:Retirement; Europe; Bridge jobs; Pension reforms
Introduction
The traditional view on the transition from work to retirement of older men has been that continuous work is followed by abrupt permanent retirement. The empirical evi-dence, however, suggests that this transition is often more gradual, and involves either a reduction of working hours in the same job (phased retirement) or the transition from a“career job”to one or more transitional jobs, or“bridge jobs”(partial retirement), as a preliminary step to ultimate withdrawal from the labour force.
Gradual retirement has both advantages and disadvantages. On the one hand, less demanding jobs can increase the job satisfaction and utility of older workers at the end of their employment trajectories, and induce people with valuable skills and experience to work longer, thereby reducing alternative transitions to retirement such as disability and unemployment. By virtue of this, labour supply increases, and the sustainability of pension systems improves. On the other hand, the availability of part-time or less de-manding jobs for older workers may be hampered by the presence of fixed employer costs and by other restrictions, including the production technology, the difficulty of job scheduling in the case of part-time jobs and labour market institutions that dis-courage labour turnover.
By and large, the existing evidence on gradual retirement patterns is based on US data and research. Less has been done to understand whether similar patterns apply to European labour markets (one notable exception being Kantarci and Van Soest, 2008). This paper contributes to the empirical literature in two directions. First, we use
© Brunello and Langella; licensee Springer. This is an Open Access article distributed under the terms of the Creative Commons Attribution License (http://creativecommons.org/licenses/by/2.0), which permits unrestricted use, distribution, and reproduction in any medium, provided the original work is properly cited.
European data from the Survey on Health, Ageing and Retirement in Europe (SHARE) to present new evidence on gradual retirement patterns and the diffusion of bridge jobs in Continental Europe. Second, we investigate whether the probability of transiting from a career to a bridge job in Europe has been affected by the changes in minimum retirement age and in the strictness of employment protection legislation that have oc-curred in several European countries during the 1990s and the 2000s.
These institutional changes have the potential of influencing the labour market tran-sitions of older workers. On the one hand, less restrictive employment protection can affect the hazard into bridge jobs and retirement because it increases the availability of short-term contracts with shorter working hours, and reduces at the same time the costs of terminating permanent (career) jobs. On the other hand, higher minimum re-tirement age which delays rere-tirement can induce individuals who wish to consume ad-ditional leisure and cannot permanently retire to switch from more demanding career jobs to bridge jobs. Furthermore, when the increase in minimum retirement age is unexpected, job losers may be forced to find a short term job instead than early retirement1.
We use the retrospective information provided by the third wave of SHARE – the Survey on Health, Age and Retirement in Europe - to reconstruct the labour market transitions from age 50 onwards by males aged 55 to 70, who held a career job (defined as a full-time job lasting more than 10 years) at age 50. We find that 8.86% of the indi-viduals in our sample have transited from a career to a bridge job and eventually to re-tirement, 0.71% have retained their career job but switched from full to part-time, 51.53% have transited directly from a career job to permanent retirement and the remaining 38.90% are still in their career job. We also highlight that the traditional patterns of retirement –from a career job to permanent withdrawal from the labour force–is much more frequent in Mediterranean Europe (Italy, France and Spain) than in Northern and Central Europe (Germany, Austria, Switzerland, Netherlands, Belgium, Denmark and Sweden).
These results suggest that partial retirement is less common in Continental Europe than in the US or Japan, where it involves the majority of older male workers2, and that phased retirement involving a switch from full to part-time work is very rare with the same employer3. Since bridge jobs are more likely be part-time than career jobs, we conclude that older European workers willing to switch from full to part-time work typically have to change employer4.
Europe, and by longer permanence in full time career jobs in Mediterranean Europe. We speculate that this difference is due both to the fewer opportunities to work part-time and to the lower average human capital of older workers in the latter group of countries.
The paper is organized as follows. We start by reviewing the relevant literature (Section“Introduction”). Section“Previous literature”introduces the data, the key defi-nitions and the descriptive evidence on bridge jobs in Continental Europe based on SHARE. Finally, Section“Bridge jobs in Europe”presents our estimates of the effects of changes in minimum retirement age and employment protection on the hazards from career jobs to gradual and permanent retirement. Conclusions follow.
Previous literature
The decreasing trend in the average retirement age observed during the last decades and the contextual increase in life expectancy in almost all industrialised countries (Gruber and Wise, 1997) have motivated the economic analysis of individual behaviour during the last years of a labour market history. The traditional view of retirement is that employed individuals move directly from their career employment to complete re-tirement (Kantarci and Van Soest, 2008). Yet this needs not be a direct transition, but could involve less traditional pathways, such as the reduction of working hours in the same job or moving to a different and often less demanding job before retirement.
In the US, these less traditional patterns are by no means an exception. Gustman and Steinmeier, 1984, use the Retirement History Study (RHS) to estimate that at least one third of white employees in the US move from employment to partial retirement. Honig and Hanoch, 1985, confirm the importance of gradual retirement among older American workers. Using the US Social Security Administration Retirement History Longitudinal Survey, Ruhm, 1990, shows that the vast majority of US workers leaving their career job before age 55 remains in the labour force for at least one additional decade. He defines the jobs held after a career job and before retirement as bridge jobs, or jobs that act as bridges from career work to full time retirement. While career and bridge jobs are typically in a different industry or occupation, older workers engaged in bridge jobs show a high degree of job stability.
Blau, 1994, looks at the dynamics of labour force participation for older men in the US and models their transitions using a discrete time hazard model. He confirms that labour market transitions after age 50 are more frequent than usually thought and finds that they are affected by social security benefits. Quinn, 1996, reports that individual characteristics such as age, health and marital status affects the choice of the exit path from the labour force. Cahill, Giandrea, and Quinn, 2005, 2006, show that a key factor affecting the pattern of labour market withdrawal is the type of job done. For instance, the self-employed are more likely to leave their career job for a bridge job. Peracchi and Welch, 1994, document the presence of substantial gender differences in the prob-ability of doing a bridge job. They also suggest that those engaged in these jobs belong to two broad groups, those who look for a more satisfying career and those forced to work by their financial hardships.
part-time work using the European Community Household Panel. These data, how-ever, do not allow them to measure the frequency of bridge jobs using definitions similar to those applied in the US. Therefore, their comparative perspective is rather limited.
Bridge jobs in Europe
Following Ruhm, 1990, and Cahill et al., 2006, we define a career job as a full-time job that started before age 50 and lasted at least 10 years, and a bridge job as a job that started around age 50 after a career job and lasted less than 10 years5. When job spells are completed, their duration is obvious. When they are on-going or interrupted, we can only measure their duration until the time of the survey. Partly following Quinn, 1996, we estimate the completed duration of interrupted spells as the maximum be-tween twice the interrupted duration and the duration until modal retirement age6. To illustrate with an example, assume that an individual aged 60 is observed on an on-going job after his career job, and that the observed duration of this job is three years. Assume also that modal retirement age in his country and for his cohort of birth is 62. We estimate the completed length of the current job spell as the minimum bet-ween 6 – twice the interrupted length – and 5, the completed length by the time of modal retirement.
Using the convention that jobs that have lasted less than 10 years are short-term jobs, bridge jobs are short-term jobs and career jobs are long-term jobs. Clearly, not all short-term jobs held from age 50 to 70 originate from a career job. Some of these jobs have started from another short-term job when the individual moves across a sequence on non-career jobs, or from unemployment and out of the labour force. To identify whether a short-term job is a bridge job, additional information is required on the du-ration of the previous job. This information is available on a European scale in the third wave of the survey SHARE.
The survey SHARE is a multidisciplinary and cross-national European dataset which contains current and retrospective information on labour market activity, retirement, health and socioeconomic status for more than 25,000 individuals aged 50 or older. The design of the survey and its questionnaires are similar to those employed by the Health and Retirement Study (HRS) in the US and the English Longitudinal Survey of Adults (ELSA). A distinctive advantage of these data is that they cover a significant number of countries in Continental Europe. We use the third wave of the survey, which includes detailed data on the entire working life of interviewed individuals. This is valu-able but comes at the price that it is based on retrospective information. However, as discussed in detail by Brunello, Weber and Weiss (2012), existing validation studies find that recall bias is not so severe, arguably because of the state-of-the-art elicitation methods used: respondents are helped to locate events along the time line, starting from domains that are more easily remembered, and then asked progressively more de-tails about them.
Belgium) and has the following characteristics: almost 85% were holding a career job at age 50 –a full-time job which started before age 50, was not finished before that age, and had a completed duration of at least 10 years7–close to 7% had instead a short-term job or were in an unemployment spell leading to a short-short-term job, defined as a job with a completed duration shorter than 10 years, close to 2% were in a part - time job longer than 10 years, and the remaining 6% were either retired or in an unemploy-ment spell leading to retireunemploy-ment8.
Table 1 shows that 8.86% of the workers who were in a career job at age 50 have ex-perienced at least one bridge job in the following years, 0.71% have moved from a full-time to a part-full-time job with the same employer, 51.3% have exited directly into per-manent retirement, and the remaining 38.90% were still in the career job at the time of the interview. The percentage of male individuals experiencing one or more bridge jobs is 6.45% in Mediterranean Europe (France, Italy and Spain) and 10.52% in the rest of the sample, which includes Central and Northern European countries. We find that transitions from full to part-time work with the same employer are relatively more fre-quent in the latter group of countries, and that direct transitions from a career job to retirement are much more frequent in Mediterranean Europe (58.32% versus 48.20% in Northern and Central Europe). When we break down the 55 to 70 age group into two sub-groups (55 to 64 and 65 to 70), we find that the percentage of individuals who have experienced at least one bridge job is higher in the younger age group (9.40% versus 7.97%).
It is useful to compare these results with similar analysis for the United States. Quinn et al., 2006, use data from the Health and Retirement Study (HRS) and a definition of bridge jobs very similar to ours. They show that close to 60% of the American males aged 51 to 61 in 1992 who exited a career job moved to a bridge job9. In sharp con-trast, the corresponding percentage for male Europeans in our sample aged 55 to 64 in 2008/9 is 14.6% (8.86/(8.86 + 51.53) in Table 1), and as low as 9.9% in Mediterranean Europe. While these percentages may be affected by cohort and macroeconomic
Table 1 Transitions from a career job
Still in a full time career job
Moved to a part time CJ
Moved to a bridge job
Moved directly into retirement
Age group 55-70
Full Sample 38.90 0.71 8.86 51.53
Northern Europe 40.78 0.99 10.04 48.20
Mediterranean Europe 35.09 0.14 6.45 58.32
Age group 55-64
Full Sample 57.05 0.88 9.40 32.67
Northern Europe 60.30 1.22 10.52 27.96
Mediterranean Europe 50.65 0.22 7.19 41.94
Age group 65-70
Full Sample 9.06 0.42 7.97 82.55
Northern Europe 9.63 0.62 9.28 80.48
Mediterranean Europe 7.82 - 5.15 87.02
Males only. Age groups: 55–70, 55–64 and 65–70.
conditions, the key message is clear enough: older Europeans who leave a career job move directly into retirement to a much higher extent than older Americans.
Table 2 considers labour market transitions by level of education (at most 12 year or higher than 12 years). We find that both in Northern/Central and in Mediterranean Europe better educated individuals are less likely to move directly from a career job to permanent retirement and more likely to take up a bridge job or to switch from full to part - time work than less educated individuals. The table suggests that one reason why transitions to gradual retirement are higher in Northern/Central Europe is that older workers tend to be better educated than in Mediterranean Europe10.
Table 3 shows the self-reported reasons why individuals aged 55 to 70 left a career job and moved to a bridge job. We organize these reasons into four categories: a) resigned or mutual agreement; b) layoff, plant closure or end of temporary job; c) retirement; d) else. Broadly speaking, category a) includes mainly voluntary separa-tions and category b) is for involuntary separasepara-tions. The table suggests that close to one third of the transitions to a bridge job or to retirement in Europe occur because of layoffs, plant closures and terminations of temporary jobs. This percentage increases to close to 44% in the Mediterranean countries in our sample.
Most individuals aged between 55 and 70 who changed from a career to a bridge job have had a single new job (81.1%), and only slightly more than 5% have had three or more new jobs (see bottom part of Table 3). Among the individuals who have experi-enced a bridge job, 42% did not change both industry and occupation, almost 30% changed either occupation or industry and 28% changed both. These percentages sug-gest that changes of industry or occupation are less frequent in Europe than in the US. In his study of bridge jobs, Ruhm, (1990), found that only 24% of older Americans remained in the same occupation and industry, and 51% changed either occupation or industry11.
We have found important differences in the prevalence of bridge jobs among diffe-rent European countries (Northern and Central versus Mediterranean) and groups of individuals (less versus more educated). Demand, supply and institutional factors are likely to affect these differences. On the demand side, the availability of part-time jobs for older workers is much higher in Northern than in Southern Europe. According to Eurostat, in 2007 the percentage of male employees aged 50 to 64 who was in a
Table 2 Transitions from a career job
Still in a full time career job
Moved to a part time CJ
Moved to a bridge job
Moved directly into retirement
Full Sample
At Most 12 Years of Schooling 33.16 0.39 7.67 58.78
More Than 12 Years of Schooling 46.96 1.15 10.53 41.36
Northern Europe
At Most 12 Years of Schooling 35.13 0.66 8.86 55.35
More Than 12 Years of Schooling 46.86 1.34 11.31 40.49
Mediterranean Europe
At Most 12 Years of Schooling 30.27 - 5.90 63.83
More Than 12 Years of Schooling 47.30 0.49 7.84 44.36
By education. Males only. Age: 55–70.
part-time job was as low as 2.9 percent in Spain and as high as 22.5 percent in the Netherlands. On the supply side, the willingness and the ability to gradually rather than permanently retiring depends on the quantity and quality of human capital, which is acquired both at school and in the labour market (training). According to the OECD, 2006, the percentage of employed individuals aged 50 to 64 who participated to training during the previous 12 months was smallest in Spain and Italy and largest in Switzerland, Sweden and Denmark. These demand and supply factors suggest that tran-sitions from career jobs to gradual retirement should be less frequent in Mediterranean Europe.
Institutional rules that regulate the calculation of pension benefits also differ among countries and affect the incentives to use gradual retirement. For instance, as reported by the OECD, 2006, the net replacement rate for full career workers–measured as the ratio of net pension entitlements to net average earnings - is higher in Italy and Spain than in Denmark, Germany and The Netherlands, and favours transitions into perma-nent retirement in the former group of countries.
Since countries differ because of a wide range of observable and unobservable charac-teristics, the identification of the effects of economic institutions on the labour market transitions of older workers is difficult if not impossible using cross section data. To better illustrate this point, consider employment protection legislation, which can have two opposite effects on labour market outcomes. Stricter protection can lead both to greater retention of workers because it raises firing costs and to fewer hirings because it raises hiring costs. The OECD, 2006, plots the employment rate of men aged 50 to 64 against the strictness of employment protection in a number of member countries, and shows that there is a negative and statistically significant correlation. Yet the omis-sion of country –specific effects that can affect both employment protection and em-ployment rates implies that this correlation does not inform us of the presence of a causal relationship. One way to control for the host of time invariant country–specific effects is to use longitudinal data and focus on the variations of institutional rules over time. In the next section of this paper, we focus on two such rules, minimum retire-ment age and employretire-ment protection legislation, and exploit their within – country variations to study the effects on the labour market transitions of older workers12.
Table 3 Reasons to move to a bridge job and number and types of job changes after leaving the full time career job
Reason why CJ was stopped All Countries Mediterranean Countries
Resigned or mutual consent 36.75 29.55
Laid off, plant closure or end of temporary job 32.81 44.32
Retirement 0.52
-Else 29.92 26.14
Numbers of changes
0 1 2 3+
Number of bridge jobs after a career job - 81.15 13.61 5.24
Changes in occupation after a career job 56.02 38.22 4.71 1.05
Changes of job industry after a career job 57.59 35.60 5.50 1.31
Men aged 55–70. All European and Mediterranean countries.
The effects of changes in minimum retirement age and employment protection on the probability of gradual retirement
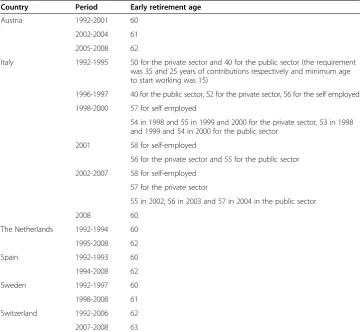
Several European countries have experienced during the 1990s and the 2000s impor-tant changes in their labour market institutions. In this section, we focus on two such institutions, employment protection legislation and minimum early retirement age, and restrict our attention to the sub-sample of countries included in SHARE which have experienced changes in minimum retirement age during the period 1992 to 2008. These countries are: Austria, Italy, Spain, Switzerland, the Netherlands and Sweden. In Austria and Sweden, minimum early retirement age increased from 60 to 61 in 2002 and 2007 respectively. In the Netherlands and Spain, minimum age increased from 60 to 62 in 1995 and 1994. In Switzerland, the increase from 62 to 63 years occurred in 2007. In Italy, there were several increases from 1996 to 2007, with minimum age rising progressively from 52 to 57 years (see Table 5 in the Appendix for further details). In all these countries, with the exception of Switzerland, the strictness of employment protection legislation has declined over the sample period, as illustrated by Figure 113.
In order to study the effects of exogenous changes in employment protection and early retirement age on the labour market behaviour of older workers who were in a career job at age 50, we use the retrospective data from SHARE to reconstruct for each male individual aged 55 to 70 at the time of the interview the annual records of his labour market status, starting from age 50. We pool data from the six countries over the period 1992–2008, match them with data on minimum retirement age and employ-ment protection for the same period and use a survival data approach. We focus on men who, at the age of 50, were holding a full-time career job. In this approach, career employment at age 50 is treated as the initial (survival) status and the transitions from career employment to gradual or to permanent retirement are treated as the
1. 9 2 2. 1 2. 2 A u st ri a
1990 1995 2000 2005 2010 year .1 4 2. 14 S w it ze rl a n d
1990 1995 2000 2005 2010 year 3 3. 2 3. 4 3. 6 3. 8 S pai n
1990 1995 2000 2005 2010 year 2 2. 5 3 3. 5 Italy
1990 1995 2000 2005 2010 year 2 2. 2 2. 4 2. 6 2. 8 Ne th e rl a n d s
1990 1995 2000 2005 2010 year 1. 5 2 2. 5 3 3. 5 Sw e d e n
1990 1995 2000 2005 2010 year
Employment Protection Legislation (epl), by Country
competing risks or hazards14. Following Jenkins, 2005, we estimate a multinomial logit model of competing risks, where the baseline category is the censored event (still in a career job).
Define Witas a variable taking the value 0 if the individual i is in a full-time career job at time t, 1 if he is in gradual retirement, and 2 if he has permanently retired. To capture the effects of minimum early retirement age RAton the decisions to perman-ently retire or take up gradual retirement, we define the variableZitas equal to zero if
RAtis lower than or equal to individual age Aitand toRAt−Aitif RAtis higher than
Ait. The variable Zit indicates that individuals older than or as old as the minimum early retirement age are not constrained by RAt in their retirement decisions (Zit= 0). On the other hand, individuals younger than RAtare affected by minimum retirement age because they can retire only after reaching it (Zit> 0). Minimum early retirement age in Europe has varied between the early 50s and the early 60s during the past twenty years. In our data, the variableZitranges from 0 to 13. Since we use data for individuals aged 55 to 70 at the time of the interview, our sample includes for each country both constrained (Zit> 0) and unconstrained individuals (Zit= 0).
We treat both gradual and permanent retirement as absorbing states and - for each individual in the sample who attains either state at time t – we drop all observations from timet + 1onwards. We estimate the following regression model
Wit¼α0þα1Aitþα1A2itþβ1Zitcþβ2EctþγGctþδXiþθcþθsþεit ð1Þ
whereAitis individual age,Ectis the index of strictness of employment protection legis-lation, Gctis a vector of country by time effects –the log real GDP per capita, the na-tional unemployment rate and life expectancy at age 50 - Xi is a vector of individual time invariant effects, which includes personal as well as job characteristics at age 50,
θc and θs are country and cohort dummies,εit is the error term, cis for the country,
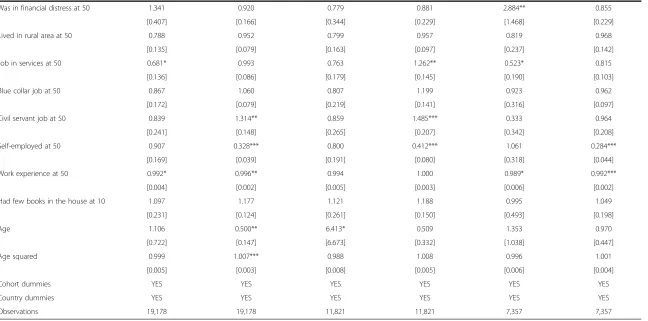
i for the individual and s for cohort. By including country dummies, we control in a flexible way for the effects of all time invariant labour market institutions that can affect the labour market transitions of older workers. We are interested in estimating the effects of Zitcand Ecton the hazard to gradual and permanent retirement, using as baseline the probability of being in a full-time career job15. We also take into account the fact that some covariates are defined at a higher level of aggregation than the dependent variable by clustering standard errors by country and time. Table 6 in the Appendix show the summary statistics of the relevant covariates.
Table 4 presents our estimates both for the full sample of six countries and for the two sub-samples of Northern/Central and Mediterranean countries. The table reports only the estimated relative risk ratios for the two key variables, employment protection
E and minimum retirement ageZ16. The estimates of the other covariates are reported in Table 8 in the Appendix. Consider first the results for the full sample–columns (1) and (2) of the table. On the one hand, we find that changes in either employment pro-tection or in minimum retirement age have had no statistically significant impact on gradual retirement. On the other hand, there is evidence that a one-year increase in minimum retirement age has had a negative and statistically significant impact on the hazard into permanent retirement.
retirement, the relative risk ratios associated to a marginal change inZandEare equal to 1.548 and 0.286 respectively (statistically significant at the 5% level of confidence), suggesting that both the increases in minimum retirement age and the reductions in the strictness of employment protection legislation have produced more exits into gradual retirement. In these countries, we find no statistical significant effect of either Z or E on exits into permanent retirement. Conversely, in the case of Mediterranean countries, we find no statistically significant effect of Z and E on exits into gradual retirement, and statistically significant effects on exits to perma-nent retirement. In particular, we find that a marginal increase in Z and in E have respectively reduced (estimated value: 0.860, statistically significant at the 1%) and increased (estimated value: 1.355, statistically significant at the 10%) the hazard into permanent retirement. These findings suggest that older male workers in Mediterranean countries have reacted to higher minimum retirement age and to lower employment protection by increasing their permanence into career jobs, ra-ther than by taking up bridge jobs with ora-ther employers, as done by their col-leagues in Northern and Central Europe.
Conclusions
We have used European data from the Survey on Health, Ageing and Retirement in Europe (SHARE) to present new evidence on the diffusion of bridge jobs in Continental Europe. We have shown that almost 9% of the European males in our sample aged 55 to 70 at the time of the interview (2008/09) have moved from a career to a bridge job on their way to (eventual) retirement, that less than 1% have switched from a full to a part-time schedule with the same employer, that about 51% have moved directly from a career job to permanent retirement, and that the remaining 39% have remained in their career job at the time of the interview. We have also shown that the traditional patterns of retirement – a move from a career job to perman-ent withdrawal from the labour force – are much more frequent in Mediterranean Europe (Italy, France and Spain) than in Northern and Central Europe (Germany, Austria, Switzerland, Netherlands, Belgium, Denmark and Sweden). These percentages
Table 4 Multinomial logit for discrete survival data (Baseline: Full time career job)
Variables All countries. Gradual retirement
All countries. Permanent retirement
North/Central. Gradual retirement
North/Central. Permanent retirement
Mediterranean. Gradual retirement
Mediterranean. Permanent retirement
Z 0.945 0.784*** 1.548** 0.845 0.959 0.860***
[0.077] [0.028] [0.313] [0.092] [0.109] [0.046]
Employment protection index
0.843 0.935 0.286** 0.854 0.522 1.355*
[0.275] [0.156] [0.164] [0.397] [0.219] [0.224]
Cohort dummies
YES YES YES YES YES YES
Country dummies
YES YES YES YES YES YES
Observations 19,178 19,178 11,821 11,821 7,357 7,357
6 European Countries. Males aged 55–70. Relative risk ratios.
suggest that partial retirement–or the transition from a career to a bridge job–is much less frequent in Continental Europe than in the US or in Japan, where it involves the ma-jority of older workers.
We have studied the effects of changes in minimum early retirement age and in the strictness of employment protection on the hazards from career jobs to gradual and permanent retirement by estimating a discrete competing hazard model with two haz-ards. Our a priori expectations were that less restrictive employment protection could have affected the hazard into bridge jobs by increasing the availability of short-term contracts with shorter working hours. We also expected to find that higher minimum retirement age, by delaying retirement, could have induced individuals wishing to con-sume additional leisure to switch from more demanding career jobs to bridge jobs. Our findings suggest that these expectations are correct only for our sample of older workers in Northern and Central European countries. In Mediterranean Europe, our results suggest that these policies have induced older workers to stay on in their full time career jobs.
What are the sources of these cross country differences? While a detailed investiga-tion is beyond the scope of the current paper, we believe that plausible candidate fac-tors are: a) on the demand side, the relative scarcity of part-time jobs available to the specific age group in Mediterranean countries; b) on the supply side, the lower level of human capital (both education and training) owned on average by older workers in Mediterranean countries, which hampers mobility and the flexibility required to profit-ably change jobs before retirement.
Endnotes 1
While we focus in this paper on employment protection and minimum retirement age, we acknowledge that other policies, including how earnings in the last years are counted in determining pension benefits and the existence of generalized partial pen-sion schemes that allow for a combination of part-time work and a partial penpen-sion, can affect transitions into retirement. Yet, insofar as these policies vary slowly or not at all over time, their effects on the variables of interest is absorbed in our analysis by coun-try fixed effects.
2
In Japan the prevalence of bridge jobs is due to mandatory retirement.
3
Since we do not observe working hours, our data are silent on other forms of phased retirement that imply a reduction in hours with the same employer, without a formal switch from full to part-time.
4
Older workers holding a part-time job in our sample are either those who were not in a career job at age 50 because they were already in a part time job or in a short -term job at that age –or those who held a career job and switched to a bridge job. In our sample of men aged 55 to 70 at the time of the interview, 8.88% did not have a career job at age 50. Of these, 21.44% had at least one part - time job during their career.
5
The definition of a career job in the US usually include both a tenure component and a full time work component during this tenure. In this paper, we adopt this defin-ition. Results which include the small fraction of part-time career jobs are reported in Table 7 in the Appendix.
6
7
Following Cahill et al., 2006, when a career job is followed by another job longer than 10 years, we consider the last job as the relevant career job.
8
In this study we assign all temporary inactivity spells due, for example, to unemploy-ment, either to the job spells occurring after inactivity, if the individual finds a job, or to retirement, if she retires from the labour market. While we acknowledge that labour market re-entry after temporary retirement can be an important feature of labour mar-ket transitions, our data do not allow to measure re-entry in an accurate manner.
9
See also Ruhm, 1990.
10
Average years of schooling in our sample are 12.6 in Northern and Central Europe and 9.8 in Mediterranean Europe.
11
These percentages are not strictly comparable to ours, because Ruhm refers to both males and females, while we only consider males.
12
The focus on time varying institutions naturally restricts the range of rules and pol-icies that we can examine, also because of data availability.
13
Our results are not qualitatively affected by the exclusion of Switzerland from the sample. The OECD indicator of employment protection refers to the protection of regular employment and the regulation of temporary work and is intended to measure the strictness of EPL. More precisely, since most of the literature on employment pro-tection emphasises the analogy of EPL to an employer-borne tax on employment ad-justment, the overall intent is to reflect the cost implications of various regulatory provisions for employers (i.e. stricter is interpreted as more costly). The overall sum-mary measure of EPL strictness relies on three main components related to protection of regular workers against (individual) dismissal, specific requirements for collective dismissals and regulation of temporary forms of employment. See OECD, 2004.
14
Transitions to gradual retirement are moves from a career to a bridge job and from full to part-time within the same career job.
15
We also explore whether the two institutions are complements or substitutes in their effects on both hazards but find little evidence of significant interactions.
16
The relative risk ratio is the exponentiated value of the estimated coefficient of the variable of interest in a multinomial logit setup. Values larger than one and smaller than one indicate that the marginal effect of the relevant covariate on the selected ha-zard is positive and negative respectively.
17
UN data available at data.un.org/Data.aspx?d = UNESCO&f = series%3ATHAGE_1
18
The structure of the European education systems 2010/11: schematic diagrams. Available at eacea.ec.europa.eu/education/eurydice/documents/tools/108EN.pdf
Appendix
We collect data on changes in minimum early retirement age from several data sources, which include Fondazione Rodolfo Debenedetti (www.frdb.org), the OECD (2011) and Angelini, Brugiavini, and Weber (2009). Results for our sample of six countries are reported in Table 5 below.
The sources of data for the covariates used in the multinomial analysis are:
– unemployment rate: Eurostat, the Statistic Database (lfsa_urgaed series)
– logarithm of per capita GDP. Source: OECD.
– years of schooling. Calculated as the difference between the age when full-time education ends (from SHARE) and the age when compulsory school starts (Source: United Nations18and Eurydice19)
– married: dummy variable indicating whether the respondent is or has ever been married (source: SHARE)
– children: dummy variable indicating whether the respondent has at least one child (source: SHARE)
– ill at 50: dummy variable indicating whether, at age 50, the respondent had ill health (source: SHARE)
– stressed at 50: dummy variable indicating whether the respondent was in a period of stress at age 50 (source: SHARE)
– poor health at 50: dummy variable indicating whether the respondent was in a period of poor health at age 50 (source: SHARE)
– financial hardship at 50: dummy variable indicating whether the respondent was in a period of financial hardship at age 50 (source: SHARE)
– living in rural area at 50: dummy variable indicating whether the respondent was living in a rural area at age 50 (source: SHARE)
Table 5 Minimum early retirement age from 1992 to 2008
Country Period Early retirement age
Austria 1992-2001 60
2002-2004 61
2005-2008 62
Italy 1992-1995 50 for the private sector and 40 for the public sector (the requirement was 35 and 25 years of contributions respectively and minimum age to start working was 15)
1996-1997 40 for the public sector, 52 for the private sector, 56 for the self employed
1998-2000 57 for self employed
54 in 1998 and 55 in 1999 and 2000 for the private sector, 53 in 1998 and 1999 and 54 in 2000 for the public sector
2001 58 for self-employed
56 for the private sector and 55 for the public sector
2002-2007 58 for self-employed
57 for the private sector
55 in 2002, 56 in 2003 and 57 in 2004 in the public sector
2008 60
The Netherlands 1992-1994 60
1995-2008 62
Spain 1992-1993 60
1994-2008 62
Sweden 1992-1997 60
1998-2008 61
Switzerland 1992-2006 62
2007-2008 63
– job at 50 full time: dummy variable indicating whether the job the respondent was doing at age 50 (the career job) was a full-time job (source: SHARE)
– job at 50 services: dummy variable indicating whether the job the respondent was doing at age 50 (the CJ in this case) was in the services sector
(source: SHARE)
Table 6 Summary statistics for the country specific macro variables
Variable Means Means Means
(6 countries)
(4 Northern countries)
(2 Mediterranean countries)
Unemployment rate (Eurostat) 6.33 4.65 8.96
Life Expectancy at 50 (Eurostat) 29 28.95 29.08
Log of GDP per capita (OECD) 9.88 9.97 9.75
Years of schooling 12.00
(0.068)
Married dummy 0.89
(0.005)
Has children 0.88
(0.005)
Dummy: stressed at 50 0.17
(0.006)
Dummy: poor health at 50 0.07
(0.004)
Dummy: financial hardship at 50 0.05
(0.003)
Dummy: living in a rural area at 50 0.35
(0.007)
Job at 50: full time 0.97
(0.002)
Job at 50: in the 3rd industry 0.57
(0.008)
Job at 50: blue collar 0.41
(0.008)
Job at 50: self employed 0.16
(0.005)
Job at 50: civil servant 0.19
(0.006)
Job at 50: lost because of layoff or plant closure
0.07
(0.004)
Years of working experience at 50 43.12
(0.375)
Dummy: few books when child 0.60
(0.007)
– job at 50 blue collar: dummy variable indicating whether the respondent was in a blue collar job at age 50 (source: SHARE)
– job at 50 public sector: dummy variable indicating whether the respondent was employed in the public sector at age 50 (source: SHARE)
– job at 50 self-employed: dummy variable indicating whether the respondent was working as self-employed at age 50 (source: SHARE)
– experience at 50: years of working experience cumulated at age 50. The variable is calculated as the sum of the years in which the respondent declares to have been working since the year when the first job started (source: SHARE)
– fewbooks: dummy indicating whether the respondent had less than 25 books during childhood (source: SHARE)
– log population at 50: the logarithm of the population aged 55-64 in each year and country (Source: Eurostat, Statistic Database)
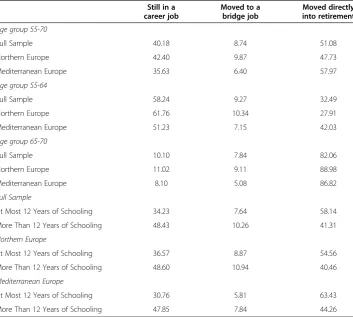
Table 6 presents summary statistics for the individual and country specific macro var-iables used in the regressions. Table 7 replicates Table 1 by adding the small fraction of individuals in part-time career jobs. Finally, Table 8 is an enlarged version of Table 4, which includes all covariates.
Table 7 Transitions from a career job
Still in a career job
Moved to a bridge job
Moved directly into retirement
Age group 55-70
Full Sample 40.18 8.74 51.08
Northern Europe 42.40 9.87 47.73
Mediterranean Europe 35.63 6.40 57.97
Age group 55-64
Full Sample 58.24 9.27 32.49
Northern Europe 61.76 10.34 27.91
Mediterranean Europe 51.23 7.15 42.03
Age group 65-70
Full Sample 10.10 7.84 82.06
Northern Europe 11.02 9.11 88.98
Mediterranean Europe 8.10 5.08 86.82
Full Sample
At Most 12 Years of Schooling 34.23 7.64 58.14
More Than 12 Years of Schooling 48.43 10.26 41.31
Northern Europe
At Most 12 Years of Schooling 36.57 8.87 54.56
More Than 12 Years of Schooling 48.60 10.94 40.46
Mediterranean Europe
At Most 12 Years of Schooling 30.76 5.81 63.43
More Than 12 Years of Schooling 47.85 7.84 44.26
Table 8 Multinomial logit for discrete survival data (Baseline: Full Time Career Job) Variables All countries.
Gradual retirement
All countries. Permanent retirement
North/Central. Gradual retirement
North/Central. Permanent retirement
Mediterranean. Gradual retirement
Mediterranean. Permanent retirement
Z 0.945 0.784*** 1.548** 0.845 0.959 0.860***
[0.077] [0.028] [0.313] [0.092] [0.109] [0.046]
Employment protection index 0.843 0.935 0.286** 0.854 0.522 1.355*
[0.275] [0.156] [0.164] [0.397] [0.219] [0.224]
Macro controls
Log real GDP per capita 0.593 9.450* 0.001** 0.945 8.716 16.068*
[1.444] [11.153] [0.002] [2.738] [43.579] [24.310]
Unemployment rate 0.952 1.078** 0.973 1.091 0.814 1.065
[0.069] [0.037] [0.105] [0.077] [0.110] [0.061]
Life expectation at 50 1.064 0.990 1.353 0.866 0.653 1.307*
[0.274] [0.149] [0.439] [0.199] [0.290] [0.209]
Individual controls
Years of schooling 1.022 0.959*** 1.027 0.959*** 1.014 0.953***
[0.022] [0.007] [0.027] [0.013] [0.036] [0.009]
Marital status 0.886 0.900 0.739 0.935 2.247 0.789
[0.222] [0.109] [0.204] [0.144] [1.203] [0.202]
Has children 1.520 0.807* 1.719* 0.772 0.854 0.959
[0.440] [0.100] [0.538] [0.122] [0.510] [0.230]
Was ill at 50 0.958 1.611** 1.033 2.129*** 0.914 1.016
[0.341] [0.313] [0.418] [0.509] [0.661] [0.335]
Was stressed at 50 1.481* 1.397*** 1.473 1.354** 1.886* 1.580*
[0.321] [0.172] [0.396] [0.203] [0.725] [0.399]
Was in poor health at 50 1.079 1.293* 1.236 1.395** 0.567 1.235
[0.343] [0.179] [0.425] [0.219] [0.606] [0.389]
Langella
IZA
Journal
of
Labor
Policy
Page
16
of
18
Table 8 Multinomial logit for discrete survival data (Baseline: Full Time Career Job)(Continued)
Was in financial distress at 50 1.341 0.920 0.779 0.881 2.884** 0.855
[0.407] [0.166] [0.344] [0.229] [1.468] [0.229]
Lived in rural area at 50 0.788 0.952 0.799 0.957 0.819 0.968
[0.135] [0.079] [0.163] [0.097] [0.237] [0.142]
Job in services at 50 0.681* 0.993 0.763 1.262** 0.523* 0.815
[0.136] [0.086] [0.179] [0.145] [0.190] [0.103]
Blue collar job at 50 0.867 1.060 0.807 1.199 0.923 0.962
[0.172] [0.079] [0.219] [0.141] [0.316] [0.097]
Civil servant job at 50 0.839 1.314** 0.859 1.485*** 0.333 0.964
[0.241] [0.148] [0.265] [0.207] [0.342] [0.208]
Self-employed at 50 0.907 0.328*** 0.800 0.412*** 1.061 0.284***
[0.169] [0.039] [0.191] [0.080] [0.318] [0.044]
Work experience at 50 0.992* 0.996** 0.994 1.000 0.989* 0.992***
[0.004] [0.002] [0.005] [0.003] [0.006] [0.002]
Had few books in the house at 10 1.097 1.177 1.121 1.188 0.995 1.049
[0.231] [0.124] [0.261] [0.150] [0.493] [0.198]
Age 1.106 0.500** 6.413* 0.509 1.353 0.970
[0.722] [0.147] [6.673] [0.332] [1.038] [0.447]
Age squared 0.999 1.007*** 0.988 1.008 0.996 1.001
[0.005] [0.003] [0.008] [0.005] [0.006] [0.004]
Cohort dummies YES YES YES YES YES YES
Country dummies YES YES YES YES YES YES
Observations 19,178 19,178 11,821 11,821 7,357 7,357
6 European Countries. Males aged 55–70. Relative risk ratios. All covariates.
Note: standard errors clustered by country and time within brackets. *p < 0.1, **p < 0.05, ***p < 0.001.
Langella
IZA
Journal
of
Labor
Policy
Page
17
of
18
Competing interests
The IZA Journal of Labor Policy is committed to the IZA Guiding Principles of Research Integrity. The authors declare that they have observed these principles.
Acknowledgements
We are grateful to an anonymous referee and to participants at a seminar in Padova for comments. This paper uses data from SHARELIFE release 1, as of November 24th 2010 and SHARE release 2.5.0, as of May 24th 2011. The SHARE data collection has been primarily funded by the European Commission through the 5th framework program (project QLK6-CT-2001- 00360 in the thematic program Quality of Life), through the 6th framework program (projects SHARE-I3, RII-CT-2006-062193, COMPARE, CIT5-CT-2005-028857, and SHARELIFE, CIT4-CT-2006-028812) and through the 7th framework program (SHARE-PREP, 211909 and SHARE-LEAP, 227822). Additional funding from the U.S. National Institute on Aging (U01 AG09740-13S2, P01 AG005842, P01 AG08291, P30 AG12815, Y1-AG-4553-01 and OGHA 04–064, IAG BSR06-11, R21 AG025169) as well as from various national sources is gratefully acknowledged. The usual disclaimer applies.
Responsible editor: Juan F Jimeno
Author details 1
Department of Economics, University of Padova, Padova, Italy.2Department of Economics, University of Verona, Verona, Italy.
Received: 31 May 2013 Accepted: 13 August 2013 Published:
References
Angelini V, Brugiavini A, Weber W (2009) Ageing and unused capacity in Europe: is there an early retirement trap? Econ Policy 4(59):463–508
Blau DM (1994) Labor force dynamics of older Men. Econometrica 62(1):117–156
Brunello G, Weber G, Weiss C (2012) Books are Forever. Early Life Conditions, Education and Lifetime Earnings in Europe”. IZA Discussion Papers 6386, Bonn
Cahill KE, Giandrea MD, Quinn JF (2005) Are traditional retirements a thing of the past? New evidence on retirement patterns and bridge jobs. In: BLS Working paper no. 384., Washington, DC
Cahill KE, Giandrea MD, Quinn JF (2006)‘Down Shifting: The Role of Bridge Jobs after Career Employment. Issue Brief no.06. The Center on Aging and Work. Workplace, Boston College, Boston
Gruber J, Wise D (1997) Social Security Programs and Retirement Around the World, NBER Working Paper No. 6134. Gustman AL, Steinmeier TL (1984) Partial retirement and the analysis of retirement behaviour. Industrial Labor Relations
535 Rev 37(3):403–415
Honig M, Hanoch G (1985) Partial retirement as a separate mode of retirement behaviour. J Hum Resour 20(1):21–46 Jenkins SP (2005) Survival Analysis using Stata, Essex University.,
https://www.iser.essex.ac.uk/resources/survival-analysis-with-stata
Kantarci T, Van Soest A (2008) Gradual retirement: preferences and limitations. De Economist 156(No. 2):113–144 OECD (2004) Employment Outlook. OECD Publishing, Paris
OECD (2006) Live Longer, Work Longer. OECD Publishing, Paris
OECD (2011) Pensions at a Glance 2011. Retirement-Income Systems in OECD and G20 Countries’, OECD Publishing., http://dx.doi.org/10.1787/pension_glance-2011-en
Peracchi F, Welch F (1994) Trends in labour force transitions of older Men and women. J Labour Econ 12(2):210–242 Quinn JF (1996)“The Role of Bridge Jobs in the Retirement Patterns of Older Americans in the 1990s”, Boston College
Working Papers in Economics no. 324. Boston College, Boston
Ruhm CJ (1990) Bridge jobs and partial retirement. J Labour Econ 8(4):482–501
Salant SW (1977) Search theory and duration data: a theory of sorts. Quart J Econ 91(1):39–57
Cite this article as:Brunello and Langella:Bridge jobs in Europe.IZA Journal of Labor Policy
Submit your manuscript to a
journal and benefi t from:
7Convenient online submission
7Rigorous peer review
7Immediate publication on acceptance
7Open access: articles freely available online
7High visibility within the fi eld
7Retaining the copyright to your article
Submit your next manuscript at 7 springeropen.com 23 Sep 2013
10.1186/2193-9004-2-11