Characterizing popularity dynamics of hot
topics using micro‑blogs spatio‑temporal data
Lianren Wu
1*, Jinjie Li
2and Jiayin Qi
1Background
With the rapid development of mobile Internet technology, human society has entered an era of high interconnection between human and information. Especially the emer-gence of online social networks, such as Weibo in China, LinkedIn, Twitter, Face-book and so on, because of its high interaction and strong group participation, makes many related information converging and merging, leading to the emergence of hot topics on the Internet. These hot topics are the aggregation of information about current events (e.g., natural disasters, sports news, celebrity news), which have geotags-timestamp information. These metadata (geotags and timestamp) are embedded within the content of the message, so that the analysis of an event can be performed by applying a space– time classification. In addition, the hot topic is the sprout of the network public opin-ion. Network public opinion has an important impact on the stability of the country and society. Therefore, the popularity of hot topics is studied from the spatial and temporal dimension can better understand the dissemination of public opinion.
This paper uses the data of Sina Weibo, one of the largest micro-blogging system in China (https ://weibo .com/), to study the following two questions: (1) study the classi-fication problem of hot topic on Weibo, cluster the popularity time series by clustering algorithm; (2) study the spatial distribution characteristics of hot topic on Weibo based on location label data.
Abstract
In this paper, a quantitative temporal and spatial analysis of the dynamics of hot topics popularity in Micro-blogging system was provided. Firstly, the popularity time series of 1167 hot topics were counted and calculated by Excel. Secondly, based on MAT-LAB software,the popularity time series were clustered into six clusters by K-spectral centroid (K-SC) clustering algorithm. Thirdly, we analyzed temporal patterns and spatial patterns of popularity dynamics of topics by statistical methods. The results show that temporal popularity of micro-blogging topics is rapidly dying, and the distribution of popularity is subject to the power law form. In addition, most of the Micro-blogging topics are global topic. Our results can provide a literature reference for studying the influence of online hot topics and the evolution of public opinion.
Keywords: Hot topics, Micro-blogs, Popularity dynamics, Power-law distribution, Statistical mechanics, Spatio-temporal analysis
Open Access
© The Author(s) 2019. This article is distributed under the terms of the Creative Commons Attribution 4.0 International License (http://creat iveco mmons .org/licen ses/by/4.0/), which permits unrestricted use, distribution, and reproduction in any medium, provided you give appropriate credit to the original author(s) and the source, provide a link to the Creative Commons license, and indicate if changes were made.
RESEARCH
The remainder of the paper is organized as follows. In “Related work” section, we introduce the related work in the area. “Data collection and description” section gives an overview of our dataset and “Methods/experimental” section reports on our temporal analysis of popularity dynamics. In “Results and discussion” section, we reports on our spatial analysis of popularity dynamics. We conclude the paper with “Conclusion” sec-tion discussing our results.
Related work
In this section we briefly review three bodies of related work. First, we summarize the modeling and popularity prediction problem, showing how it has been tackled and in which contexts. Second, we review research from spatial pattern and temporal pattern of popularity dynamics. Finally, we then turn our focus to the study of topics and micro-blogs popularity dynamics.
Modeling and predicting popularity dynamics
Online content popularity has an enormous impact on opinions, culture, policy, and profits, especially with the advent of Web 2.0 and social media. In last decade, quantita-tive understanding the popularity dynamics of online content has been attracting much attention from academia [1–5]. Popularity dynamics represents many real social phe-nomena, such as video views on YouTube [6–13], reading volume of tweets and news on social media [14–19], and movie views on online system [20–22].
Previous work on online content popularity dynamics has two main aspects: one is modeling popularity dynamics, and the other is predicting popularity. In these two aspects, scholars have achieved a lot of research results. For example, Borghol developed a framework for studying the popularity dynamics of user-generated videos, and pro-posed a model that captures the key properties of these dynamics [23]. Gleeson studied the popularity dynamics of meme and consider competition-induced criticality in the model [24]. Kim developed a model to simulation the origin of the criticality in meme popularity distribution on complex networks [25]. Li modeled information popularity dynamics via branching process on micro-blog networks [26]. Bao [27] and Shen [28] modeled and predicted popularity dynamics via an influence-based self-excited Hawkes process and reinforced Poisson processes, respectively.
Spatio‑temporal patterns of popularity dynamics
In the field of spatial dimensions, Overgoor focused on a method for brand popularity pre-diction and use it to analyze social media posts generated by various brands during a period of time [34]. Wang presented a spatio-temporal mapping system for visualizing a summary of geo-tagged social media as tags in a cloud, and it is associated with a web page by detect-ing spatio-temporal events [35]. Cunha addressed the problem of identifying and displaying tweet profiles by analyzing multiple types of data: spatial, temporal, social and content [36].
Topics and micro‑blogs popularity dynamics
With the development of data mining and tracking technology, social media research has sprung up [37–40]. As on kind of social media, micro-blogs are widely used for sensing the real-world. The popularity of micro-blogs is an important measurement for evalu-ation of the influential of pieces of informevalu-ation. Here, we restrict attention mostly to related work on popularity characterization and modeling for user-generated micro-blogs (tweets) and topics. Such as, Ma models temporal dynamics of popularity with multi-ple tipping points [14]. Zhao proposed a self-exciting point process model for predict-ing tweets popularity [16]. Sanli proposed the adoption of the so-called local variation in order to uncover salient dynamical properties. Sanli found that popular hashtags present regular and so less bursty behavior, suggesting its potential use for predicting online pop-ularity in social media [17]. Bandari construct a multi-dimensional feature space to fore-casting the popularity of news in social media [18]. Leskovec developed a framework for tracking short, distinctive phrases that travel relatively intact through on-line text [19].
In last decade, modeling and predicting the popularity dynamics of online topic has become an interesting area. Zhao proposed a short-term prediction model of topic popu-larity on micro-blogs [41]. Ardon studied more than 5.96 million topics that include both popular and less popular topics and performed a rigorous temporal and spatial analysis, investigating the time-evolving properties of the sub-graphs formed by the users discuss-ing each topic [42]. Yan proposed STH-Bass model, a Spatial and Temporal Heterogeneous Bass model derived from economic field, to predict the popularity of a single tweet [43]. Yamasaki proposed a TF-IDF-like algorithm to analyze which tags are more potentially important to earn more popularity and extended the idea to show how the important tags are geo-spatially varied and how the importance ranking of the tags evolves over time [44].
Research summary and comparison
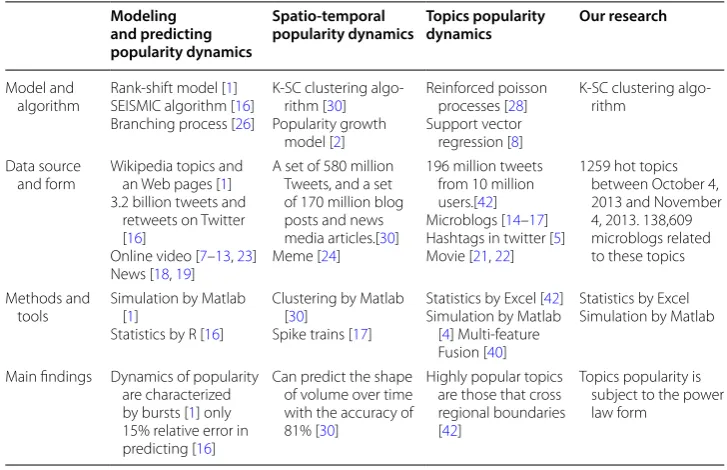
Here, we systematically compare previous research including our research, from mod-els and algorithms, data sources and type, research methods and tools, and main find-ings. The results show that the data sources and type are diverse. Data type includes online videos, blogs, micro-blogs, articles, news, hashtags, and more. The models and algorithms used are also very different, such as rank-shift model [1], SEISMIC algo-rithm [16], K-SC clustering algorithm [30], Popularity growth model [2], and so on. Our research and previous research are compared in Table 1:
Data collection and description
The data includes 1259 hot topics between October 4, 2013 and November 4, 2013, as well as 138,609 micro-blogs related to these topics. Two types of data, topic dimen-sion data and user dimendimen-sion data are recorded (see Table 2). The topic dimension includes “topic name”, “micro-blog content”, “release time”, “forwarding number”, “like number”, etc., and the user dimension includes “user name”, “user authentication”, “number of fans”, “location”, etc. Among them,the form of the “micro-blog content” maybe text, video or picture. Among the 1259 topic data, some topic data is missing, and some topics include fewer micro-blogs. After data preprocessing, we selected the topics with more than 200 related micro-blogs for research, a total of 1167.
Methods/experimental
Methods of data selection and processing
Firstly, we construct a discrete time series ni(t)=
ni(t1),. . .,ni
tj
,. . .,ni(tL)
( L repre-sents the length of the time series) by counting the number of micro-blogs that contains
Table 1 Comparisons between previous research and our research Modeling
and predicting popularity dynamics
Spatio‑temporal
popularity dynamics Topics popularity dynamics Our research
Model and
algorithm Rank-shift model [SEISMIC algorithm [1]16] Branching process [26]
K-SC clustering algo-rithm [30] Popularity growth
model [2]
Reinforced poisson processes [28] Support vector regression [8]
K-SC clustering algo-rithm
Data source
and form Wikipedia topics and an Web pages [1] 3.2 billion tweets and
retweets on Twitter [16]
Online video [7–13, 23] News [18, 19]
A set of 580 million Tweets, and a set of 170 million blog posts and news media articles.[30] Meme [24]
196 million tweets from 10 million users.[42] Microblogs [14–17] Hashtags in twitter [5] Movie [21, 22]
1259 hot topics between October 4, 2013 and November 4, 2013. 138,609 microblogs related to these topics
Methods and
tools Simulation by Matlab [1] Statistics by R [16]
Clustering by Matlab [30]
Spike trains [17]
Statistics by Excel [42] Simulation by Matlab
[4] Multi-feature Fusion [40]
Statistics by Excel Simulation by Matlab
Main findings Dynamics of popularity are characterized by bursts [1] only 15% relative error in predicting [16]
Can predict the shape of volume over time with the accuracy of 81% [30]
Highly popular topics are those that cross regional boundaries [42]
Topics popularity is subject to the power law form
Table 2 Data structure and fields
Topic dimension data User dimension data
Topic name Micro‑blog
content Release tine Forwarding number … User name Number of fans Location …
A #A#(text) 2013-12-10
15:45 852 … U1 1024 Guangdong …
⋮ ⋮ ⋮ ⋮ ⋮ ⋮ ⋮ ⋮ ⋮
A #A#(video) 2013-11-5
21:20 157 … U2 103 Shanghai …
⋮ ⋮ ⋮ ⋮ ⋮ ⋮ ⋮ ⋮ ⋮
B #B#(Picture) 2013-12-31
the topic i at time interval t , where t is measure in some time unit, e.g., hours, days. Sim-ply, ni is defined as the popularity of topic i and the shape of time series ni(t) represents
how the popularity of topic i changed over time.
In principle, the time series of each topic contains L=720 elements (i.e., the number
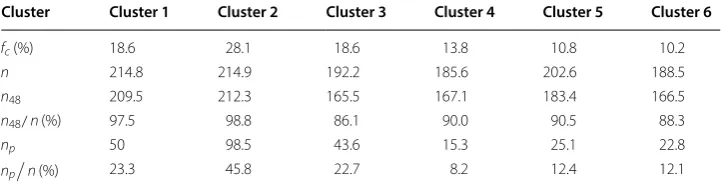
of hours in 1 month). However, the volume of topic tends to be concentrated around a peak [30]. In many time intervals, the popularity of topic is zero. This indicates that the time series of topic popularity is sparse. Thus taking such a long time series would increase the difficulty of calculation. Therefore, we truncate the time series to focus on the peak part. We truncate the length of the time series to 72 h, and shift it such that it peaks at the 1/3 of the entire length of the time series (i.e., the 24th index). From our data samples, it is found that the ratio of volume around the peak (72 h) to total volume is more than 80% (see Table 3).
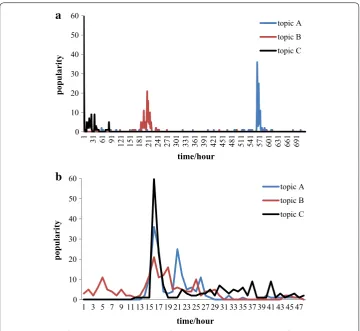
Figure 1 shows the popularity of three topics over time. Figure 1a is the original popularity time series, which contain more than 700 elements. Figure 1b shows truncated the length of the time series to 72 h, and after aligning them so that they all peak at the same time.
From Fig. 1a we find that the micro-blogs of the topic is concentrated in a few days and tends to be concentrated around a peak. Thus taking such a long time series would not be a good idea. For example, we measure the similarity between two topics that are dis-cussed intensively for several days and abandoned for the rest of the time. We would be interested mainly in the differences of them during their active days. However, the differ-ences in inactive periods may not be zero due to noise, and these small differdiffer-ences can dominate the overall similarity since they are accumulated over a long period. Therefore, we truncate the time series to focus on the “interesting” part of the time series (Fig. 1b).
We calculated the popularity time series of all 1167 topics and truncated the length of the time series to 72 h, then aligning them so that they all peak at the same time. Next, we aim to group together topics so that topics in the same group have a similar shape of the time series ni(t) . Through this method, we can understand what topics have a similar temporal pattern of popularity, and we can then consider the center of each cluster as the representative common pattern of the group.
Secondly, we need define the spatial patterns of popularity (SPP). We construct a one-dimensional vector si(l)=
si(l1),. . .,si
lj
,. . .,si(lM)
( M represents the total number of locations) by counting the number of micro-blogs that contains location lj
( 1≤j≤M ) in the topic i , where lj is measure in some location unit, e.g., cities, prov-inces. Simply, si
lj
is defined as the spatial popularity of topic i at location j and the
location one-dimensional vector. si(l) records the spatial popularity distribution of topic
Table 3 Statistics of the clusters from Fig. 3
Cluster Cluster 1 Cluster 2 Cluster 3 Cluster 4 Cluster 5 Cluster 6
fc (%) 18.6 28.1 18.6 13.8 10.8 10.2
n 214.8 214.9 192.2 185.6 202.6 188.5
n48 209.5 212.3 165.5 167.1 183.4 166.5
n48/n (%) 97.5 98.8 86.1 90.0 90.5 88.3
np 50 98.5 43.6 15.3 25.1 22.8
np
i . Figure 2 shows the spatial popularity distribution of a topic, which can be
approxi-mately described as a power-law distribution p(l)∼l−β with the exponent β=0.963.
Thirdly, we formulate the probability of a topic i which belongs to a specific location j as Eq. (1)
0 10 20 30 40 50 60
1 31 61 91 121 151 181 211 241 271 301 331 361 391 421 451 481 511 541 571 601 631 661 691
popularit
y
time/hour
a
topic A topic B topic C
0 10 20 30 40 50 60
1 3 5 7 9 11 13 15 17 19 21 23 25 27 29 31 33 35 37 39 41 43 45 47
popularit
y
time/hour
b
topic A topic B topic C
Fig. 1 Popularity of topics changed over time. This figure shows the temporal patterns of popularity dynamics of three topics. a Represents the original popularity, and b represents the popularity after processing
y = 0.2419x-0.963 R² = 0.9139
0.00 0.05 0.10 0.15 0.20 0.25 0.30
1 3 5 7 9 11 13 15 17 19 21 23 25 27 29
popularity
location/province
Thus, we can also construct a location probability vector
P(topici)=plocationj|topici, 1≤j≤M . In addition, the main location can be determined by the maximum of probability for topici . As shown in Eq. (2)
In Eq. (2), a main location of the topic is calculated. Then, we can use Eq. (3) to deter-mine whether the topic is a local topic or global topic.
In Eq. (3), if the probability of a topic’s main location exceeds the threshold θ , the topic would be regarded as a local topic.
K‑spectral centroid (K‑SC) clustering algorithm
In this paper, we use the K-spectral centroid (K-SC) clustering algorithm proposed by Yang to process the time series of topic popularity [30]. The specific algorithm is as follows:
(1)
p
locationj|topici
= the number of messages which contain locationjin topici
the total number of messages in topici
(2)
maimLocation(topici)=arg max locationj
p
locationj|topici
(3)
Locationi =
Results and discussion
Temporal patterns of popularity dynamics (TPPD)
We determine the number of clusters K =6 . Figure 3 is the result of each clusters, Tables 3 and 4 give further descriptive statistics for each of the six clusters.
In Fig. 3, cluster 1 is topic about life and health. Cluster 2 is topic about fashion enter-tainment. Such topic can attract a lot of attention in a very short time, and will quickly lose attention. Cluster 3 is topic about leisure mood,such as #Missing is better than meeting#, # What I love is that you love me#, # Those people in those years#, # Happy Time on Campus#. Cluster 4, 5, 6 are all topics of social hot events, including natu-ral disasters, public health, official corruption, social justice and other topics. Such as
0 10 20 30 40 50 60
1 4 7 10131619222528313437404346
popularity
time/hour
a Cluster 1
0 20 40 60 80 100 120
1 4 7 10131619222528313437404346
popularity
time/hour
b
Cluster 20 5 10 15 20 25 30 35 40 45 50
1 4 7 10131619222528313437404346
popularity
time/hour
c Cluster 3
0 2 4 6 8 10 12 14 16 18
1 4 7 10131619222528313437404346
popularity
time/hour
d Cluster 4
0 5 10 15 20 25 30
1 4 7 10131619222528313437404346
popularity
time/hour
e Cluster 5
0 5 10 15 20 25
1 4 7 10131619222528313437404346
popularity
time/hour
f Cluster 6
# Voluntary extension of old-age contributions#, #Is it possible to cancel the golden week?#.
Figure 3 exhibits the high variability in the cluster shapes and very spiky temporal behavior, where the peak lasts for less than 4 h. We found that the hot topic at the top of the list lost their attention after 2 days and was replaced by other topics. Cluster 1 and Cluster 3, accounts for 18.6% of the total topic respectively, had a quick rise followed by a monotone decay. The biggest cluster, cluster 2 accounts for 28.1%, is characterized by a super quick rise just 1 h before peak and a quicker decay than cluster 1 and cluster 3. Finally, topics in cluster 4, 5 and 6 stay popular for more than 3 days, and experience a small peak on the first day and a larger one on the second day.
Figure 4 shows the distribution of popularity decay after peak. We find that the distri-butions of popularity decay can be approximately described by power-law distribution. We extract the exponents using a least-square fit on the logarithm of the data.
In Fig. 5, we describe the relationship of two statistical values, namely, peak fraction of popularity and the exponents of popularity decay. The results show that the exponents of popularity decay is positively correlated with the peak fraction.
Spatial patterns of popularity dynamics (SPPD)
We calculate the location probability vector P(topici)=plocationj|topici of all 1167 topics, as well as the exponent of topic spatial popularity distribution β . We find that the maximum of probability max
p(location|topic) for each topic is approximately
posi-tively correlated with the exponent of topic spatial popularity distribution β (in Fig. 6).
Before we determine the threshold θ , we need to know the distribution of the maxi-mum probability max
p(location|topici)
, 1≤i≤1167 . Figure 7a shows the
distri-bution of the maximum probability for each topic. As can be seen from Fig. 7a, the maximum probability is mainly concentrated in the intervals [0.05, 0.15) and [0.15, 0.25), which are 32% and 25%, respectively. Shown in Fig. 7b is the ratio of global top-ics and local toptop-ics as functions of threshold θ.
In addition, we characterize the spatial popularity of each cluster and find that the distributions of spatial popularity follow power-law. We extract the exponents using a least-square fit (shown in Fig. 8). Tables 5 and 6 give further descriptive statistics for each of the six clusters. In Fig. 8, we find that the spatial popularity of topics for each cluster following power-law distribution p(l)∼l−β , where l represents the
spa-tial location. The exponent β represents the heterogeneity of the spatial popularity
distribution.
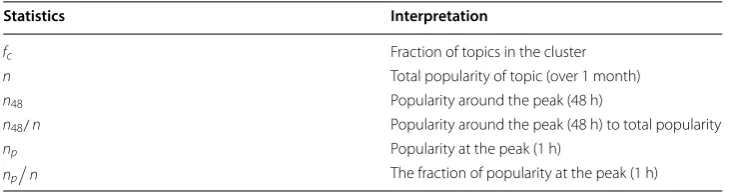
Table 4 Interpretation of statistics
Statistics Interpretation
fc Fraction of topics in the cluster
n Total popularity of topic (over 1 month)
n48 Popularity around the peak (48 h)
n48/n Popularity around the peak (48 h) to total popularity
np Popularity at the peak (1 h)
np
y = 65.863x-1.384 R² = 0.9725
0.1 1 10 100
1 10 100
popularity
a
cluster 1y = 162.21x-1.789 R² = 0.9382
0.1 1 10 100
1 10 100
popularity
b
Cluster 2y = 36.306x-1.25 R² = 0.9573
0.1 1 10 100
1 10 100
popularity
c
Cluster 3y = 17.612x-0.812 R² = 0.8889
0.1 1 10 100
1 10 100
popularity
d
cluster 4y = 21.735x-1.121 R² = 0.8751
0.1 1 10 100
1 10 100
popularity
e
Cluster 5y = 50.143x-1.254 R² = 0.8239
0.1 1 10 100
1 10 100
popularity
time/hour
f
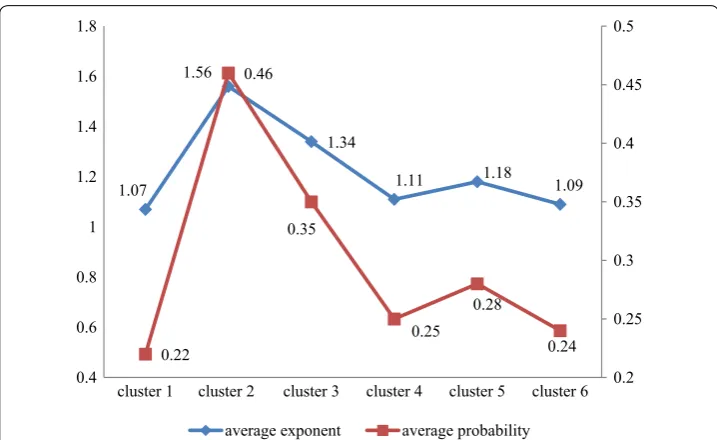
Cluster 6Figure 9 shows the relationship between average exponent of spatial distribution and average probability of location. From Fig. 9, we can find that the two statistics have posi-tive correlation.
Conclusion
With the development of data collection and tracking technology, social media research has sprung up. As a kind of social media, micro-blogs are widely used for sensing the real-world. The popularity of micro-blogging topics is an important measurement for evaluation of the influential of an event. The popularity of topics was studied from the spatial and temporal dimension, which can better understand the dissemination of pub-lic opinion. In our research, we solved two problems: (1) study the classification problem
1.38
1.79
1.25
0.81
1.12 1.25
23.3%
45.8%
22.7%
8.2%
12.4% 12.1%
5% 10% 15% 20% 25% 30% 35% 40% 45% 50%
0.4 0.6 0.8 1 1.2 1.4 1.6 1.8 2
cluster 1 cluster 2 cluster 3 cluster 4 cluster 5 cluster 6 exponents of the popularity decay peak fraction of popularity
Fig. 5 The relationship between the two statistical values. This figure describes the relationship of peak fraction of popularity and the exponents of popularity decay
y = 1.3477x + 0.7999 R² = 0.6803
0 0.5 1 1.5 2 2.5 3 3.5 4
0 0.2 0.4 0.6 0.8 1
exponent
maximum probability
of hot topics in the micro-blogging system, cluster the popularity time series by cluster-ing algorithm; (2) study the spatial distribution characteristics of hot topics. The results from our research show that the temporal popularity of hot topics is rapidly dying, and the distribution of popularity is subject to the power law form. In addition, the higher of peak fraction of popularity, the faster the popularity disappears. On the other hand, the spatial distribution of topics is also very broad. The maximum probability is mainly concentrated in the intervals [0.05, 0.15) and [0.15, 0.25), which are 32% and 25%,
32%
25%
14%
3% 6%
8%
5% 7%
0% 5% 10% 15% 20% 25% 30% 35%
[0.05,0.15) [0.15,0.25) [0.25,0.35) [0.35,0.45) [0.45,0.55) [0.55,0.65) [0.65,0.75) [0.75,0.85) maximum probability
a
0% 10% 20% 30% 40% 50% 60% 70% 80% 90% 100%
0 0.1 0.2 0.3 0.4 0.5 0.6 0.7 0.8 0.9
threshold θ
b
global topic local topic
y = 0.3126x-1.075 R² = 0.9338
0 0.05 0.1 0.15 0.2 0.25 0.3 0.35
1 3 5 7 9 111315171921232527293133
popularity
location/province
a
Cluster 1y = 0.686x-1.56 R² = 0.885
0 0.1 0.2 0.3 0.4 0.5 0.6 0.7 0.8
1 3 5 7 9 11 13 15 17 19 21 23 25 27 29 31
popularity
location/province b Cluster 2
y = 0.413x-1.34 R² = 0.946
0 0.050.1 0.150.2 0.250.3 0.350.4 0.45
1 3 5 7 9 111315171921232527293133
popularity
location/province
c
Cluster 3y = 0.355x-1.11 R² = 0.896
0 0.05 0.1 0.15 0.2 0.25 0.3
1 3 5 7 9 111315171921232527293133
popularity
location/province
d
Cluster 4y = 0.3469x-1.18 R² = 0.8859
0 0.05 0.1 0.15 0.2 0.25 0.3
1 3 5 7 9 1113151719212325272931
popularity
location/province
e
Cluster 5y = 0.3191x-1.092 R² = 0.9661
0 0.05 0.1 0.15 0.2 0.25 0.3
1 3 5 7 9 11 13 15 17 19 21 23 25 27 29 31
popularit
y
location/province
f Cluster 6
Fig. 8 Spatial distribution of topic popularity for each cluster. This figure indicates spatial patterns of popularity dynamics
Table 5 Statistics of the clusters from Fig. 8
Cluster Cluster 1 Cluster 2 Cluster 3 Cluster 4 Cluster 5 Cluster 6
fc (%) 18.6 28.1 18.6 13.8 10.8 10.2
pmax 0.71 0.84 0.84 0.62 0.79 0.62
pmin 0.11 0.13 0.12 0.11 0.12 0.09
pave 0.22 0.46 0.35 0.25 0.28 0.24
βmax 1.68 3.34 2.81 1.68 1.49 1.68
βmin 0.86 0.92 0.94 0.86 0.85 0.83
respectively. This shows that most of the hot topics are global topic. The results analyzed the temporal and spatial popularity dynamics of online topics. It can provide a literature reference for studying the influence of online topics and the evolution of public opinion.
Abbreviations
K-SC: K-spectral centroid; SPPD: spatial patterns of popularity dynamics; TPPD: temporal patterns of popularity dynamics. Acknowledgements
This work was supported by the project of National Natural Science Foundation of China (No. 71601005). Authors’ contributions
LW took the role of performing the literature review, and responsible for data collection and data analysis guidance. JL conducted data processing and analysis. JQ took on a supervisory role and oversaw the completion of the work. All authors read and approved the final manuscript.
Funding
This work was supported by the project of National Natural Science Foundation of China (No. 71601005) Availability of data and materials
The datasets generated and/or analyzed during the current study are available in the website http://www.suibe .edu.cn/ ai/main.psp.
Table 6 Interpretation of statistics
Statistics Interpretation
fc The proportion of topic in the cluster
pmax The maximum probability of topic in the cluster
pmin The minimum probability of topic in the cluster
pave The average probability of topic in the cluster
βmax The maximum exponent of topic in the cluster
βmin The minimum exponent of topic in the cluster
βave The average exponent of topic in the cluster
1.07 1.56
1.34
1.11 1.18 1.09
0.22
0.46
0.35
0.25 0.28
0.24 0.2 0.25 0.3 0.35 0.4 0.45 0.5
0.4 0.6 0.8 1 1.2 1.4 1.6 1.8
cluster 1 cluster 2 cluster 3 cluster 4 cluster 5 cluster 6
average exponent average probability
Competing interests
The authors declare that they have on competing interests. Author details
1 School of Management, Shanghai University of International Business and Economics, Shanghai 201620, China. 2 School of Tourism, Shanghai Normal University, Shanghai 201418, China.
Received: 4 August 2019 Accepted: 4 November 2019
References
1. Ratkiewicz J, Fortunato S, Flammini A, et al. Characterizing and modeling the dynamics of online popularity. Phys Rev Lett. 2010;105(15):158701.
2. Lymperopoulos IN. Predicting the popularity growth of online content: model and algorithm. Inf Sci. 2016;369:585–613.
3. Szabo G, Huberman BA. Predicting the popularity of online content. Commun ACM. 2010;53(8):80–8.
4. Yan Q, Wu L. Impact of bursty human activity patterns on the popularity of online content. Disc Dynam Nat Soc. 2012;2012:29–31.
5. Ma Z, Sun A, Cong G. On predicting the popularity of newly emerging hashtags in Twitter. J Assoc Inf Sci Technol. 2014;64(7):1399–410.
6. Ren ZM, Shi YQ, Liao H. Characterizing popularity dynamics of online videos. Physica A. 2016;453:236–41. 7. Li H, Ma X, Wang F, et al. On popularity prediction of videos shared in online social networks. In: Proceedings of the
22nd ACM international conference on information and knowledge management. ACM; 2013, p. 169–78. 8. Trzciński T, Rokita P. Predicting popularity of online videos using support vector regression. IEEE Trans Multimedia.
2017;19(11):2561–70.
9. Zhou Y, Chen L, Yang C, et al. Video popularity dynamics and its implication for replication. IEEE Trans Multimedia. 2015;17(8):1273–85.
10. Zhou R, Khemmarat S, Gao L, et al. Boosting video popularity through keyword suggestion and recommendation systems. Neurocomputing. 2016;205:529–41.
11. Wu J, Zhou Y, Chiu DM, et al. Modeling dynamics of online video popularity. IEEE Trans Multimed. 2016;18(9):1882–95.
12. Figueiredo F, Almeida JM, Gonçalves MA, et al. On the dynamics of social media popularity: a YouTube case study. ACM Trans Internet Technol. 2014;14(4):24.
13. Qiu T, Ge Z, Lee S, et al. Modeling channel popularity dynamics in a large IPTV system. ACM SIGMETRICS perfor-mance evaluation review. ACM. 2009;37(1):275–86.
14. Ma H, Qian W, Xia F, et al. Towards modeling popularity of microblogs. Front Comput Sci. 2013;7(2):171–84. 15. Zhang X, Chen X, Chen Y, et al. Event detection and popularity prediction in microblogging. Neurocomputing.
2015;149:1469–80.
16. Zhao Q, Erdogdu M A, He H Y, et al. Seismic: A self-exciting point process model for predicting tweet popularity. In: Proceedings of the 21th ACM SIGKDD international conference on knowledge discovery and data mining. ACM; 2015, p. 1513–22.
17. Sanlı C, Lambiotte R. Local variation of hashtag spike trains and popularity in twitter. PLoS ONE. 2015;10(7):e0131704. 18. Bandari R, Asur S, Huberman BA. The pulse of news in social media: forecasting popularity. ICWSM. 2012;12:26–33. 19. Leskovec J, Backstrom L, Kleinberg J. Meme-tracking and the dynamics of the news cycle. In: Proceedings of the
15th ACM SIGKDD international conference on knowledge discovery and data mining. ACM; 2009, p. 497–506. 20. Hu HB, Han DY. Empirical analysis of individual popularity and activity on an online music service system. Phys A.
2008;387(23):5916–21.
21. Yeung CH, Cimini G, Jin CH. Dynamics of movie competition and popularity spreading in recommender systems. Phys Rev E. 2011;83(1):016105.
22. Pan RK, Sinha S. The statistical laws of popularity: universal properties of the box-office dynamics of motion pictures. New J Phys. 2010;12(11):115004.
23. Borghol Y, Mitra S, Ardon S, et al. Characterizing and modelling popularity of user-generated videos. Perform Eval. 2011;68(11):1037–55.
24. Gleeson JP, Ward JA, Osullivan KP, et al. Competition-induced criticality in a model of meme popularity. Phys Rev Lett. 2014;112(4):048701.
25. Kim Y, Park S, Yook SH. The origin of the criticality in meme popularity distribution on complex networks. Sci Rep. 2016;6:23484.
26. Li JJ, Wu LR, Qi JY, et al. Modeling information popularity dynamics via branching process on micro-blog network. Chin Phys Lett. 2017;34(6):068901.
27. Bao P. Modeling and predicting popularity dynamics via an influence-based self-excited Hawkes process. In: Proceedings of the 25th ACM international on conference on information and knowledge management. ACM, 2016:1897–1900.
28. Shen HW, Wang D, Song C, et al. Modeling and predicting popularity dynamics via reinforced poisson processes. AAAI. 2014;14:291–7.
29. Wu B, Mei T, Cheng WH, et al. Unfolding temporal dynamics: predicting social media popularity using multi-scale temporal decomposition. AAAI. 2016;2016:272–8.
31. Stilo G, Velardi P. Efficient temporal mining of micro-blog texts and its application to event discovery. Data Min Knowl Disc. 2016;30(2):372–402.
32. Brambilla M, Ceri S, Daniel F, et al. Temporal analysis of social media response to live events: the milano fashion week. In: International conference on web engineering. Springer, Cham; 2017, p. 134–50.
33. Trattner C, Moesslang D, Elsweiler D. On the predictability of the popularity of online recipes. EPJ Data Sci. 2018;7(1):20.
34. Overgoor G, Mazloom M, Worring M, et al. A spatio-temporal category representation for brand popularity predic-tion. In: Proceedings of the 2017 ACM on international conference on multimedia retrieval. ACM; 2017, p. 233–41. 35. Wang Y, Pozi M S M, Yasui G, et al. Visualization of spatio-temporal events in geo-tagged social media. In:
Interna-tional symposium on web and wireless geographical information systems. Springer, Cham; 2017, p. 137–52. 36. Cunha T, Soares C, Rodrigues E M. Tweeprofiles: detection of spatio-temporal patterns on twitter. In: International
conference on advanced data mining and applications. Springer, Cham; 2014, p. 123–36.
37. Injadat MN, Salo F, Nassif AB. Data mining techniques in social media: a survey. Neurocomputing. 2016;214:654–70. 38. Hasan M, Orgun MA, Schwitter R. A survey on real-time event detection from the twitter data stream. J Inf Sci.
2017;44:0165551517698564.
39. Ratkiewicz J, Menczer F, Fortunato S, et al. Traffic in social media ii: Modeling bursty popularity. In: 2010 IEEE second international conference on social computing (SocialCom). IEEE; 2010, p. 393–400.
40. Lv J, Liu W, Zhang M, et al. Multi-feature fusion for predicting social media popularity. In: Proceedings of the 2017 ACM on multimedia conference. ACM; 2017, p. 1883–88.
41. Zhao J, Wu W, Zhang X, et al. A short-term prediction model of topic popularity on microblogs. In: Computing and combinatorics. Springer Berlin Heidelberg; 2013, p. 759–69.
42. Ardon S, Bagchi A, Mahanti A, et al. Spatio-temporal and events based analysis of topic popularity in twitter. In: Proceedings of the 22nd ACM international conference on information and knowledge management. ACM; 2013, p. 219–28.
43. Yan Y, Tan Z, Gao X, et al. STH-Bass: a spatial-temporal heterogeneous bass model to predict single-tweet popularity. In: International conference on. Springer, Cham; 2016, p. 18–32.
44. Yamasaki T, Hu J, Aizawa K, et al. Power of tags: predicting popularity of social media in geo-spatial and temporal contexts. In: Advances in multimedia information processing – PCM 2015. Springer International Publishing; 2015, p. 149–58.
Publisher’s Note