Monitoring of the daily living activities
in smart home care
Jan Vanus
1*, Jana Belesova
1, Radek Martinek
1, Jan Nedoma
2, Marcel Fajkus
2, Petr Bilik
1and Jan Zidek
1Abstract
One of the key requirements for technological systems that are used to secure inde-pendent housing for seniors in their home environment is monitoring of daily living activities (ADL), their classification, and recognition of routine daily patterns and habits of seniors in Smart Home Care (SHC). To monitor daily living activities, the use of a temperature, CO2, humidity sensors, and microphones are described in experiments in
this study. The first part of the paper describes the use of CO2 concentration
measure-ment for detecting and monitoring room´s occupancy in SHC. In second part focuses this paper on the proposal of an implementation of Artificial Neural Network based on the Levenberg–Marquardt algorithm (LMA) for the detection of human presence in a room of SHC with the use of predictive calculation of CO2 concentrations from
obtained measurements of temperature (indoor, outdoor) Ti, To and relative air
humid-ity rH. Based on the long-term monitoring (1 month) of operational and technical functions (unregulated, uncontrolled) in an experimental Smart Home (SH), LMA was trained through the data picked up by the sensors of CO2, T and rH with the aim to
indirectly predict CO2 leading to the elimination of CO2 sensor from the measurement
process. Within the realized experiment, input parameters of the neuronal network and the number of neurons for LMA were optimized on the basis of calculated values of Root Mean Squared Error, the correlative coefficient (R) and the length of the meas-ured training time ANN. With the use of the trained network ANN, we realized a strictly controlled short-term (11 h) experiment without the use of CO2 sensor. Experimental results verified high method accuracy (>95%) within the short-term and long-term experiments for learned ANN (1.6.2015–30.6.2015). For learned ANN (1.2.2014– 27.2.2014) was verified worse method accuracy (>60%). The original contribution is a verification of a low-cost method for the detection of human presence in the real operating environment of SHC. In the third part of the paper is described the practical implementation of voice control of operating technical functions by the KNX tech-nology in SHC by means of the in-house developed application HESTIA, intended for both the desktop system version and the mobile version of the Windows 10 operating system for mobile phones. The resultant application can be configured for any build-ing equipped with the KNX bus system. Voice control implementation is an in-house solution, no third-party software is used here. Utilization of the voice communication application in SHC was proven on the experimental basis with the combination of measurement CO2 for ADL monitoring in SHC.
Keywords: Voice recognition, Additive noise, KNX, ETS, C#, Smart home care, Activities of daily living, Levenberg–Marquardt algorithm, Bland–Altman method
Open Access
© The Author(s) 2017. This article is distributed under the terms of the Creative Commons Attribution 4.0 International License (http://creativecommons.org/licenses/by/4.0/), which permits unrestricted use, distribution, and reproduction in any medium, provided you give appropriate credit to the original author(s) and the source, provide a link to the Creative Commons license, and indicate if changes were made.
RESEARCH
*Correspondence: jan.vanus@vsb.cz
1 Department of Cybernetics
Introduction
Monitoring the activities of daily living (ADLs) and detection of deviations from previ-ous patterns is crucial to assessing the ability of an elderly person to live independently in their community and in early detection of upcoming critical situations. “Aging in place” for an elderly person is one key element in ambient assisted living (AAL) tech-nologies [1]. For recognition [2–15] and classification of ADL [16, 17] are used various mathematical methods such as Hidden Markov Model (HMM), Linear Discriminant Analysis (LDA) and Support Vector Machines (SVM) [18, 6], Artificial Neural Networks (ANN) [11] or adaptive-network-based fuzzy inference system (ANFIS) [19, 20]. For detection of ADL in SHC it is possible to use RFID [21], PIR [22], CO2 [23] sensors or
presence sensors, on the basis of which probability models of the people’s behavior in SH [24] can be built, respecting the privacy [25] of SHC residents [26]. One of the ways of performing the ADL is motion detection [27, 28] and falls of seniors [29, 30] which may end tragically in the case of late intervention. Therefore, it is necessary to design such a technology solution system that will allow a range of services including data collection and analysis of long-term trends in behaviors and physiological parameters (e.g. relating to sleep or daily activity); warnings, alarms and reminders; and social interaction [31].
An example might be the technology system AAL [32]. The proposed technology
sys-tems need to be based on the real needs of SHC residents [1]. For the comfort and a feeling of safety [33] of the SH residents, sensors are designed to use of advanced mobile devices in diverse scenarios, by developing wearable sensors, and by using numerous sensors embedded in the environment in SHC [34]. For example, Liu investigates the importance of spatiotemporal reasoning and uncertainty reasoning in the design of Smart Homes. Accordingly, a framework for applying a methodology referred as Rule-based Inference Methodology using the Evidential Reasoning in conjunction with Smart
Home Framework considering spatiotemporal aspects of ADL is outlined [35]. Noury
solved a very interesting way of ADL implementation in SH by detecting the energy con-sumption of the SH [36]. Another alternative for the effective implementation of ADL monitoring can also be used to the IoT concept within the SH inclusion in the concept of Smart Cities [37].
The objective of the article is to describe and evaluate new approaches to the technical solution for monitoring the presence of persons in individual rooms of intelligent build-ings (IB) (SH, SHC) to determine the occupancy of the monitored spaces with the pos-sibility of using the information obtained to determine the ADL by existing technology systems that can be used in the SHC.
The aim of the first part of the article is the use and processing of information from operationally measured non-electrical quantities determining the indoor environment in the SHC using operational technological units for the determination of the ADL in a real-world SHC environment. To obtain an overview of the occupancy of individual rooms of the SHC (time of arrival, time of departure, number of persons), the indirect measurement of CO2 concentration (ppm) with operational CO2 (ppm) sensors is used.
The aim of the second part of the article is to use ANN to predict the measured quantities for the purpose of monitoring the ADL in a real-world SHC environment. It describes the process of using the multilayer forward ANN to predict the course of CO2
interior of the SHC in the selected room R104 and from the outdoor temperature read-ings To (°C), with the gradient algorithm of error backpropagation using the Levenberg– Marquardt (LMA) prediction. For the classification of prediction quality, a correlation analysis (correlation coefficient R), calculated RMSE (Root Mean Squared Error) and Mean Absolute Percentage Error (MAPE) and Bland–Altman method are used.
The third part of the article aims to connect and test the created HESTIA applica-tion for visualizaapplica-tion and voice control of operaapplica-tional technical features using real-world KNX technology to determine the ADL. As complementary information for more pre-cise determination of activities of SHC inhabitants, the presence of persons in the SHC room is monitored using the CO2 sensor and the prediction of the CO2 course from the
measured Ti (°C), the relative humidity rH (%) in the interior of the selected room of the SHC and the measured outdoor temperature To (°C) using the above methods. The applications described below may be used for detecting ADL in the SHC.
Description of the used technologies
The Smart two-floor wooden house (hereafter Smart Home; floor area of: 12.1 m × 8.2 m; (Fig. 1) was built as a training centre of the Moravian-Silesian Wood Cluster (MSWC). The wooden house (SHC) was built to a passive standard in accord-ance with standards ČSN 75 0540-2 and ČSN 730540-2(2002).
Description of the used technologies
For heating, cooling and forced ventilation, BACnet (Building Automation and Controls Network) technology is used in the SHC. Lighting, blinds and mains sockets are con-trolled by KNX technology, which is interconnected with BACnet (Fig. 2).
Visualization and archiving of measured values of non-electric quantities are realized in the master visualization system Desigo Insight, for example measurement of tempera-ture, humidity, CO2 for monitoring and control of the indoor environment of individual
rooms of SHC. To perform the evaluation of the measured non-electrical quantities, the values of CO2, temperature (T) and relative humidity (rH) in selected rooms have been
chosen and measured by means of air quality sensor QPA 2062. The technical param-eters of the sensor are as follows:
• Temperature indoor Ti, (sensor (QPA 2062), (within 0 and 50 °C/−35 to 35 °C,
accu-racy ±1 K) implemented in BACnet technology) and Temperature outdoor T0,
(sen-sor AP 257/22, measuring range −30…+80 °C, resolution: 0.1 °C), implemented in KNX technology).
• Relative humidity (rH) measurement (sensor (QPA 2062), (within 0 and 100%, accu-racy ±5%), implemented in BACnet technology),
• CO2 measurement (sensor (QPA 2062), (within 0 and 2000 ppm, accuracy ±50 ppm,
implemented in BACnet technology).
For the actual experiment room R104 was used (Fig. 3) in the SHC.
First part—use of CO2 sensors for determining the presence and occupation of a room in the SHC
Monitoring of ADL or occupancy of the SHC rooms serves to more accurately and efficiently regulate the operational-technical functions in the SHC (reduction of oper-ating costs and energy consumption, comfort of controlling operational technical func-tions in the SHC and object security) and for indirect monitoring of daily activities of seniors in order to prevent borderline and critical situations (fall of an elderly person, injury, death). In connection with ADL monitoring, carbon dioxide (CO2)
concentra-tions can be used in occupied SHC rooms. The actual measurement of CO2 is primarily
performed in order to control the quality of the indoor environment (air) in individual SHC rooms, to ensure hygienic conditions and to control the HVAC in the SHC. Air quality in rooms has a significant impact on personal well-being and people’s attention.
Higher CO2 concentrations lead to premature fatigue, while prolonged exposure may
lead to headaches or other ailments [38]. The concentration of CO2 is the most common
contaminant in indoor building environments. In interiors of buildings there is always higher concentration than outside. The main source of the increase in CO2
concentra-tion in the interior of the IB is above all human. During breathing, oxygen and CO2 are
exchanged. CO2 production is in direct proportion to physical activity. The carbon
diox-ide concentration is given in ppm (parts per million) [39].
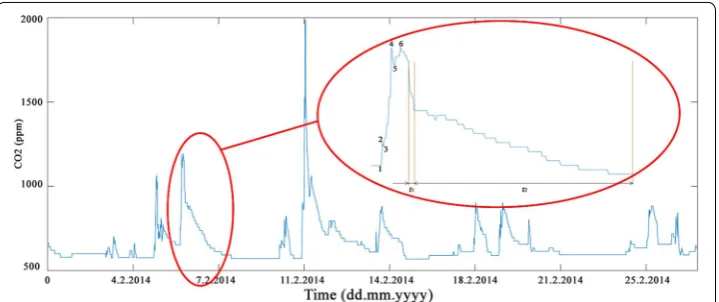
From the measured values of CO2 concentration (Fig. 4) in room R104 it is possible
to determine the time of arrival or departure of a person to/from the monitored space (Fig. 5). This is based on the assumption that if the CO2 increases then there is a person
Fig. 3 Ground floor of the SHC with indication of the sensors used for measuring temperature, relative humidity and CO2 in room R104
present (source of CO2). When the person leaves the monitored space, the increase in
CO2 concentration:
• stagnates or remains constant (Fig. 5), points 2–3, 5–6, 7–8, 15–16, 18–19, 20–21, 24–25; i.e. closed windows, doors, no forced ventilation,
• rapid decrease (Fig. 5), points 19–20, 23–24), open window or doors,
• gradually (Fig. 5), points 4–5, 9–10, 11–12, closed windows, doors, no forced ventila-tion.
It is also possible to determine, based on the dispersion of CO2 concentration, the
manner of dispersion of CO2 in the space of the room [opening the window, switching
on forced ventilation, natural scattering of CO2 (ppm)] (Fig. 6).
Results first part
The experiments described above (Figs. 4, 5, 6) have shown that CO2 can be used for
ADL monitoring, occupancy detection and classification of determination of behaviour of the occupants of the SHC, SH or IB. Information obtained during the measurement of CO2 (ppm) can also be used to determine the indoor environment quality of each space
in the SHC, SH or IB.
Discussion
Information about the quality of the internal environment in an IB is provided by tem-perature sensors (indoor, outdoor) Ti, To (°C) and air humidity sensors rH (%). This
information is crucial for the comfort and occupancy of separate rooms of IB. The cost of high-quality temperature and air humidity sensors is approximately in the range of
Euro units. The cost of sensors for the measurement of CO2 moves the price a rank
higher to several tens of Euro. In the Czech Republic (CR), the emphasis is placed on the utilization of a good thermal insulation for large buildings, which can finally provide cer-tain energy savings. This is realized for big office buildings, schools, hospitals, residential dwellings, family houses and blocks of flats. The internal environment of reconstructed insulated buildings is continuously getting worse with the increase in CO2
concentra-tions and humidity rH. Many investors in the CR do not take this fact into account. To decrease the concentration of CO2 in a room we can easily open a window and a door, or
to use a forced ventilation as the part of a complex solution provided by HVAC technol-ogy (Heating, Ventilation and Air Conditioning). Regarding the technoltechnol-ogy utilization in connection with the automatization of buildings, it is necessary to provide the measure-ment of CO2 concentration before the implementation of HVAC controlled technology.
Second part—the optimized artificial neural network model with Levenberg– Marquardt algorithm for detecting human presence in SHC
Different types of sensors and technological equipment with regard to robustness, quality, design, capital and operating costs are used to determine the movement, loca-tion and time of occurrence of persons for the purpose of indirectly determining the space occupancy of intelligent buildings IB (administrative buildings, schools, hospi-tals, homes for the elderly, households), and to optimize the management of opera-tional and technical functions in IB (lighting, blinds, HVAC). To detect the movement of people or for monitoring ADL within the building, the PIR motion sensors, pres-ence sensor, GPS sensor or Smart Phones is possible using (Table 1) [40]. For bedrid-den patients in hospitals, it is possible to use RFID sensors [41] or barcode labels. To obtain additional information on the occupancy of the individual rooms of an IB, the values from the operational sensors measuring the CO2 concentration (ppm) can be
measured, which are used to control forced ventilation in the building. Building heat-ing, ventilation, and air conditioning (HVAC) systems are considered to be a prime
Fig. 6 Measured waveform of CO2 (ppm) in R104 of SHC (1.2.2014–27.2.2014). (dd.mm.yyyy hh:mm:ss):
tool for energy conservation due to their significant contribution to commercial build-ings’ energy consumption. For example, Yang evaluates occupancy modeling using twelve ambient sensor variables with results which demonstrate that 20% of gas and 18% of electricity could be saved effectively if occupancy-based demand-response HVAC control is implemented in IB [42]. In energy efficiency analysis, user behavior detection related to the dynamic demands of energy is a critical aspect of support-ing the intelligent control scheme of a Buildsupport-ing Management System. Accordsupport-ing to Zhao, occupancy of anomalous user behavior tends to be figured out from multiple time-series records of occupancy [43]. For prediction and subsequent classification of automatic human activity recognition (AR), the regression method of Artifical Neural Networks (ANN), Hidden Markov models [43–45] decision trees method [46], meth-ods using Bayesian networks [47], Conditional Random Fields (CRF) or a sequential
Markov Logic Network (MLN) [48] can be used.
Biswas described, that the artificial neural network has emerged as a key method to address the issue of nonlinearity of building energy data and the robust calcula-tion of large and dynamic data [49]. Pantazaras used incorporating CO2
concentra-tion as a factor in predictive models may unlock further optimizaconcentra-tion opportunities in controller applications, especially in buildings with highly varied occupancy, such as institutional buildings with the results, which suggest that there is indeed potential for at least short-term prediction using a very simple identification procedure [50]. Leung presents an investigation into the use of occupancy space electrical power demand to mimic occupants’ activities in building cooling load prediction by intel-ligent approach, where the effect of individual behaviour on cooling load demand is less significant at building level than at office level and the proposed cooling demand prediction approach is able to predict daily peak loads satisfactory which would be useful for system dimensioning. [51]. Moon was developed temperature control algo-rithm to apply a setback temperature predictively for the cooling system of a resi-dential building during occupied periods by residents, where Levenberg-Marquart training method was employed for model training [52]. The purpose of Mba work was to apply the artificial neural network (ANNs) with Levenberg–Marquardt algorithm for an hourly prediction, 24-672 h in advance of (IT) and (IH) in buildings found in hot humid region with results, which testified that ANN can be used for hourly IT and IH prediction [53]. Using the neural network to predict the energy consumption of the building resulted in some shortcomings, which were solved of Dinghao’s pro-posed model (a new algorithm which combined genetic algorithm with the Leven-berg–Marquardt algorithm) for qualified of predict short-term energy consumption in buildings accurately and efficiently [54], [55]. Yuce presents an ANN approach to predict energy consumption and thermal comfort level of an indoor swimming pool with ANN (Levenberg–Marquardt algorithm) based prediction approach for a spe-cific HVAC system [56].
Based on the above-described scientific works, it was selected ANN with the
Leven-berg–Marquardt algorithm for prediction of measured waveform CO2 from measured
Table
1
S
ensors in the smar
t home: summar
y of main char
ac teristics r ele van t t o ac tivit y det ec tion [ 40 ] Sensor M easur emen t Da ta f orma t A dv an tage D isadv an tage Video cameras Human ac tions/en vir onmental stat e Image , video Pr ecise inf or mation Pr ivac y issues
, computational expense
, acceptabilit y issues M icr ophones Voice det ec
tion, other sounds
A
udio
Cer
tain and r
ich inf
or
mation about sound
Implementation difficult
y and high computa
-tion cost, pot
ential acceptabilit y issues Simple binar y sensors User –objec t int erac tion det ec tion mo ve
-ments and location identification
Cat egor ical Lo w-cost, lo w maint enance
, easy t
o install
and r
eplace
, inexpensiv
e, less pr
ivac
y-sensitivit
y, minimal computation r
equir
e-ments
Pr
ovide simple and limit
ed inf
or
mation f
or
composit
e and multi-user ac
tivit y monit or -ing RFID Objec
t and user identification
Cat
egor
ical
Small siz
e and lo
w cost
Reader collision and tag collision, range limit
ed
Temperatur
e sensor
, light sensor
, humidit y sensor En vir onmental paramet ers Time ser ies Intuitiv e monit or
ing of en
vir onment and objec ts Limit ed inf or mation f or ac tivit y monit or ing W earable iner tial sensors A cceleration or ientation Time ser ies Compac t siz e, lo
w cost, non-intrusiv
eness
,
high accurac
y, unique identification of
users
, user
’s location easily track
ed
.
Cumbersome and uncomf
or
table f
eeling
,
cannot pr
ovide sufficient cont
ex t inf or ma -tion W
earable vital sig
ns sensors Vital sig ns Analog sig nal Sensitiv e t
o slight change in vital sig
ns
monit
or
ing mor
e accurat
e in emer
genc y situation det ec ting Reliabilit y constraints , secur
ity issues and
uncomf
or
table f
eeling f
or long-time sk
in
Preparation of experimental data
Within experiments, we used the BACnet technology (Building Automation and Controls Network) for the operational control of HVAC in SHC. To determine the occupancy of each room (coming time, time of leaving, the number of people) in
SHC, are in this article uses indirect measurements of CO2 concentration (ppm)
using operational sensors CO2 (ppm) [(sensor QPA 2062), (within 0 and 2.000 ppm,
accuracy ±50 ppm)] In this part of the article is described how to determine the appropriate method of prediction of the CO2 concentration from the measured
val-ues of the indoor temperature T (°C) in a SHC room [(sensor QPA 2062) (within 0
and 50 °C/−35 to 35 °C, accuracy ±1 K)], indoor rH (%) [(sensor QPA 2062), (within
0 and 100%, accuracy ±5%)] and outdoor temperature T (°C) ((sensor AP 257/22,
measuring range −30…+80 °C, resolution: 0.1 °C), the sensor is implemented in KNX technology) using the gradient algorithm of the back-propagation of error for the adaptation of the multilayer feedforward ANN using prediction—the LMA method [57, 58], (Fig. 7).
For the actual experiments the measured values of Ti, T0, rH and CO2 in room R104 in
the period 1.2.2014–27.2.2014 (transition winter–spring) and 1.6.2015–30.6.2015 (tran-sition spring–summer) were used:
Training and test dataset
The goal of testing is to verify whether the results achieved from the training data can be verified in the future for other input data files. The training set is created directly from the measured values of temperature Ti (°C), relative humidity rH (%) in room R104 and outdoor temperature To (°C). The output (target) dataset is created by the measured val-ues of CO2 (ppm). The measured values in February 2014 and June 2015 were selected.
For February 2014 this represented 38,880 samples with the following distribution:
• Training—70%, 27,216 samples, which are presented to the network during training, and the network is adjusted according to its error.
• Validation—15%, 5832 samples, which are used to measure network generalization, and to halt training when generalization stops improving.
• Testing—15%, 5832 samples, which have no effect on training and so provide an independent measure of network performance during and after training.
For June 2015 this represented 41,760 samples with the following distribution:
• Training—70%, 29,232 samples.
• Validation—15%, 6264 samples.
• Testing—15%, 6264 samples.
The data is sampled in 1 min intervals. Before the actual learning, the training dataset was normalized using the min–max method.
where min(x1···xi) is the smallest value in the set (x1···xi) and max(x1···xi) is the largest
value in the set (x1···xi).
The min–max method was used to eliminate possible errors during ANN LMA train-ing. After training the neural network and simulation with training or test data, the out-put from the neural network had to be denormalized according to the original range of the training input values. The ANN training process is illustrated in Fig. 8. Figure 9 shows the process of measuring and processing data in connection with the BACnet technology used in the SHC.
For the actual testing, normalized measured data was used for precisely defined time intervals of short experiments per 1000 samples from days:
• 16.6.2015 (6:40–23:18),
• 18.2.2014 (7:00–23:40),
• 7.2.2017 (12:29)–8.2.2017 (5:09).
The test set is created directly from the measured values of temperature Ti (°C), rela-tive humidity rH (%) in room R104 and outdoor temperature To (°C). The output (tar-get) dataset is created by the measured values of CO2 (ppm). The data was tested on
trained ANN (1.6.2015–30.6.2015) and ANN (1.2.2014–27.2.2014). That means that for the ANN LMA trained on measured values from June 2015 (Table 2) the test data was the measured values in the period 16.6.2015 (6:40–23:20), (Table 6), and for the ANN
(1)
′ xi=
xi−min(x1···xi)
max(x1···xi)−min(x1···xi)
,
LMA trained on measured values from February 2014 (Table 4) the test data was the measured values in the period 18.2.2014 (7:00–23:40), (Table 7).
Choice of diagnostic tools, their application and evaluation
The quality of diagnostic tools that are presented by Artificial Intelligence methods can be specified by many different requirements. Quality is usually measured using mean squared error (MSE), mean absolute percentage error (MAPE), and root mean squared error (RMSE). The mean squared error (MSE) is given by the equation:
(2)
MSE= 1 n
n
i=1
yi−y∗i
2 ,
Fig. 9 Simplified block scheme of utilized technology in SHC with prediction of CO2
Table 2 Comparison of learning quality ANN (LMA), [1.6.2015–30.6.2015 (data normal-ized)]
Number of neurons (−) Time t (hh:mm:ss) MSE training (ppm) R training (−)
10 0:02:19 1.155 × 10⁻⁴ 0.804
50 0:03:29 7.762 × 10⁻⁴ 0.874
100 0:22:47 5.557 × 10⁻⁴ 0.910
150 0:09:36 5.325 × 10⁻⁴ 0.917
200 0:23:09 4.207 × 10⁻⁴ 0.932
250 1:06:52 3.256 × 10⁻⁴ 0.940
300 0:15:00 4.850 × 10⁻⁴ 0.918
350 0:25:13 3.338 × 10⁻⁴ 0.944
400 0:43:13 2.427 × 10⁻⁴ 0.963
450 0:47:44 2.392 × 10⁻⁴ 0.96
500 1:05:09 2.317 × 10⁻⁴ 0.963
550 0:43:11 2.713 × 10⁻⁴ 0.958
600 1:20:51 2.176 × 10⁻⁴ 0.967
650 0:56:27 2.477 × 10⁻⁴ 0.96
where n is the number of measurements, yi represents the measured data (responses) of
a real system and yi* is the model response.
The average absolute percentage error (MAPE) is calculated from relation
The root mean squared error (RMSE) is calculated from relation
The force of (linear) dependence between two measured non-electrical quantities has been evaluated by means of the value of the Pearson´s correlation coefficient
The correlation coefficient Rx,y can take values from the closed interval 〈−1, +1〉. The
more the absolute value of the correlation coefficient approaches 1, the stronger the dependence of the random quantities is.
Backpropagation algorithm
The backpropagation algorithm is a gradient algorithm with which multilayer forward networks are adapted. Backpropagation is like a teacher’s instruction when the calcu-lated output of the network is compared to the desired output. Subsequently, with the backward propagation of the signal, the weights are adjusted so that the net responds with the desired output to the pattern. It has been shown that such networks are able to approximate any continuous function with the required accuracy and therefore have a wide use, for example, for regression analysis [59]. In general, backpropagation is the most widely used algorithm in the field of neural networks in general. It is used in approximately 80–90% of applications [60]. The backpropagation optimization process is used for forward neural networks with hidden layers and is designed to classify data that is generally not linearly separable [61].
The learning process (Fig. 8) of backpropagation can be divided into four main parts [88]:
1. Initialization: All weights in the network are set to random values within the recom-mended range 〈−0.3; 0.3〉.
2. Pattern introduction: A pattern from the training set is selected and presented to the input of the neuron network. The output of the individual neurons is then calculated by the layers from the input to the network outputs.
3. Comparison: In this step the energy is calculated from the equation
(3)
MAPE= 1 n
n
i=1
yi−y∗i
y∗i
(4)
RMSE=√MSE.
(5)
Rx,y=
Σ (xi− ¯x)yi− ¯y
Σ (xi− ¯x)2Σ
yi− ¯y
2 .
(6)
E= 1
2 n
i=1
yi−di 2
which is to be minimized by the gradient method. The increment vector is calculated from the equation
The increment vector is valid for all weights in the ANN. The weights are adjusted by a λ multiple of a negative gradient value because the gradient is oriented towards the apex (to the maximum).
4. Error backpropagation and weight modification (in hidden layers): Weights and thresholds in hidden layers are calculated in a similar way to the output layer weights. The error backpropagation and weight modification step is calculated for all hidden layers of the neural network away from the output layer to the input layer. In addition to the basic replication algorithm, there are a number of modifications that modify the weight and threshold values of the neurons in different ways. Algorithms can be divided into two groups. The first group includes algorithms that use variability of momentum or learning step, while the second group is based on standard optimi-zation techniques such as Newton’s method, Gauss–Newton method, Levenberg– Marquardt method and others.
Levenberg–Marquardt algorithm (LMA)
LMA algorithm was designed to approach second-order training speed without hav-ing to compute the Hessian matrix. When the performance function has the form of a sum of squares (as is typical in training feedforward networks), then the Hessian matrix can be approximated as and the gradient can be computed as where is the Jacobian matrix that contains first derivatives of the network errors with respect to the weights and biases, and e is a vector of network errors. The Jacobian matrix can be computed through a standard backpropagation technique that is much less complex than comput-ing the Hessian matrix. The Levenberg–Marquardt algorithm uses this approximation to the Hessian matrix in the following Newton-like update: when the scalar λ is zero, this is just Newton’s method, using the approximate Hessian matrix. When λ is large, this becomes gradient descent with a small step size. Newton’s method is faster and more accurate near an error minimum, so the aim is to shift towards Newton’s method as quickly as possible. Thus, λ is decreased after each successful step (reduction in formance function) and is increased only when a tentative step would increase the per-formance function. In this way, the perper-formance function will always be reduced at each iteration of the algorithm [62].
The LMA adaptively changes when the parameter upgrades between the gradient descent updating and the Gauss–Newton updating,
where the small values of the algorithmic parameter λ cause a Gauss–Newton ing and the large values of the algorithmic parameter λ cause a gradient descent updat-ing. The parameter λ is initiated to be large so that the first updates represent small steps in the steepest descent direction. If any iteration results in a worse approximation (x2(p+hlm) >x2(p)), then λ is increased. In other words, as the solution improves, λ is
(7)
w¯ = −· ∇E.
(8)
JTWJ+I
hlm=JTW
y− ˆy
decreased, the LMA method approaches the Gauss–Newton method, and the solution distinctively speeds up to the local minimum. In Marquardt´s updated relationship [57]:
The values of λ are normalized to the values of JT. The Levenberg–Marquardt’s
algo-rithm was implemented in the MATLAB function.
Implementation of the practical part
Practical procedure of ANN implementation and learning along with the verification of the learned ANN LMA on test data is performed in the following steps:
1. Step—measurement of non-electrical quantities Ti, T0, rH and CO2 in room R104 in
the period 1.2.2014–27.2.2014 (transition winter–spring), 1.6.2015–30.6.2015 (tran-sition spring–summer), 7.2.2015 using sensors connected to the BACnet technology in the SHC.
2. Data preprocessing–normalization. 3. Design of the prediction system. 4. Implementation of ANN, LMA.
5. Training of ANN, LMA for neuron counts in the range 10–700, measurement of time t(s) of ANN learning, calculation of MSE and correlation coefficient R.
6. Prediction of test data–generalization. 7. Graphic view of results.
8. Calculation of RMSE, MAPE, correlation coefficient R. 9. Evaluation of achieved results.
Results with ANN (1.6.2015–30.6. 2015)
To objectively assess the prediction quality (criterion for the LMA optimization), we used parameters of RMSE (Room Mean Square Error) and correlative coefficients (R). We continually configured the LMA values regarding numbers of neurons N from 10 to 700. We also assessed the time necessary for N to learn to cooperate with LMA algorithm. The minimum value of MSE = 2.176 × 10⁻⁴ was calculated for ANN with
the LMA where the configured number of neurons was 600 and the learning time was 1:20:51 (Table 2).
The learning time of ANN LMA is not directly proportional to the number of config-ured neurons. For the network of ANN LMA with 600 neurons, we carried out a pre-diction of CO2 based on the measured temperature Ti, To and relative air humidity rH
obtained from June 1, 2015 to 30 June 2015. Figure 10 shows the period (14 days) from 4 June 2015 to 18 June 2015 to clarify the discussed issue.
Within the realized experiment, optimal input parameters ANN for the number of neurons (600) of LMA were found on the basis of MSE parameters (2.176 × 10⁻⁴),
R-taining (0.967) and training time t (1:20: 51), (Table 2).
With the use of a trained network ANN, we carried out strictly controlled short-term experiment (7 h), (Fig. 11), without the use of CO2 sensor (according to a prepared
sce-nario) under the following conditions that had to be fulfilled: SHC in a passive standard,
(9)
JTWJ+diag(JTWJ)
hlm=JTW
y− ˆy
closed windows and doors during t1 time period, switched off air-conditioning and
heat-ing, precisely defined coming and presence in the room t1(s) and leaving t3(s) of subjects,
etc. (Fig. 11).
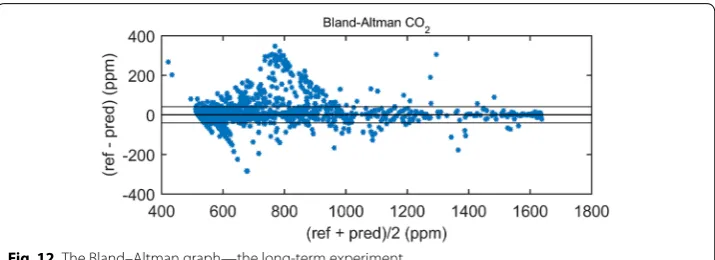
In order to compare the differences between the reference and predicted signal, the Bland–Altman plot was utilized [63]. The differences between the predicted signal and the reference traces, x1 – x2, are plotted against the average, (x1 + x2)/2. The
reproduci-bility is considered to be good if 95% of the results lie within a ±1.96 SD (standard
devia-tion) range.
Figure 12 shows the Bland–Altman graph for the verification of prediction quality ANN LMA (600) neurons in the long-term experiment (Fig. 10), (4 June 2015–18 June 2015). For the entire data set, 98.06% of the values lie within the ±1.96 SD range for the determination of human detection.
Fig. 10 Long-term experiment. A The measurement of CO2 concentration in a room of SHC—ZOOM (1 coming, 2 leaving, 3 coming, 4 leaving, 5 coming, 6 leaving, 7 coming, 8 leaving), B prediction error during transient phase—coming of a subject into SHC, C coming of a subject into the room of SHC, D prediction error during the transient phase—coming of a subject into SHC, E leaving of a subject from a room of SHC, F coming of a subject into a room of SHC, G leaving of subjects from a room of SHC, H coming, I leaving). Figure 12 shows the prediction and measured concentration of CO2 (ppm) within the short-term experiment (16 June 2015)
The result of the Bland–Altman graph in Fig. 13 shows a higher number of outlying measurements in intervals from 600 to 800 (ppm) and partially in the interval from 1300 to 1400 (ppm), which is caused by changes (transient phases) within predictions in con-nection with the coming and leaving of a subject into a room of SHC. The majority of values are shown in the interval from 500 to 600 (ppm), which demonstrates the absence of subjects in a monitored space. Figure 13 shows the Bland–Altman graph for the veri-fication of prediction quality of ANN LMA (600) neurons in the short-term experiment (Fig. 11), (16 June 2015). For the entire data set, 96.00% of the values lie within the ±1.96 SD range for the determination of human detection.
Results with ANN (1.2.2014–27.2. 2014)
Table 3 shows the calculated values of MAPE, RMSE and R for predicted courses of
CO2 on trained ANN LMA (1.6.2015–30.6.2015) for neuron counts in range 10–700.
Comparison with Table 2 confirms that the best calculated parameters MAPE (81.52%), RMSE (0.0165), R coefficient (0.96), (Table 3) for predicted courses of CO2 are for
trained ANN LMA with 600 neurons.
Table 4 shows the measured and calculated values of MSE, correlation coefficient R, time t(s) of learning process of ANN LMA (for neuron counts in the range 10–700) for measured values Ti, T0, rH and CO2 in room R104 of the SHC in the period
1.2.2014–27.2.2014. ANN LMA exhibited the best learning parameters for 500 neurons (MSE = 6.188.10–4, R = 0.950).
Table 5 shows the calculated values of MAPE, RMSE and R for predicted courses of
CO2 on trained ANN LMA (1.6.2015–30.6.2015) for neuron counts in range 10–700.
Fig. 12 The Bland–Altman graph—the long-term experiment
Comparison with Table 4 confirmed that the best calculated parameters of MAPE (70.89%), RMSE (0.025), R coefficient (0.95), (Table 5) for predicted courses of CO2 are
for trained ANN LMA with 500 neurons.
Results—testing of ANN LMA
For trained ANN LMA in the period 1.6.2015–30.6.2015 (Table 2) we used the
meas-ured data in the period 16.6.2015 (6:40–23:18), (1000 samples) for testing within a short experiment. The results are in Table 6.
Table 3 Comparison of prediction quality ANN (LMA) [1.6.2015–30.6.2015 (data normal-ized)], with tested data from interval [1.6.2015–30.6.2015 (data normalized)]
Number of neurons (−) RMSE training (ppm) R training (−)
10 0.033 0.8
50 0.028 0.87
100 0.023 0.91
150 0.023 0.91
200 0.02 0.93
250 0.018 0.95
300 0.022 0.92
350 0.019 0.94
400 0.0168 0.96
450 0.017 0.96
500 0.019 0.95
550 0.018 0.95
600 0.0165 0.96
650 0.018 0.95
700 0.017 0.96
Table 4 Comparison of learning quality ANN (LMA) [1.2.2014–27.2.2014 (data normal-ized)]
Number of neurons (−) Time t (hh:mm:ss) MSE training (ppm) R training (−)
10 0:00:46 2.219 × 10⁻³ 0.79
50 0:06:48 1.183 × 10⁻³ 0.90
100 0:05:24 1.144 × 10⁻³ 0.90
150 0:56:29 7.762 × 10⁻⁴ 0.93
200 0:24:45 8.406 × 10⁻⁴ 0.93
250 0:21:47 8.487 × 10⁻⁴ 0.93
300 0:35:36 7.185 × 10⁻⁴ 0.94
350 0:45:14 6.739 × 10⁻⁴ 0.94
400 1:09:55 6.811 × 10⁻⁴ 0.94
450 1:06:52 7.256 × 10⁻⁴ 0.94
500 1:32:14 6.188 × 10⁻⁴ 0.95
550 0:18:42 9.006 × 10⁻⁴ 0.92
600 1:09:26 6.761 × 10⁻⁴ 0.94
650 0:31:09 7.525 × 10⁻⁴ 0.94
Comparison with Table 2 shows that for calculated parameters RMSE (0.02), R coef-ficient (0.93), (Table 6) for predicted courses of CO2 are the best for trained ANN LMA
(in the period 1.6.2015–30.6.2015) with 500 neurons.
For trained ANN LMA in the period 1.2.2014–27.2.2014 (Table 3) we used the meas-ured data in the period 18.2.2014 (7:00–23:40), (1000 samples) for testing within a short experiment. The results are in Table 7.
Comparison with Table 4 shows that for calculated parameters RMSE (0.049), R coef-ficient (0.67), (Table 7) for predicted courses of CO2 are the best for trained ANN LMA
(in the period 1.2.2014–27.2.2014) with 300 neurons.
Table 5 Comparison of prediction quality ANN (LMA) [1.2.2014–27.2.2014 (data normal-ized)] with tested data from interval [1.2.2014–27.2.2014 (data normalnormal-ized)]
Number of neurons (−) RMSE training (ppm) R training (−)
10 0.047 0.80
50 0.034 0.90
100 0.033 0.90
150 0.028 0.93
200 0.029 0.93
250 0.029 0.93
300 0.028 0.93
350 0.025 0.95
400 0.026 0.94
450 0.027 0.94
500 0.025 0.95
550 0.030 0.92
600 0.026 0.94
650 0.028 0.94
700 0.027 0.94
Table 6 Comparison of prediction quality ANN (LMA) [1.6.2015–30.6.2015 (data normal-ized)] with tested data [16.6.2015 (6:40–23:18)]
Number of neurons (−) RMSE training (ppm) R training (−)
10 0.054 0.67
50 0.047 0.59
100 0.027 0.88
150 0.029 0.85
200 0.024 0.90
250 0.022 0.91
300 0.025 0.89
350 0.024 0.90
400 0.021 0.92
450 0.021 0.92
500 0.020 0.93
550 0.023 0.90
600 0.021 0.92
650 0.021 0.92
Discussion
The second part of the paper describes and experimentally documents the procedure for the use of a multilayer forward ANN to predict the course of CO2 concentration from the
measured Ti (°C), relative humidity rH (%) in the interior of the selected room R104 of the SHC and from the outdoor temperature To (°C), with the gradient error propagation algorithm using the Levenberg–Marquardt predictive method (LMA). For the classifi-cation of prediction quality, a correlation analysis (correlation coefficient R), calculated RMSE (Root Mean Square Error) and MAPE (Mean Absolute Percent Error) and Black-Altman method were used. The best results were achieved by ANN LMA trained on the measured values in the period 1.6.2015–30.6.2015. The achieved results approached R >95% for 600 neurons (Tables 2, 3), or during the actual test R = 0.93 for 500 neurons (Table 6). ANN LMA, trained for measured values in the period (1.2.2015–27.2.2015), achieved comparable results (R = 0.95) for the number of neurons 500 (Tables 4, 5). The results of prediction testing of ANN LMA (1.2.2015–27.2.2015) however, were not as successful (R = 0.67) for 300 neurons (Table 7).
Third part—implementation voice communication in SHC with KNX technology
For voice communication with the control system aimed at control of operating techni-cal functions and electric appliances [64, 65, 66, 67–69] in SHC and in intelligent build-ings, it is necessary to provide for an application with a visualization platform employing the existing high-quality speech command recognizer with high efficiency of recogni-tion in the real SHC environment with additive noise, which can be used to support the independent living of seniors in their home environment. Brooks confirmed that user—centered design and the use of technology—Smart furniture with voice interac-tion, which can be used to enhance daily living [70]. Hamill describes the development and testing of an automated, hands-free, dialogue-based speech recognition interface for personal emergency response systems—PERS prototype with the mounted microphone
Table 7 Comparison of prediction quality ANN (LMA) [1.2.2014–27.2.2014 (data normal-ized)] with tested data [18.2.2014 (7:00–23:40)]
Number of neurons (−) RMSE training (ppm) R training (−)
10 0.076 0.10
50 0.064 0.39
100 0.061 0.40
150 0.051 0.61
200 0.050 0.63
250 0.053 0.59
300 0.049 0.67
350 0.047 0.65
400 0.047 0.66
450 0.050 0.61
500 0.047 0.65
550 0.053 0.59
600 0.047 0.66
650 0.050 0.63
array, an open-source automatic speech recognition engine, and a ‘yes’ and ‘no’ response dialog modeled after an existing call center protocol [71]. Hossain proposes smart home health care system for the realization of smart cities to full fill the needs of elderly peo-ple, where a patient’s condition is monitored by using multimodal inputs, specifically, speech and video. Video cameras and microphones are installed in the SHC; these sen-sors constantly capture video and speech of the patient and transmit them to a dedi-cated cloud [72]. Johnson in the study, where was described older adults’ perceptions and reactions to SHC technologies/applications at the Gator-Tech SHC has followed results: Overall, most participants responded favorably toward the smart door and voice activation than any other smart technology/application [73]. Portet was aiming at test-ing the four important aspects in SHC: voice control, communication with the outside world, domotics system interruption human activity and electronic agenda. Portet said that voice interface seemed to have great potential to ease the daily life of the elderly and weak people and would be better received than the more intrusive solution [74]. Tang was describing how they implemented augmented reality of voice control & web server to control SHC and electrical appliances for elderlies and disabled [75]. Vanus designed [76] and tested [77] the voice communication with the control system in SHC. Zhuang et al. [78] described a fall detection system to distinguish noise coming from falls from other noise in the smart home environment. In their system, they only use a far-field microphone to identify various sounds. Then a Gaussian Mixture Models (GMM) Super vector is used to model each fall or noise segment by applying Euclidean distance to measure the pairwise difference between audio segments. A Support Vector Machine built on a GMM Super vector kernel is used to classify audio segments into falls and various types of noise [79].
In this part of the paper is described the practical implementation of the newly devel-oped visualization desktop application HESTIA, type Universal Windows Platform (UWP), for Windows 10 implemented on the wooden house (SHC) at VŠB-TU Ostrava for voice control of operating technical functions by means of the KNX technology with detection of occupancy of the room R104 using CO2 sensor.
Implementation of the created HESTIA visualization application
The practical implementation is dedicated to the implementation of own created appli-cation Hestia 10 which allows the voice control of operating and technical functions in the SHC fitted with KNX bus system. The application supports voice control and a few settings of the user environment. Universal Windows Platform technology and C# pro-gramming language were selected to develop the application. The implementation was based on the MVVM (Model, View a ViewModel) architectural pattern which is briefly described below.
HESTIA application description
type, the screen depicts a control which may include several functions. Another impor-tant screen serves for setting the application. Here, the users can adjust some application parameters in order to adapt it to their individual needs. It is possible to set the language (Czech or English). Furthermore, the users can choose from two color schemes, light and dark. The last setting allows them to change the font size; this facilitates the work with the application mostly for seniors. There are three font sizes to choose from—small, medium and large. A prerequisite for the proper functioning of the application is config-uration. It runs on a separate screen which can be accessed from the application settings. For the purpose of better clarity, a list of rooms in the building is created in the first instance. A list of devices for each room is created afterwards. When creating devices, it is necessary to select the device type and enter at least one group address of some of the possible functions. Configuration should be performed by a person familiar with the KNX bus system and specific bus programming. It is necessary to know group addresses and device types occurring in the topology (Fig. 14).
Without this knowledge, it is not possible to provide control functionality. The appli-cation consists of several components (Fig. 15); the basic components are Hestia.View, Hestia.Model and Hestia.ViewModel, forming the frame of the MVVM architectural pattern.
This is described hereinafter. Another component is KNXLib.Portable. It is a freely available library for communication with the KNX bus. Hestia.Speech provides voice recognition logic and passes the information further in the application. Hestia. Common
is a shared component that contains global variables and methods used across the application.
Voice control
For speech recognition, the SW tool of Microsoft Speech Platform SDK 11 is employed. The voice recognition function consists in the conversion of the input sound track to a text by the Speech Recognition Engine. The sound input is divided into segments pro-cessed as a speech signal and subsequently converted to digital form. The input data adapted in this manner is further evaluated by means of three databases—(a) Acous-tic model, (b) Lexicon, and (c) Language model. The acousAcous-tic model, representing the acoustic language expression, can be adapted to recognize specific speech traits of the individual users. The lexicon contains a large number of words in the given language, providing information on their pronunciation. The language model provides information on the ways in which words can be combined. The sequence diagram in Fig. 16 describes a situation where the user vocally enters a group address in the configuration tool.
Description of voice control implementation in SHC
For the implementation of voice control in SHC at VŠB–Technical University of Ostrava, where KNX and BACnet technologies are used to control the operating and technical functions, while interoperability between technologies is ensured. To control lighting, blinds, and sockets, KNX modules are used (Fig. 17).
For communication with the KNX bus, it is necessary to connect KNXnet/IP router to the bus; the router allows sending information between the device and the bus using the IP protocol. In the case of wireless communication, the KNXnet/IP router must be con-nected to a wireless router and the device (computer, mobile phone) used for request-ing the communication with the bus must be connected to the same network as the KNXnet/IP router (Fig. 18).
Adaptation to smartphone
The HESTIA visualization application created for Windows 10 shares a common code. The application with a PC-connected microphone is not suitable for the speaker’s mobil-ity within SHC. Therefore, the user interface must be adapted to be displayed on various devices (mobile appliances). This can be achieved by using the VisualStateManager class. The screen of the mobile device used to control the building is composed on the left part with a list of rooms and the right part with details of the individual rooms including the device list. If the width of a window with the running application is reduced to under
Fig. 16 Sequence diagram describing processing of a voice command
720 pixels, only a room list is displayed; after clicking on a specific room, the user is redi-rected to a new screen with the room details. This functionality is implemented by the VisualStateManager element defined in ControlView.xaml. Two states are created in it by means of the VisualState element—the default and reduced states. By means of the Adap-tiveTrigger element, conditions of using the individual states can be defined; by means of the Setter element, it is possible to change the values of existing elements and their attributes in the XAML file. VisualStateManager (Listing 1) can respond to a change both in the width and in the height.
<VisualStateManager.VisualStateGroups>
<VisualStateGroup x:Name="States" CurrentStateChanged=" States_CurrentStateChanged">
<VisualState x:Name="Default"> <VisualState.StateTriggers>
<AdaptiveTrigger MinWindowWidth="720" />
</VisualState.StateTriggers>
</VisualState>
<VisualState x:Name="Reduced"> <VisualState.StateTriggers>
<AdaptiveTrigger MinWindowWidth="0"/>
</VisualState.StateTriggers>
<VisualState.Setters>
<Setter Target="Master.Width" Value="*" /> <Setter Target="Detail.Width" Value="0" />
<Setter Target="RoomListView.SelectionMode" Value="None" />
</VisualState.Setters>
</VisualState>
</VisualStateGroup>
</VisualStateManager.VisualStateGroups>
Listing 1 VisualStateManager definitions.
Therefore, it is possible to use in the AdaptiveTrigger element either the MinWindow-Width or MinWindowHeight element. For a window width over 720 pixels, the screen appearance changes according to the attributes set in the VisualState element called Default. For a window width of 0–720 pixels, on the contrary, in the VisualState element
called Reduced. If the application is displayed in a device with a width lower than 720 pixels or if the application window has been reduced, the width of the left part of the screen with the room listing is set to the full window width. By contrast, the width of the right part with the room detail listing the devices is set to zero value, thus not being dis-played at all. If a room is selected at full display, that is, over 720 pixels, no room listing is displayed if the window is reduced, but the details of the room selected. In this case, it is necessary to change the currently displayed ControlView in the ControlDetailView directly. This must be programmed explicitly, which can be achieved from code-behind upon call of the CurrentStateChanged event. This can be called if the conditions of an adaptive trigger are met.
Testing the visualization part of the HESTIA application
The application was tested on the wooden house in Room 104 of SHC. The KNX technol-ogy is used here to control lighting and blinds, and switch off the power supply of sockets. During the test of the control of operating-technical functions on the wooden house at VŠB-TU Ostrava, the functions of switching on/off the lighting and dimming were tested. For control of the blinds, the control of the upward/downward movement of the blinds, movement of the blinds to a certain height and change in the inclination of the blind slats were tested. In the case of testing the lighting switch-on/off, the Boolean values of true/ false were sent to the group address of the KNX switching actuator. Sending these values can be activated by pushing the on/off button on the control screen. These buttons are available at the display of a room containing a device with a group address entered for this function. When the on button was pushed, a telegram with the target group address and the true value was sent to the bus. Overhearing the telegram, the actuator with this group address switched on the corresponding light in the SHC room. Switch-off of the lights was tested similarly; the false value was sent to the bus, whereupon the light went out. For the dimming function (designated as dimming object in ETS), the control ele-ments include buttons marked minus (−) and plus (+). If the plus button is pushed, a positive predefined value is sent to the bus and the lighting brightness increases in SHC. If the minus button is pushed, a negative predefined value is sent to the dimming actuator group address, whereupon the lighting brightness decreases. In the case of verification of the upward/downward movement of the blinds (designated as movement object for man-ual mode in ETS), the buttons for upward or downward movement were pushed in the control application section. The same actions occurred on the bus as in the case of switch-ing the lights on/off. If the blinds are moved to a certain height (designated as height posi-tion in manual mode in ETS) or inclinaposi-tion of the slats is adjusted (designated as slat in manual mode in ETS), a value within the range of 0–100% is entered in the application. This value is converted to a number within the interval of 0–255; subsequently, this data is sent to the address configured for the given function. All of the control functions pro-vided by the application were tested with one hundred per cent reliability.
Voice control testing
follows (Fig. 19): “Go to control page”, “Select room 0–9”, “Select device 0–9”, “Light on”, “Light off”, “Blind up”, “Blind down”, “Change blind height”, “Write height value 0–100”. During application testing, influence of the additive noise in the real environment took effect in SHC. The results indicated below of the efficiency of recognition of voice com-mands (Fig. 19) fall within the range from 71 to 95%.
The sources of additive noise in SHC include electric appliances commonly used in the household, such as radio, TV set, refrigerator, fume hood, vacuum cleaners, noise from the fan, air conditioning, etc., as well as cooking, children’s noise, flushing of toilets, door slamming, people talking, outdoor traffic noise in the town, etc. At present, scientific workplaces worldwide are trying to solve the implementation of suitable platforms for voice control of automation in the real environment of intelligent buildings [80–83] with the use of suitable methods of additive noise suppression in the real SHC environment. The actual design and solution by the authors of additive noise suppression in the real SHC environment by the implementation of adaptive algorithms and Soft Computing methods in conformity with the block diagram in Fig. 18 are indicated in publications [84–87, 23].
Experimental part
In the last part of the paper, an experiment is conducted to determine indirect detection of the presence of persons in the monitored area of the SHC (room R104) by measuring the concentration of CO2 in the monitored area of R104 of the SHC in combination with
a microphone for voice control of operational–technical functions in the SHC using the HESTIA visual desktop application on 7.2.2017 from 12:30 to 15:00. Arrival in the room was recorded on 7.2.2017 at 12:45:00 on the basis of an increase in CO2 concentration
(Fig. 20). Departure from the room was recorded at 14:22:00 on the basis of evaluation of a decrease in CO2 concentration (Fig. 20).
Figure 21 shows the course of the measured values of rH and T in the interior of R104. Figure 22 shows the course of predicted values of CO2 with ANN LMA. From the
pre-dicted course of CO2, it is possible to determine arrival in the room (7.2.2017 at 12:45:00)
based on an increase in concentration of the predicted course of CO2. Departure from
the room was recorded at 14:22:00 on the basis of evaluation of a decrease in CO2
con-centration (Fig. 20).
Figure 23 shows controlling of blinds with voice commands in room R104 (Figs. 3, 17) with indicated and confirmed times of arrival and departure in/from room R104.
Fig. 20 The course of the measured values of CO2 (ppm) in room R104 during the test of voice-controlled operational–technical functions (blinds, lighting)
Fig. 21 The course of the measured values of rH (%) and T (°C) in room R 104 during the test of voice-con-trolled operational–technical functions (blinds, lighting)
Figure 24 shows controlling of lighting with voice commands in room R104 (Figs. 3, 17) with indicated and confirmed times of arrival and departure in/from room R104.
Discussion
For detecting the ADL of SHC residents, the microphone for detection speech activity and SW Tool HESTIA for the recognition of voice commands in combination with CO2,
temperature and humidity sensors to detect the presence of people in the SHC moni-tored area has been used in this article part. Furthermore, for detecting ADL, the arti-cle describes the experimental application of speech control of operating and technical functions in SHC with support to indirect monitoring of the presence of people in the area of SHC using CO2 prediction from the measured values of temperature and
humid-ity within the operating measuring of the qualhumid-ity of the indoor environment.
Conclusions
The paper describes new approaches to the technical solution for monitoring the pres-ence of persons in the selected room R104 of the SHC to determine the occupancy of the monitored spaces with the possibility of using the obtained information to determine the ADL using existing technological systems that can be employed in the SHC.
Fig. 23 The course of the monitored positions of slats and blinds based on the execution of voice com-mands (blinds up/down) in room R 104 SB slats position, BP blinds position
The first part of the paper demonstrates the possibility of use of indirect measurement of CO2 concentration (ppm) with operational CO2 sensors (ppm) to obtain a view of
occupancy of R 104 in the SHC (time of arrival, departure, number of persons).
In second part of the paper are described the short-term and long-term experiments verifying a proposed method of LMA implementation for the detection of human pres-ence in a room of SHC with the use of prediction of CO2 concentration from the
meas-ured temperature Ti, To and relative air humidity rH for ANN trained with LMA for 600 neurons with a high degree of correlative coefficient R = 0.967 (Table 2). Experiment
verified the utilization of a method for the detection of a presence of subjects in rooms of SHC for ADL monitoring. With regard to the short-term and long-term experiments (closed windows, switched off forced ventilation, switched off heating, etc.), the pro-posed method is suitable for its utilization in SHC of a passive standard due to a smaller number of changes in the quality of internal environment of SHC (switch-on/switch-off of HVAC, window and door opening). The advantage of the proposed method is a lower investment cost of IB (e.g. office building) equipment regarding sensors for the monitor-ing of a presence of subjects in separate rooms of IB. The disadvantage is an instabil-ity of predictions in transient phases of technology (window opening, HVAC switch-on/ switch-off). To decrease the investment costs connected with the installation of missing sensors for the monitoring of CO2 concentrations in big buildings or in huge residential
dwellings, it is possible to use our proposed method for the prediction of CO2 from the
measurements of temperature Ti, To and air humidity rH, which are very often included
in the standard equipment of IB.
The third part of the paper deals with the development of the application for voice control of operating-technical functions in SHC, equipped with the KNX bus system. The resultant universal application for Windows 10 can be run on both the desktop system version and the mobile version of the Windows 10 operating system. The paper describes utilization of the MVVM architectural pattern for UWP development. The application has incorporated voice control, available in the English language, which is used to facilitate the application control not only for the elderly and handicapped. The application includes several settings facilitating work with the application for both sen-iors and other users. The functionality of the HESTIA application was verified in SHC, where the control of lighting and blinds were tested. In comparison with other works dealing with the creation of the environment for control of an intelligent building, the resultant application can be configured and thus used for any building equipped with the KNX bus system. Voice control implementation is an in-house solution; no third-party software is used here. In this part of the paper, practical verification of the possibility of use of a combination of a CO2 sensor and a microphone for determination of ADL took
place in room R104 of SHC..
Authors’ contributions
JV proposed the system idea, performed the experiments and wrote the manuscript. JV, RM, JN and MF edited the manuscript, designed and implemented the classification methods to adequately evaluate the proposed experiments. JB developed, tested and validated the HESTIA software. JV, PB and JZ critically evaluated the scientific validity of the proposed system and acquired the vital data and performed its final edits. All authors read and approved the final manuscript.
Author details
1 Department of Cybernetics and Biomedical Engineering, Faculty of Electrical Engineering and Computer Science,
VSB-Technical University Ostrava, 17. listopadu 15, 708 33, Ostrava Poruba, Czech Republic. 2 Department of
Telecommunica-tions, Faculty of Electrical Engineering and Computer Science, VSB-Technical University Ostrava, 17. listopadu 15, 708 33, Ostrava Poruba, Czech Republic.
Acknowledgements
This paper has been elaborated in the framework of the projects SP2017/128 of Student Grant System, VSB-TU Ostrava and “Promotion of Development of NEK activities in the field of energy saving energy concept” Reg.n. CZ.01.1.02/0.0/0.0 /15_012/0002294.
Competing interests
The authors declare that they have no competing interests.
Publisher’s Note
Springer Nature remains neutral with regard to jurisdictional claims in published maps and institutional affiliations.
Received: 8 April 2017 Accepted: 14 August 2017
References
1. Debes C, Merentitis A, Sukhanov S, Niessen M et al (2016) Monitoring activities of daily living in smart homes under-standing human behavior. IEEE Signal Process Mag 33(2):81–94
2. Fahad LG, Khan A, Rajarajan M (2015) Activity recognition in smart homes with self verification of assignments. Neurocomputing 149:1286–1298
3. Garcia-Rodriguez C, Martinez-Tomas R, Cuadra-Troncoso JR, Rincon M et al (2015) A simulation tool for monitoring elderly who suffer from disorientation in a smart home. Expert Syst 32(6):676–687
4. Hussain, M, Afzal M, Khan WA, Lee S, et al. (2012) Clinical decision support service for elderly people in smart home environment. In: 2012 12th International conference on control, automation, robotics & vision (ICARCV). pp 678–683 5. Jalal A, Kamal S (2014a) IEEE real-time life logging via a depth silhouette-based human activity recognition system
for smart home services. In: 2014 11th IEEE international conference on advanced video and signal based surveil-lance (AVSS). pp 74–80
6. Jalal A, Sarif N, Kim JT, Kim TS (2013) Human activity recognition via recognized body parts of human depth silhou-ettes for residents monitoring services at smart home. Indoor Built Environ 22(1):271–279
7. Konda KR, Rosani A, Conci N, DE Natale FGB (2015) Smart Camera Reconfiguration in Assisted Home Environments for Elderly Care. In: Agapito L, BRONSTEIN M, Rother C (eds). Computer Vision—Eccv 2014 Workshops pt IV. Springer, Berlin, pp 45-58
8. Magherini T, Fantechi A, Nugent CD, Vicario DE (2013) using temporal logic and model checking in automated recognition of human activities for ambient-assisted living. IEEE Transac Hum Mach Syst 43(6):509–521
9. Medjahed H, Istrate D, Boudy J, Dorizzi B, et al. (2001) Human activities of daily living recognition using fuzzy logic for elderly home monitoring, edn. IEEE 2009, New York. ISBN 978-1-4244-3596-8
10. Mocanu I, Florea AM (2011) A multi-agent system for human activity recognition in smart environments. In: Brazier FMT, Nieuwenhuis K, Pavlin G, Warnier M, Badica C (eds) Intelligent distributed computing, vol 382. Springer, Berlin, pp 291–301
11. Ridi A, Zarkadis N, Gisler C, Hennebert J (2015) Duration models for activity recognition and prediction in build-ings using hidden markov models. In: Proceedbuild-ings of the 2015 IEEE international conference on data science and advanced analytics (IEEE Dsaa 2015). p 26–35
12. Ueda K, Tamai M, Yasumoto K (2015) IEEE a method for recognizing living activities in homes using positioning sensor and power meters. In: 2015 IEEE international conference on pervasive computing and communication workshops (Percom Workshops). p 354–359
13. Vandewiele F, Motamed C (2011) IEEE PhD Forum: A data mining approach for human activity learning in a multi-modal sensor system. In: 2011 Fifth ACM/IEEE international conference on distributed smart cameras (ICDSC). p 2 14. Zolfaghari S, Keyvanpour MR (2016) SARF: Smart activity recognition framework in ambient assisted living. In:
Gan-zha M, Maciaszek L, Paprzycki M (eds). In: Proceedings of the 2016 federated conference on computer science and information systems. IEEE, New York, pp 1435–1443
15. Zolfaghari SR, Zall MR (2016) keyvanpour and ieee sonAr: smart ontology activity recognition framework to fulfill semantic web in smart homes. In: 2016 Second international conference on web research (ICWR). pp 139–144 16. Libal V, Ramabhadran B, Mana N, Pianesi F et al (2009) Multimodal classification of activities of daily living inside


![Table 2 Comparison of learning quality ANN (LMA), [1.6.2015–30.6.2015 (data normal-ized)]](https://thumb-us.123doks.com/thumbv2/123dok_us/845536.1582261/12.595.119.478.86.295/table-comparison-learning-quality-ann-lma-data-normal.webp)