*e-mail: [email protected]
A standards-based framework to foster geospatial data
and process interoperability
Gilberto Zonta Pastorello Jr*, Rodrigo Dias Arruda Senra, Claudia Bauzer Medeiros
Institute of Computing, PO Box 6176, University of Campinas – UNICAMP, 13083-970, Campinas, SP, Brazil
This paper is an extended version of a poster paper44 presented at ACM GIS 2008 Received: September 13, 2008; Accepted: March 1, 2009
Abstract: The quest for interoperability is one of the main driving forces behind international organizations such as OGC and W3C. In parallel, a trend in systems design and development is to break down GIS functionalities into modules that can be composed in an ad hoc manner. This component-driven approach increases flexibility and extensibility. For scientists whose research involves geospatial analysis, however, such initiatives mean more than interoperability and flexibility. These efforts are progressively shielding these users from having to deal with problems such as data representation formats, communication protocols or pre-processing algorithms. Once scientists are allowed to abstract from lower level concerns, they can shift their focus to the design and implementation of the computational models they are interested in. This paper analyzes how interoperability and componentization efforts have this underestimated impact on the design and development perspective. This discussion is illustrated by the description of the design and implementation of WebMAPS, a geospatial information system to support agricultural planning and monitoring. By taking advantage of new results in the above areas, the experience with WebMAPS presents a road map to leverage system design and development by the seamless composition of distributed data sources and processing solutions.
Keywords: geospatial data, geospatial processing, geospatial interoperability, data publication, process publication.
1. Introduction
In geographic information science, interoperability is a key issue, given the wide diversity of available geospatial data and scientific data processing tools. There are many research initiatives to meet this challenge, from data inter-change standards and service-oriented architectures (SOA) to user interface design. This paper concentrates on two kinds of interoperability aspects: processes and data19,36,38.
We show that efforts towards these directions have a desirable side effect: they are progressively shielding end-users (the scientists) from having to deal with low level data management issues. Indeed, because of the variety of data available, from distinct providers, these scientists are forced to concern themselves with low level implementa-tion details. Interoperability soluimplementa-tions are helping to decrease this problem, thus contributing to bridge the semantic and operational gap between data providers and scientists whose main interest is to design and test computational models that use geospatial data and processes. In this text, the term model refers to a computational model representing relevant aspects from natural or artificial phenomena and/or proc-esses that are somehow spatially referenced – e.g. a hurricane (natural phenomenon), or urban traffic (artificial). Models are ultimately embedded in applications – e.g., that provide tools to run or tune models.
The term user denotes two categories of people: end-users (i.e., those that will interact with an application, in particular scientists), and designers/developers of models and appli-cations (i.e., those that benefit from the interoperability advantages offered by our framework). When necessary, the text differentiates among them, by using the terms end-user and developer. Most of the paper concerns developers, even though end-users are often required to play the role of devel-opers in the geospatial domain, being constantly burdened with low-level details. Both kinds of users are positively affected by the framework.
We categorize approaches to deal with interoperability issues as: standards-based, ontologies-based and services-based. Standards concern reaching an agreement on a domain and specifying interfaces, protocols and data representation formats. Ontologies are also related with a domain, but an a priori agreement is not always required. Services present a generic way of encapsulating operations from a system, making them available in a uniform way. Ontologies are out of this paper’s scope, being tackled elsewhere15,16,42.
This paper discusses recent efforts in interoperability for geospatial processes and data that are based on stand-ards and services. Our discussion is intertwined with the impacts of such interoperability solutions on the design and development of geospatial applications. Monolithic systems are giving place to component-based distributed architectures50,52. While the former forced scientists to adapt a problem (and their solution to it) to be compatible with a system and its data formats, the latter fosters the adoption of systems and data28 that will fit the requirements of a new problem. Sensor data applications such as environmental and urban planning14 are pushing the need for these kinds of solution even harder. They have to rely not only on local, well known, data providers but often on distributed, discov-ered on-the-fly, heterogeneous systems. In order to leverage design and construction of geospatial applications, however, data must undergo complex sequences of transformations, from providers to consumers. To support the required trans-formations, the designers of geospatial systems are faced with a multitude of process and data interoperability solu-tions, which they must somehow choose and compose.
The paper presents two main contributions towards helping solve this problem, namely:
s A CONCEPTUAL FRAMEWORK THAT STRUCTURES THOSE TRANS -formation steps into several layers, with clear cut interfaces and responsibilities. Each of these layers addresses one kind of interoperability problem (for instance, access mechanisms, data cleaning, data formatting). This separation helps systems designers to focus on one issue at a time, leading to modular and composable systems. It also shields scientists from having to deal with low-level implementation issues; and,
s AREALCASESTUDYOFTHISFRAMEWORKSHOWINGITSADVAN
-tages on data and process interoperability. This case study concerns one of the projects that is using the framework – WebMAPS, a multidisciplinary project involving research in computer science and agricul-tural and environmental sciences.
Moreover, the paper attacks data and process interoper-ability problems within a single architecture. As will be seen, this eliminates several obstacles faced by developers, who are often induced to treat data and process interoperability within distinct perspectives.
The rest of the paper is organized as follows. Section 2 proposes a framework for publication of geospatial data and processes, to support application development. Section 3 describes the WebMAPS project and how it is being built
under the framework. Section 4 discusses approaches for interoperability, how they fit in the framework and in WebMAPS development. Section 5 presents related work. Section 6 concludes the paper and discusses ongoing work.
2. A Framework for Geospatial Data
Management
The architecture of interoperable data management systems is often specified following a basic three-layer cycle: providers (data layer), transformers (service layer) and consumers (client layer). An example is the infrastructure provided by INSPIRE25, an initiative for the creation of a spatial infrastructure for Europe, with a distributed network of databases, linked by common standards and protocols to ensure compatibility and interoperability of data and services. INSPIRE’s archi-tecture (client, services and data layers) includes four main groups of components: user applications, geo-processing and catalog services, catalogs and data repositories. The organi-zation in these three layers is not unique to GIS (Geographic Information Systems) – e.g., see Jarke et al.27 for data warehouse management. Though useful to understand the functionalities provided, this kind of organization is insufficient for designers of geospatial computer models to choose and compose process and data interoperability solutions.
2.1. Framework overview
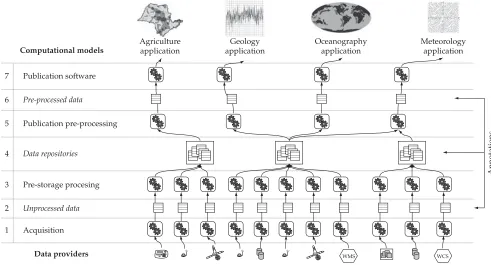
In order to meet this challenge, we propose an extended framework which induces a methodology for geospatial data management, and the design and implementation of compu-tational models in GIS. This framework, shown in Figure 1, describes a data management cycle for GIS applications – from data acquisition (at the bottom) to data publication (at the top), to be consumed by applications that embed models. This cycle can be repeatedly pipelined: the data publishers of one cycle can become the data providers of the next cycle. As will be seen, the first four layers can be compared to a Extract-Transform-Load (ETL) process2,20,22,48 in data warehouse environments. This organizational cycle provides the basic structure through which process interoperability problems at several levels can be dealt with.
Our full data management cycle has seven layers, which alternate between representing either data or processes. Layers 2, 4, and 6 represent data, and layers 1, 3, 5, and 7 (boxes with gear icons) represent data manipulation opera-tions. The flow is from bottom to top, with the operations being applied to the data on their way up. We point out that not all stages of the cycle are mandatory – e.g., a given intermediate stage may not be needed, or applications may retrieve raw data directly from providers. Furthermore, an entire cycle may be under the control of a single organization (e.g., our case study of Section 3), or distributed on the Web.
ground-based networks to large satellite embarked multi-spectral electromagnetic sensors.
The top layer houses the applications that embed the
Computational Models. It is here that end-users are able to interact with all the infrastructure on the layers below. Applications embed model execution, hence allowing scien-tists to visualize results, and to tune and interact with these models.
Sensor-produced data pose several new challenges to geographic applications. These data have a variety of char-acteristics that impact on how they are stored, processed, published and accessed23,53. Besides the spatio-temporal
vari-ability inherent to geospatial data, we single out the following issues particular to sensor data: i) regularity: production of data in independent blocks or as continuous streams; ii) transmission: manual readings, wired/wireless transmis-sions, error introduction, and others; iii) position: impacts of the sensor relative position on the readings with respect to the observed phenomena; and iv) mobility: relation between sensor movement and its readings. Many other characteris-tics can be considered, according to the sensor capabilities and the application requirements. The broader the coverage of these aspects, the larger the number of consumers to which the data may be adequate.
Sensor data must be combined with data coming from data services. The latter deliver products provided by organ-izations that create or enrich a given data set and make it available. These data also have inherent characteristics that influence subsequent manipulation. Examples include issues such as which models were used to produce the data, which parameters were applied to calibrate the model, or how reli-able were the data.
Next, we detail what each of the layers encompasses.
Layers 1, 3 and 4 can be respectively compared to extract,
transform and load phases of an ETL process.
2.2. Layer characterization
Layer 1 (Acquisition) hosts data acquisition software,
which works as a wrapper to data providers. Machine proc-essable knowledge representation is an important issue in enabling software in this layer to access data with complex characterization from multiple data sources. Standards play an important role to deal with knowledge representation, and are further explored in Section 4, where we discuss how they “wrap” the data management cycles. This layer expresses the
extract phase of an ETL process.
Layer 2 denotes in Unprocessed data, obtained directly
from data providers in a variety of formats. To be useful within a data management cycle, the data must be adapted to some representation using the characteristics and formats chosen for the cycle. This task is performed in Layer 3. Usually, unprocessed data is stored when there is a need for comparing pre-storage processing solutions, for maintaining historical raw data, or for auditing purposes.
Layer 3 (Pre-Storage Processing) represents the processing phase where data is transformed before its storage. Examples include signal processing functions for improving precision, data cleaning for detecting variations or errors, computing statistical parameters to detect acquisition problems, converting temporal and/or spatial resolutions, and testing data format conversions to determine accuracy. This layer
corresponds to the transform phase of an ETL process.
Computational models
Data providers Publication software
Pre-processed data
Publication pre-processing
Data repositories
Pre-storage procesing
Unprocessed data
Acquisition
Agriculture application
Geology application
Oceanography application
Meteorology application
WMS WCS
Annotations
7
6
5
4
3
2
1
Layer 4 (Data Repositories) corresponds to the storage facility, often a data repository of some kind, such as a data-base system. Two of the major issues to be dealt with in this layer are problems on what to store and how to fill in the gaps left by several types of acquisition errors. Selecting what is going to be stored is important since the amount of data acquired may be far too large to be stored in full13,18. Given that geospatial systems must also cope with streamed data, this raises the additional issue of providing query mecha-nisms that can cope with both stored and streamed data3. For streamed data, the storage layer may have its role filled by a proxy service with some kind of caching mechanism. This is more natural for many kinds of applications (e.g., real time traffic monitoring). Queries may need to combine data from several data sources, even both streamed and stored data, possibly using different pre-storage processing operations. This can only be treated adequately in layers that have access to these resources, which is the case for Layer 4. The storage part of this layer is directly related to the load phase of an ETL process.
Layer 5 (Publication Pre-Processing) is responsible for trans-forming the data, filtering or augmenting it, in order to meet application requirements. Examples of such requirements include adjusting spatio-temporal resolution, access periodicity and specific presentation formats. Instances of operations to fulfill these requirements include composition operations (e.g., fusion of data from different data sources), scaling operations (e.g., changing temporal or spatial resolution), customization operations or more complex operation compositions. However, as most of these data are georeferenced, the more traditional GIS operations, e.g., see Rigaux et al.46, are the most common in this phase. The execution of operations in Layer 5 are guided by application needs while operations executed in Layer 3 are oriented towards storage requirements. Thus, unless the operation was executed in Layer 3 and the result is already available in the repositories, a request from an application is executed in Layer 5.
Layer 6 (Pre-Processed Data) contains the pre-processed data sets, ready to be published and consumed by models. The main concern in this layer is data representation, e.g., data format, spatio-temporal resolution, and associated descriptions. An application request specifies the format, with translations applied as needed. Resolution adaptation may require interpolation algorithms for larger resolutions and summarization algorithms for smaller resolutions.
Layers 5 and 6 are not needed in non-shared data scenarios. Their appearance reveals an interesting issue: as models and algorithms become more stable and accepted within a community, they become basic and are taken for granted. This pushes the results of such models and algo-rithms down from the model layer to layer 5, with impact on interoperability and cooperative scientific work. An example of such migration is the georeferencing of satellite images: in the past, it was a necessary step to perform within geospa-tial data applications; presently it is available as a default attribute of most published images.
Layer 7 ( Publication Software) represents the software that will make interfaces to operations and data access mecha-nisms available to applications. This is achieved by agreement between software providers and application developers. The need for such agreements restricts interoperability among new resources and systems. As an alternative to consen-sual specification, the software in this layer should provide descriptions that are sufficiently rich to allow applications to determine the suitability of software and data. Different approaches are used by the publication software depending on the requirements of the client applications, e.g., protocols with less overhead for large data sets, or richer protocols for initial stages of communication.
The publication software must also allow applications to select pre-processing operations, among the ones available, to be applied on the data before transmission. The opera-tions are actually provided by lower layers, mainly by layer 5 (publication pre-processing) but a list of them and a selection mechanism must be present on the publication layer. Since the requirements from the applications vary, many different transformation operations may be required before the data can be used. Actually, applications can use either already pre-processed data sets (e.g. from Layer 6) or invoke opera-tions to generate new data sets (e.g., from Layer 5). It is often undesirable or unfeasible to perform these operations within the application53.
Annotation mechanisms are orthogonal to all layers, using metadata standards or free annotations. In other words, each data layer may be associated with annotation mechanisms that provide semantics to raw, stored or pre-processed data. Metadata have a predefined structure and expected ranges. This allows, for instance, indexing and retrieval based on the metadata, imposing, however, rigid limits. Annotations, on the other hand, have no structure and do not allow indexing, presenting a challenge for retrieval, often requiring content-based techniques32. Nevertheless, they allow very flexible descriptions. The proposal in Pastorello Jr et al.42 shows how to provide some structure to annotations without hampering flexibility by using references to ontologies. Section 4 discusses how to improve metadata semantics with standards.
2.3. Remarks on the framework
data from two data sources, each using a different combi-nation of access mechanism (e.g., an FTP server and a Web service) and data format (e.g., XML, CSV and binary). Once a module for each of the access mechanisms is available at the bottom layer, all modules for handling different data formats will be able to use one uniform interface to access the data from both providers. This scheme is the same throughout the layers, each layer adds a solution to one interoperability issue. This solution can reuse modules provided to solve issues in lower-level layers – which in fact offer a uniform interface (or data format) to the next layer. Taking these stages into account helps solving several of the interoperability prob-lems raised by the use of distributed geospatial data sources or by the invocation of external services. This will be illus-trated next.
3. Putting the Framework to Use
This section discusses how the proposed framework reflects in the implementation efforts within the WebMAPS project. The framework is also being used in other ongoing projects at the Laboratory of Information Systems (LIS) at the Institute of Computing, University of Campinas. We have chosen to concentrate our discussion on the WebMAPS project, because it is the earliest of such projects, and because it provides enough material to illustrate the advantages of our approach. One product from WebMAPS, vegetation index graphs, is described in Section 3.2 according to the layers presented in Section 2. Two other products are also detailed: one for auto-mation of data acquisition (Paparazzi, see Section 3.3) and another for flexible data publication (see Section 3.4).
3.1. Overview of the WebMAPS project
WebMAPS is a project whose goal is to provide a platform based on Web Services to formulate, perform and evaluate policies and activities in agro-environmental planning.
The project caters to two kinds of users – farmers, and domain experts, such as agronomers or earth scientists. Farmers can enter data on their properties (e.g., produc-tion, parcels, crops). They are able to correlate data on their farms to geospatial content available on WebMAPS repositories – e.g., satellite image series or regional boundaries. Experts may want to investigate distinct kinds of data correlation and propose models to explain, monitor, or forecast crop behavior. See some of the tools at http://www.lis.ic.unicamp.br/projects/webmaps.
Similar to INSPIRE25, WebMAPS can also be described
using a 3-layer architecture, part of which already imple-mented. The Client Layer is responsible for user requests, forwarding them to be processed by the middle (Service) layer. The latter contains distinct kinds of modules, such as query processing, workflow specification, and ontology manage-ment. The Data Layer contains WebMAPS data repositories, including primary raw data (e.g., product classification from Brazilian official sources) and derived data (e.g., composite images). Geospatial data sets include satellite images, and
coordinates of county boundaries. Additional data sources include information on properties, agricultural products and so on. Data are stored in the PostGreSQL database manage-ment system, with PostGIS extension. At present, most of the services in WebMAPS are being implemented as software modules, for rapid prototyping and testing by end-users.
This kind of 3-tier architecture is useful for a high level description of the system’s functionalities. However, as stressed in Section 2, it is not adequate from an interoper-ability perspective. The sections that follow discuss how we use our 7-layer framework of Section 2 to specify and develop some of the products offered by WebMAPS. In particular, we discuss three kinds of products: i) the dynamic computation of NDVI graphs, starting from the acquisition of satellite images; ii) a tool for automated image acquisition; and iii) the interop-eration with Google Maps. The first item is an example that spreads throughout most of the layers, while the last two focus on the bottom and top layers of the framework, respectively.
3.2. Illustrating the data management framework in
WebMAPS
In this section, we describe one of the devised WebMAPS’ products that is partially implemented and adheres to the layering described in Section 2: computing historical NDVI profiles for a given region and period.
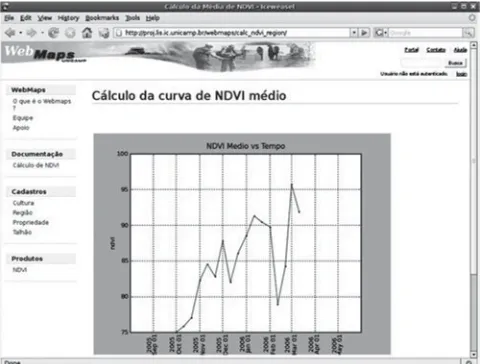
NDVI ( Normalized Difference Vegetation Index) is a vegeta-tion index. It is correlated to biomass condivegeta-tions of vegetavegeta-tion and is widely used in distinct kinds of contexts – e.g. agricul-ture, biodiversity. An NDVI graph plots the average NDVI pixel value in a region through time from a temporal series of images. This can be used for crop monitoring and prediction5,45.
For example, in the sugar cane culture, a curve with higher values may indicate a product with better quality.
One of the functionalities available from WebMAPS is the construction of such graphs. The user selects a region of interest R and a period T and the system computes the graph from a temporal series of satellite images, plotting the NDVI evolution for that region and period, as depicted in Figure 2.
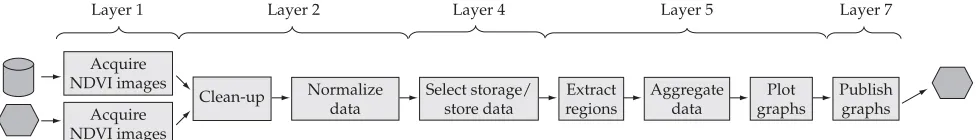
NDVI graphs require two kinds of data – those acquired periodically (satellite images) and those that, once acquired, are only sporadically updated (e.g., county boundaries). This section describes the management cycle for these data within WebMAPS. We will not enter into details of acquisition peri-odicity nor procedures to refresh data, but such issues are embedded into constraints treated by our 7-layer framework. Figure 3 shows the main phases of the workflow that speci-fies the computation of the graph, following the layers of Figure 1. This workflow is shown at its more abstract level, but each step can encapsulate several processes. Moreover, though not shown in the figure, it contains loops and cycles, which are not relevant for understanding our case study. We point out that this example does not have issues to be dealt with in layers 2 and 6. Applications that, for instance, are heavily dependent on data representation formats, data encoding or associated descriptions (metadata) would need specific solutions in these layers.
3.2.1. Data acquisition
There are many satellite imagery providers. For NDVI analysis, WebMAPS’ agro-scientists have chosen to use pre- computed NDVI images provided by NASA from MODIS sensors37,51. Here we faced typical problems of geospatial data
acquisition. Each image depicts a geographical region much larger than the ones for which this first version of WebMAPS is being conceived (Brazil’s southeast). Moreover, retrieving each image meant browsing the NASA web site to find the download link for that image. Thus, assembling our image database became a laborious, tedious and time-consuming task. To improve on that, we have developed Paparazzi, a tool to automate the retrieval of remote data sets – see Section 3.3.
The second data type needed are vector-based coordi-nates, corresponding to the geographical regions of interest. WebMAPS offers two options: i) ad-hoc manual definition of the region, described in Well-Known Text Format (a.k.a WKT)10,
a standard from the Open Geospatial Consortium (OGC); or
ii) importing geospatial vector shapefiles. Brazilian county
geometry shapefiles were imported from IBGE (Brazilian
National Geographic Institute).
The last data type we need are textual descriptions of crops and their attributes. Here we applied screen scraping12, 21
tech-niques to fetch produce code, popular name, scientific name and description from the Brazilian Ministry of Agriculture Web portal. See Section 4 for details on these techniques.
3.2.2. Unprocessed data
Satellite images retrieved from NASA using Paparazzi and shapefiles retrieved from IBGE are encapsulated in tempo-rary files, for subsequent quality checking. The rest of the data used goes directly to Layer 3 (Pre-Storage Processing). Here, we can already see the advantages of our multi-layer framework, which allows determining which stages should be followed for each kind of data.
3.2.3. Pre-storage processing
In possession of unprocessed data, we proceed to the pre-storage processing phase. There are three main concerns here: corruption detection, data normalization and assembly of the data sets. These concerns are not always present (e.g., if the data provided already have such issues solved).
Corruption detection is mandatory and is made explicit in our framework. First, data providers are never 100% reli-able, and the acquired data may be already corrupted in its provider’s domain. Second, data corruption can occur during the acquisition phase. Here, the encapsulated unprocessed files containing satellite data and geometries have their integ-rity automatically checked (e.g., by checksum algorithms). Corrupted or partially retrieved files are removed.
The third (textual) record type is more challenging, because information is less structured, the domain of values is open and not fully-known and we lack fail-proof tools to verify corruption. For our textual data resources (based on official government crop classification) we performed a manual check. Additional procedures are left to future work.
Data normalization is a recommended step to make data processing easier and more efficient. We automatically convert all files to a single and uniform representation format, and all measurement units to the same system. Thus, we have chosen to: a) store satellite imagery into GeoTIFF47 files, converting
into this format whenever needed; b) convert shapefiles
and textual geometries (WKT) into Well-known Binary
repre-sentations (WKB) stored into PostGIS; and c) represent all geographical coordinates to latitude/longitude according
to WGS84 reference ellipsoid. WKB10 is also a standard from
OGC.
Data set assembly is the last pre-storage processing step we need, and consists in putting together coherent spatio-tem-poral units – e.g., in our example, creating a composite NDVI image from a mosaic of acquired NDVI images. This includes issues which are sometimes called detecting the FoU (fitness
Acquire NDVI images
Acquire NDVI images
Clean-up Normalize data
Select storage/ store data
Extract regions
Aggregate data
Plot graphs
Publish graphs
Layer 1 Layer 2 Layer 4 Layer 5 Layer 7
of use) of a data set – see Fu et al.30. Here, the first (temporal) problem occurs when there are gaps in a time series – e.g., due to communication or device failure. The second (spatial) problem occurs when missing spatial data create “holes” in a data set (e.g., when an image mosaic has missing parts). Both problems can occur at the same time. Spatio-temporal gap problems are very common when using data from sensor networks – e.g., sensors may stop providing data for a period of time, causing problems in analyses.
There are three basic approaches to assembly problems: i) acquire new data to fill the spatial and/or temporal gaps; ii) apply interpolation, probabilistic or inference procedures to fill the gaps; and iii) mark the gaps, and forward the solu-tion to some other layer (e.g., query processing will have to take the gaps into consideration). For satellite imagery, we have implemented the first approach, using data fetching retries and fallback data providers. For rainfall time series, we use the second approach. We have developed algorithms in which missing values are filled by combining spatial inter-polation with historical data33. These algorithms are used by the Brazilian Ministry of Agriculture to maintain its rainfall series database for the whole country.
3.2.4. Data repositories
Once the data are pre-processed, they are ready for storage. We use two types of storage: a relational database and the filesystem. Crop descriptions, geometries, textual prop-erties, and data set descriptions are stored in PostgreSQL/ PostGIS. Raster images in GeoTIFF format are stored in JFS (or XFS) filesystem partitions. We have chosen these partition types because they present good performance for large files6. So far, we have not used streamed sensor data. Our prelimi-nary experiments with these data appear in43. Streamed sensor data for agricultural purposes are being handled within our eFarms project (http://www.lis.ic.unicamp.br/ projects/efarms), which will act as a sensor data provider to WebMAPS.
3.2.5. Publication pre-processing
This phase concerns transforming information, and ulti-mately preparing it for user consumption. In our example, this means: i) computing the average NDVI pixel value for the region R defined by the user; and ii) iterating (i) for the input time span T. These steps are performed automatically without user intervention.
The images of interest are already stored in the reposi-tories. Steps (i) and (ii) consist in building a bitmap mask for R and applying this (cached) mask to all NDVI images within the desired time frame T, extracting the region (pixels) of interest and computing their average. The graph is constructed for these average values.
3.2.6. Data publication
Data publication is the last phase in the processing work-flow. In our case study, the NDVI graphs constructed in the
previous phase are published as images, embedded or not in HTML pages. Other formats could also be adopted here: text files with pairs <georeferenced point, value>, tables with the values for regions, etc.
3.3. Automating acquisition: Paparazzi
Paparazzi is a command-line tool we developed to auto-mate the acquisition of satellite imagery by means of screen scraping techniques24,29,31. Paparazzi is a specialized web crawler, hand-crafted to fetch data from specific target web sites. Paparazzi is an example of a tool that was implemented within the scope of Layer 1. Paparazzi is worth using when-ever the number of files to be retrieved is large, and hyperlinks to target files are not concentrated in a single page, but scat-tered across several pages, as is the case with NASA MODIS images. Consider the following Paparazzi command line:
paparazzi.py -b 2008-01-01 -e 2008-05-31 -s Brazil4 -p 250m -m 2 -r
It is a request for all images (–r) from January 1, 2008 (–b) to May 31, 2008 (–e), for the geographical region named Brazil4 (–s). Each image retrieved should have spatial resolu-tion (–p) of 250 meters per pixel and represent NDVI measures (–m). Brazil4 is a specific name used by NASA37 to designate a given area in South America that covers SE Brasil.
This same task required downloading 152 images corre-sponding roughly to 7 GB in size. If done manually, for each image, the user needs to visit three different web pages prior to starting a 50 Mb file download. In the first page the user selects the subset (Brazil4). In the next page the user selects data product (NDVI) and image resolution (250 m). Finally, in the last page, the user selects the file format and starts the image download. Therefore, precious user time can be saved, if the researcher relinquishes control and responsibility of the iterative acquisition process to Paparazzi. Moreover, when adopted as a software library, Paparazzi acts in reaction to user queries over incomplete data sets, trying to fill-in gaps on demand.
3.4. Flexible publication
WebMAPS innovates allowing data produced in any of the framework phases to be directly accessible in many representations. Therefore, WebMAPS is not just a black-box automating GIS procedures. It is also a data gateway fostering scientific information sharing and allowing experimental results to be reproduced and validated. This is facilitated by isolating the responsibilities of each framework layer.
Thanks to this, WebMAPS can act as a data provider and a data client. We exemplify this by showing its interaction with Google Maps. Figure 4 depicts Google Maps obtaining a geometry resource served in KML format from WebMAPS. Here, WebMAPS acts as a data provider and mediator, re-dis-tributing geometries acquired from an authoritative source (Brazilian Geographic Institute), and transformed into a suitable format to feed Google Maps. In Figure 5, we depict WebMAPS acting as a client of Google’s map rendering service. The map rendered by Google Maps (Figure 4) is mashed-up with results from a user query, composing the web page shown in Figure 5. The query results comprehend textual metadata and a NDVI graph for the given region and time frame. For visualization sake, the chart is an overlay, not representing the original page layout.
This interaction pattern between WebMAPS and Google Maps is a combination of resource-oriented (from WebMAPS) and service-oriented (from Google Maps) para-digms. We further discuss these approaches in Section 4. In this particular example, the use of KML and WKT enabled us
to rapidly build a prototype for cartographic visualization, including satellite image overlays provided by Google Maps. End-users are rapidly able to visually assess the quality of the data, and test the outcomes of different analyses. Hence, standards offer much more than interoperability. Their use has sped up the validation of user requirements in terms of interaction needs. More importantly, it has leveraged appli-cation development, so that users can start testing their ideas much sooner, while we work on other system issues. This does not mean that WebMAPS will necessarily always rely on Google Maps for cartographic rendering and interaction - we are also experimenting with other kinds of Web service-based solutions (see Daltio et al.16 for our use of GeoServer to
publish GML data for biodiversity systems).
4. Interoperability Approaches
This section characterizes the standards and services approaches to interoperability and show how they are contemplated within our framework, with examples from WebMAPS. We point out that ontologies are another very important approach to interoperability. In our framework, they intervene at all transversal annotation stages of Figure 3. They nevertheless are outside the scope of this paper.
4.1. Selected standards
Standards represent an agreement among research groups and are the main focus of many institutions such as OGC or W3C. From the data interoperability perspective, stand-ards deal with representation and formatting issues. OGC’s
Geographic Markup Language GML39 is an example of such a
standard. It is an XML-based specification for geospatial data interchange. Process interoperability specifications can base their input/output formats in GML.
From the process interoperability perspective, stand-ards are used in the specification of protocols, interfaces and descriptions of processes. Examples include OpenDAP and OGC standards. OGC’s main general-use standards for geospatial process interoperability are the Web Feature Service
(WFS), the Web Coverage Service (WCS) and the Web Map
Service (WMS)39. These standards specify the access
mecha-nisms to, respectively, vector data, raster data and renderized maps. Vector data describe geographic features using their geometry (points, lines, polygons). Raster data represent geographic areas as arrays of cells (e.g., images). The access mechanisms are to be implemented as Web services.
The recent Web Processing Service (WPS)40 specification
concerns the publication of geospatial processes, a main concern in this paper. A process may be an algorithm, a calcu-lation or a model that manipulates geospatial data. Although WPS does not describe the specific behavior of an operation, it
provides general description mechanisms, such as Profiles and
ProcessDescriptions40 and support for data encoded in GML.
This, however, still leaves room for semantic mismatches. Standards must be present at least in the frontiers of our data manipulation cycle, “wrapping” it (see Section 2). The
communication interfaces for data acquisition and publica-tion are the two points where these solupublica-tions are most useful: as seen in Section 3.4, WebMAPS can be seen as a client appli-cation and a data provider to client appliappli-cations. As a server, WebMAPS strives to adhere to standards, to enable interop-eration with other systems. As a client, taking advantage of standard interfaces is important, but, as will be seen, being able to handle involuntary, non-standardized, access mecha-nisms might be equally important. As part of those efforts, its development is adopting Web services and SOAP protocols, OpenDAP, Microformats and KML, discussed next.
OpenDAP is an acronym for Open-source Project for a Network Data Access Protocol. It consists of a data transport architecture and HTTP-based protocol capable of encapsu-lating structured data, annotating the data with attributes and adding semantics that describe the data. One of its features is the ability to retrieve file subsets, and aggre-gate data from several files in one transfer operation. It is being increasingly adopted by earth scientists to publish their data – e.g., in oceanography9,11,52. As exemplified by52, this allows scientists to exchange and visualize results of complex models. In our framework, OpenDAP can be used as a means to receive and publish data, in Layers 1 and 7. For instance, images are acquired and served by WebMAPS using OpenDAP. In the first case, it is at the receiving end (Layers 1 and 2), while in the second case it is at the top of the cycle.
Microformat is a web-based data formatting approach to re-use existing content as metadata, through standard annota-tions conveyed by XHTML (or HTML) classes and attributes. The intention is to allow information targeted to end-users to be also software processable. In other words, the layout and formatting markup are also used to perform semantic anno-tations. Microformats replace more complicated methods of automated processing, such as natural language processing or screen scraping. Their use has direct impact in the repre-sentation of data in Layer 6, after being generated in Layer 5 along with other transformation processes.
In particular, Geo is a microformat used for marking up WGS84 geographical coordinates (lat,long) in XHTML. Figure 6 presents an example of the use of this microformat in an XHTML page. This allows parsing tools to mine for pages that contain coordinates in this format. This allows these pages to be rendered using this geospatial informa-tion, e.g., in a mapping tool or loading the coordinates into a GPS device.
KML41 is an XML-based language schema for expressing geographic annotation and visualization for 2D and 3D Earth browsers. It was initially developed for use with
Google Earth. The KML 2.2 specification was accepted as an OGC standard, ensuring its status as an open standard for all geobrowsers. In WebMAPS, our geometry files are represented in KML and accessed by Google, in which case we are acting as data providers for another data manage-ment cycle. Figure 7 shows an example of a KML documanage-ment where the city of Campinas is represented as a point (its centroid).
The perspective of the data providers on how much effort they put in providing interoperable access mecha-nisms can be seen as voluntary and/or involuntary. The voluntary point of view is the one we have been discussing so far in this section. It is when the data provider willingly serves its data by means of well-known standardized inter-faces and protocols, fostering data interchange between systems. Voluntary access mechanisms usually comply to some extent to a standard, in an effort to make the data more easily accessible. The involuntary viewpoint encompasses data providers that are only concerned with data consump-tion from human users, providing no facilities for external systems interested in obtaining the same information. The reasons vary from lack of resources to the deliberate wish to prevent inter-systems data sharing. Therefore, involuntary access mechanisms usually do not have standardization as a main concern, even though they may comply to standards on occasion.
In order to include involuntary data providers in WebMAPS, we have adopted techniques from the informa-tion extracinforma-tion research field. One of these techniques is called screen scraping, in which a computer program extracts data from the displayed output of another program. Search engines and web crawlers use web scraping techniques. Indeed, Web pages are built using text-based mark-up languages, and frequently mix content with presentation. Therefore, web screen scrapers extract machine-friendly data from XHTML and other markup formats.
We believe that automated acquisition is important to bridge the test of computational models against data from several geospatial resource providers. The Paparazzi toolset, discussed in Section 3.3, is a step towards that goal.
4.2. Services approaches
In the services category of interoperability, there are two paradigms competing in the Web: Service-oriented
archi-<div class=”geo”> Campinas:
<span class=”latitude”> -22.906 </span>; <span class=”longitude”> -47.061 </span> </div>
Figure 6. Example of the Geo microformat in an XHTML page.
<?xml version=”1.0” encoding=”UTF-8”?>
<kml xmlns=”http://earth.google.com/kml/2.0”> <Placemark>
<description>City of Campinas</description> <name>Campinas</name>
<Point>
<coordinates>-22.906,-47.061</coordinates> </Point>
</Placemark> </kml>
tectures (SOA) and Resource-oriented architectures (ROA). SOA is a direct evolution of concepts born from distributed computing theory and modular programming practices. It is an architecture where functionality is grouped around processes and packaged as interoperable RPC-style services, loosely coupled with operating systems or programming languages. SOA’s goal is to facilitate the composition of distributed Web services, through the standardization of interfacing, reliable messaging, transactions and security. SOA’s philosophy transcends the Web medium and could be successfully applied to other contexts.
On the other hand, ROA is intimately related to the Web. It rescues the principle of Representational State Transfer (REST), defined in Fielding17. REST outlines how resources are defined, addressed and accessed through simple inter-faces, where domain-specific data is transmitted over HTTP without any additional messaging layer or session tracking mechanisms. ROA design aims for the Web’s scalability, and it is defined by five main principles. First, application state and functionality are divided into resources. Second, a resource is uniquely addressable by means of hypermedia links. Third, all resources share the same constrained, uniform and well-defined interface. Fourth, resources support the HTTP protocol operations: GET, PUT, POST, DELETE, HEAD, OPTIONS. Finally, protocols should ideally be stateless, cacheable, layered and client-server oriented. ROA is more scalable than SOA, and easier to implement due to its uniform interface and adherence to Web model and standards.
SOA and ROA are complementary paradigms; together they maximize interoperability. For this reason, we advocate the adoption of hybrid architectures, such as in WebMAPS. As mentioned in Section 3.4, WebMAPS uses SOA when we act as a client to Google, and ROA when Google plays the role of WebMAPS client.
5. Related Work
To the best of our knowledge, no previous work considers all the phases covered in our framework. However, there are proposals that are related with a few of the layers, some of which are presented here. They cover the entire spectrum of solutions discussed in the paper, from data and process interoperability using standards and services, to user inter-face aspects.
There are many studies concerning use of standards, usually restricted to just one of our layers. For instance, Aim4GDI1 uses OGC standards for accessing distributed data sources and creating composite results. It also extracts meta-data from these sources, composing them in RDF for later querying (using SPARQL) and publication (in an ontology description language). However, it only considers issues at the data access and interchange level, not covering processing resources and their interoperability.
The work presented in26 considers the use of standards for both data and process interoperability, for distributed sources. Their solution consists on a framework based on the ISO19100 series of standards. The paper materializes the
framework in a travel guide system called MTGS. However, limiting the standards considered for interoperability into a single standards source hampers the construction of multi-disciplinary models and applications, preventing their evolution. This is remarked by34, which discusses the evolu-tion of the GML standard and the importance of integrating it with standards from other application areas.
Interoperability through services is also common, in partic-ular taking advantage of WFS, WCS and WMS. The work of11, for instance, describes initiatives towards combining commu-nication and access standards, e.g., providing common grounds for OGC’s WFS and WCS to work side by side with OpenDAP to access oceanographic data. Their effort concurs with ours in the sense that combining different standards into systems design is a way of leveraging interoperability. Sensor networks can also be encapsulated according to the class of service provided30. In such a case, services are even more appropriate.
Our main concern, however, is to provide adequate support to flexible system development. From this point of view, the motivation of GeoModeler52 is the closest to ours, making geospatial resources more accessible to applications running models. GeoModeler is a software framework that combines software components from a GIS with modeling and simulation software, ultimately allowing various forms of analysis and visualization of oceanographic data. Its approach, however, deals with construction of centralized systems and software components interoperability in such systems. It does not consider, for instance, data acquisition and publication issues.
Our layers stimulate data and process interoperability. One concern (e.g., Layers 3 and 5) is to ensure data quality. This kind of emphasis is undertaken, for instance, by Thakkar et al.49. The paper presents a mediator that considers data quality as the driving force of the integration process. Their integration approach involves comparing and evaluating different data providers and keeping information on this evaluation available alongside with the data. However, they do not address process interoperability issues nor take full advantage of metadata and representation standards.
Finally, there are a variety of proposals that consider user aspects: the use of contextual information7, or interactions in which the user is a computational system30, or humans4.
The focus of the framework proposed in30 is to evaluate the suitability of geospatial time series to the requirements of a given application. Once the suitability is calculated, it can be applied to assess the results produced by the application, helping determine the suitability of such results to be used as input by other applications. In our solution, application requirements are also a major concern, but we consider the impacts of interoperability solutions in meeting such require-ments instead of trying to tackle them directly.
Finally, visualization of spatial and non-spatial data on the Web is the main concern of4. They argue that access to geospatial data aimed at visualization should be easier and more efficient than transferring whole data sets to be proc-essed locally. They propose a browser that supports queries to geospatial services, invoking remote processes and getting the results incrementally. Their solution goes notably in the direction of leveraging the transition proposed by us (from focus on resources to focus on models), with the limitation of not considering distributed data and processing sources.
6. Concluding Remarks
This paper presented a framework that analyzes the management of geospatial data from a life cycle perspective. This framework is being validated in the design and develop-ment of several projects within the Laboratory of Information Systems of the Institute of Computing, UNICAMP.
By isolating each layer in the cycle, with clear interfaces and tasks, the framework induces a methodology to design and develop interoperable geographic applications. Whereas related research concentrates on providing standards or serv-ices for one given data transformation stage, we show how these efforts can be seamlessly interconnected. This allows users to shift their focus from the technology being used to the models being constructed. Besides implementation efforts for the WebMAPS project, we are also applying the framework to the development of the eFarms project, which is centered on managing data from ground-based sensing devices. The framework not only helped understanding and implementing solutions to the problems in sensor data management, but it also made clearer the possible interac-tions with other soluinterac-tions (such as the ones from WebMAPS) and which modules from these solutions could be reused.
Future and ongoing work involve both theoretical and practical issues. We are examining additional access standards to be included in WebMAPS, both from the communication and data representation points of view. Another research issue involves the use of ontology-based techniques to speed up query processing and annotate data and processes. Again, we point out that we have not considered ontologies in this work, even though they are another important means of improving data and process interoperability. For detail on on our work in this direction, the reader is referred to16. Ontologies are also subject of ongoing work as part of our annotation efforts42. Still yet another ongoing effort is to incorporate our work about diagnosing similarity of oscillation trends in time series35. Finally, we are investigating the possibility of storing
satellite image files in PostGIS and let them be handled by the Rasdaman system (http://www.rasdaman.com/).
Acknowledgements
This work was supported by FAPESP (grant number 2004/14052-3) and partially financed by CNPq (WebMAPS projects) and by the Microsoft Research-FAPESP Institute (eFarms project).
References
1. Aditya T, Kraak MJ. Aim4GDI: facilitating the synthesis of GDI resources through mapping and superimpositions of metadata summaries. Geoinformatica 2007; 11(4):459-478.
2. Agrawal H, Chafle G, Goyal S, Mittal S, Mukherjea S. An enhanced extract-transform-load system for migrating data in Telecom billing. In: IEEE 24th International Conference on Data Engineering; 2008; Cancun. p. 1277-1286.
3. Balakrishnan H, Balazinska M, Carney D, Çetintemel U, Cherniack M, Convey C. et al. Retrospective on Aurora. The VLDB Journal 2004; 13(4):370-383.
4. Brabec F, Samet H. Client-based spatial browsing on the World Wide Web. IEEE Internet Computing 2007; 11(1):52-59.
5. Brown ME, Pinzon JE, Didan K, Morisette JT, Tucker CJ. Evaluation of the consistency of long-term NDVI time series derived from AVHRR, SPOT-vegetation, SeaWiFS, MODIS, and Landsat ETM + sensors. IEEE Transactions on Geoscience and Remote Sensing 2006; 44(7):1787-1793.
6. Bryant R, Forester R, Hawkes J. Filesystem performace and scalability in Linux 2.4.17. In: Proceedings of the USENIX Annual Technical Conference (FREENIX Track); 2002; Monterey. p. 259-274.
7. Cai G. Contextualization of geospatial database semantics for Human-GIS Interaction. Geoinformatica 2007; 11(2):217-237.
8. Campbell AT, Eisenman SB, Lane ND, Miluzzo E, Peterson RA, Lu H. et al. The rise of people-centric sensing. Internet Computing, IEEE 2008; 12(4):12-21.
9. Chambers LH, Alston EJ, Diones DD, Moore SW, Oots PC, Phelps CS. The MY NASA DATA Project: tools for knowledge sharing and discovery. In: Proceedings of the 6th Annual NASA
Earth Science Technology Conference; 2006; College Park.
10. Open Geospatial Consortium. OpenGIS Implementation Specification for Geographic Information. Simple Feature Access. Available from: <http://www. opengeospatial.org/ standards/sfa>. Access in: 09/2008.
11. Cornillon P, Caron J, Burk T, Holloway D. Data access interoperability within IOOS. In: Proceedings of MTS/IEEE OCEANS; 2005; Washington. p. 1790-1792.
12. Crescenzi V, Mecca G. Automatic information extraction from large websites. Journal of the ACM 2004; 51(5):731-779.
14. Cuff D, Hansen M, Kang J. Urban sensing: out of the woods. Communications of the ACM 2008; 51(3):24-33.
15. Daltio J, Medeiros CB. Aondê: an ontology web service for interoperability across biodiversity applications. Information Systems 2008; 33(7-8):724-753.
16. Daltio J, Medeiros CB, Gomes L Jr., Lewinsohn TM. A framework to process complex biodiversity queries. In: Proceedings of the ACM Symposium on Applied Computing; 2008; Fortaleza. p. 2293-2297.
17. Fielding RT. Architectural styles and the design of network-based software architectures [Thesis]. Irvine: University of California; 2000.
18. Ganesan D, Estrin D, Heidemann J. Dimensions: why do we need a new data handling architecture for sensor networks? ACM SIGCOMM Computer Communication Review 2003; 33(1):143-148.
19. Goodchild MF, Egenhofer MJ, Fegeas R, Kottman CA. (Ed.). Interoperating Geographic Information Systems. Kluwer; 1999.
20. Haas L. Beauty and the beast: the theory and practice of information integration. In: Proceedings of the 11th International Conference on Database Theory 2007; Barcelona. p. 28-43.
21. Habegger B, Quafafou M. Building web information extraction tasks. In: Proceedings of the IEEE/WIC/ACM International Conference on Web Intelligence; 2004; Beijing. p. 349-355.
22. Halevy AY, Ashish N, Bitton D, Carey M, Draper D, Pollock J, Rosenthal A, Sikka V. Enterprise information integration: successes, challenges and controversies. In: Proceedings of the 24th ACM SIGMOD International Conference on Management of Data; 2005; Baltimore. p. 778-787.
23. Hellerstein JM, Hong W, Madden S. The sensor spectrum: technology, trends and requirements. SIGMOD Record 2003; 32(4):22-27.
24. Huynh D, Mazzocchi S, Karger D. Piggy bank: experience the semantic web inside your web browser. Web Semantics: Science, Services and Agents on the World Wide Web 2007; 5(1):16-27.
25. INSPIRE. Infrastructure for spatial information in the europe. Available from: <http://www.ec-gis.org/ inspire/>. Access in: 09/2008.
26. Jang SG, Kim TJ. Modeling an interoperable multimodal travel guide system using the iso 19100 series of international standards. In: Proceedings of the 14th Annual ACM International Symposium on Advances in Geographic Information Systems; 2006; Arlington. p. 115-122.
27. Jarke M, Jeusfeld MA, Quix C, Vassiliadis P. Architecture and quality in data warehouses: an extended repository approach. Information Sytems 1999; 24(3):229-253.
28. Kantere V, Sellis T. Handling spatial data in distributed environments. In: Proceedings of the 15th Annual ACM International Symp. on Advances in Geographic Information Systems; 2007; Seattle.
29. Kosala R, Blockeel H. Web mining research: a survey. ACM SIGKDD Explorations Newsletter 2000; 2(1):1-15.
30. Fu L, Soh LK, Samal A. Techniques for computing fitness of use (FoU) for time series datasets with applications in the geospatial domain. Geoinformatica 2008; 12(1):91-115.
31. Laender AHF, Ribeiro-Neto BA, Silva AS, Teixeira JS. A brief survey of web data extraction tools. SIGMOD Record 2002; 31(2):84-93.
32. Lew MS, Sebe N, Djeraba C, Jain R. Content-based multimedia information retrieval: state of the art and challenges. ACM Transactions on Multimedia Computing, Communications, and Applications 2006; 2(1):1-19.
33. Lima JGS, Medeiros CB, Assad ED. Integration of heterogeneous pluviometric data for crop forecasts. In: Proceedings of the 5th Brazilian Symposium on GeoInformatics; 2003; Campos do Jordão. Article 14.
34. Lu CT, Santos RF Jr., Sripada LN, Kou Y. Advances in GML for Geospatial Applications. Geoinformatica 2007; 11(1):131-157.
35. Mariote LE, Medeiros CB, Lee I. Diagnosing similarity of oscillation trends in time series. In: Proceedings of the 7th IEEE International Conference on Data Mining Workshops; 2007; Omaha. p. 643-648.
36. Medeiros CB, Alencar AC. Data quality and interoperability in GIS (In Potuguese). In: Proceedings of the 1st Brazilian Symposium on GeoInformatics; 1999; Campinas.
37. NASA. MODIS Rapid Response System. Available from: <http://rapidfire.sci.gsfc.nasa.gov/>. Access in: 09/2008.
38. NSF/NCGIA/OpenGIS. Proceedings of the International Conference and Workshop on Interoperating Geographic Information Systems; 1997. Available from: <http://www. ncgia.ucsb.edu/conf/interop97>. Access in: 06/2008.
39. OGC. OpenGIS Reference Model (ORM). Available from: <http://portal.opengeospatial.org/files/?artifact_ id=3836>. Access in: 09/2008.
40. OGC. OpenGIS Web Processing Service. Available from: <http://www.opengeospatial.org/ standards/wps>. Access in: 09/2008.
41. Open Geospatial Consortium, Inc. KML Implementation Standard. Available from: <http://www.opengeospatial. org/standards/kml/>. Access in: 09/2008.
42. Pastorello Jr GZ, Daltio J, Medeiros CB. Multimedia semantic annotation propagation. In: Proceedings of the 1st IEEE International Workshop on Data Semantics for Multimedia Systems and Applications (DSMSA) - 10th IEEE Int. Symposium on Multimedia (ISM); 2008; Berkeley. p. 509-514.
43. Pastorello Jr GZ, Medeiros CB, Santanchè A. Accessing and processing sensing data. In: Proceedings of the 11th IEEE International Conference on Computational Science and Engineering; 2008; São Paulo. p. 353-360.
44. Pastorello Jr GZ, Senra RDA, Medeiros CB. Bridging the gap between geospatial resource providers and model developers. In: Proceedings of the 16th ACM International Conference on Advances in Geographic Information Systems; 2008; Irvine. p. 379-382.
46. Rigaux P, Scholl M, Voisard A. Spatial databases: with application to GIS. : Morgan Kaufmann, Elsevier; 2001.
47. Ritter N, Ruth M. The GeoTiff data interchange standard for raster geographic images. International Journal of Remote Sensing 1997; 18(7):1637-1647.
48. Simitsis A, Vassiliadis P, Sellis T. Optimizing ETL processes in data warehouses. In: Proceedings of the 21st International Conference on Data Engineering; 2005; Tokyo. p. 564-575.
49. Thakkar S, Knoblock CA, Ambite JL. Quality-driven geospatial data integration. In: Proceedings of the 15th Annual ACM International Symposium on Advances in Geographic Information Systems; 2007; Seattle. Article 16.
50. Ungerer MJ, Goodchild MF. Integrating spatial data analysis and GIS: a new implementation using the Component Object
Model (COM). International Journal of Geographical Information Science 2002; 16(1):41-53.
51. Van Leeuwen WJD, Huete AR, Laing TW. MODIS vegetation index compositing approach: a prototype with AVHRR data. Remote Sensing of Environment 1999; 69(3):264-280.
52. Vance TC, Merati N, Mesick SM, Moore CW, Wright DJ. GeoModeler: tightly linking spatially-explicit models and data with a GIS for analysis and geovisualization. In: Proceedings of the 15th Annual ACM International Symposium on Advances in Geographic Information Systems; 2007; Seattle. Article 32.