R E S E A R C H
Open Access
Exploring student understanding of the
engineering design process using distractor
analysis
Stefanie A. Wind
1*, Meltem Alemdar
2, Jeremy A. Lingle
2, Roxanne Moore
2and Abdullah Asilkalkan
1Abstract
Typical approaches to assessing students’understanding of the engineering design process (EDP) include performance assessments that are time-consuming to score. It is also possible to use multiple-choice (MC) items to assess the EDP, but researchers and practitioners often view the diagnostic value of this assessment format as limited. However, through the use ofdistractor analysis, it is possible to glean additional insights into student conceptualizations of complex concepts.Using an EDP assessment based on MC items, this study illustrates the value of distractor analysis for exploring students’understanding of the EDP. Specifically, we analyzed 128 seventh grade students’responses to 20 MC items using a distractor analysis technique based on Rasch measurement theory. Our results indicated that students with different levels of achievement have substantively different conceptualizations of the EDP, where there were different probabilities for selecting various answer choices among students with low, medium, and high relative achievement. We also observed statistically significant differences (p< 0.05) in student achievement on several items when we analyzed the data separately by teacher. For these items, we observed different patterns of answer choice probabilities in each classroom. Qualitative results from student interviews corroborated many of the results from the distractor analyses. Together, these results indicated that distractor analysis is a useful approach to explore students’ conceptualization of the EDP, and that this technique provides insight into differences in student achievement across subgroups. We discuss the results in terms of their implications for research and practice.
Introduction
Researchers have found that engineering education in middle school is essential to increase students’awareness of engineering as a career path; therefore, researchers have identified middle school as a crucial period for engineer-ing education (Tafoya et al. 2005). Further, engineerengineer-ing de-sign is a core component of middle school engineering curricula. As a result, effectively measuring middle school students’understanding of the engineering design process is essential.
Approaches to assessing students’ understanding of the engineering design process (EDP) are varied in re-search and practice. Many of the methods are qualita-tive in nature. For example, several researchers have used interviews with both students and teachers to
examine a broad-range of perspectives of the EDP, in-cluding understanding of design practices, as well as variants of approaches and perspectives of design. Alemdar et al. (2017a, 2017b) applied student inter-views to examine student understandings of the design process, perspectives of the collaborative design experi-ence, and recognition of engineering connections to other content areas. Researchers have also incorporated interviews into phenomenological studies for the pur-pose of identifying concepts such as successful engin-eering teaching practices (Adams et al.2003).
In other studies, researchers have used the process of engineering design itself as a data source through methods such as protocol analysis and ethnographies. Protocol analyses explore student approaches to abbrevi-ated design tasks or student responses to design briefs. Field studies and full ethnographies include observations of students as they approach design challenges in the
* Correspondence:[email protected]
1Educational Studies in Psychology, Research Methodology, and Counseling,
The University of Alabama, Box 870231, Tuscaloosa 35487, AL, USA Full list of author information is available at the end of the article
classroom environment. Most often, researchers have used these methods to identify patterns in behavior of participants as they design, either as individuals or as groups. Researchers have used think-aloud protocols with individual students, and they have used analyses of dialog for group-based activities. Generally, researchers use these methods to understand the processes of stu-dent design and the stustu-dent conceptions that underlie their design decisions (Atman et al.2014).
Researchers also frequently use survey methods for the purpose of individual-level assessment. Specifically, re-searchers conduct studies with surveys to gather informa-tion about students’ affective responses to engineering, such as design self-efficacy, the relevance and importance of the EDP, and to identify difficulties that students experi-ence as they approach specific stages or design activities (Atman et al. 2014). Surveys are useful in capturing changes in student perception over time, for example to measure self-efficacy and to determine whether student self-efficacy changes before and after a design experience (Purzer2011).
Another common data source for assessing EDP knowledge is student-produced classroom artifacts. Ar-tifacts may include students’ engineering notebooks or journals, reflective narratives, portfolios, or design products such as prototypes. For example, researchers have examined students’ engineering journals to docu-ment improvedocu-ments in design practices over time (Sobek II 2002). Likewise, researchers have analyzed students’engineering portfolios to examine professional engineering identify formation (Eliot and Turns 2011). For these artifacts, researchers apply evaluative rubrics to quantify student learning, measuring such aspects as communication, engineering practice, design, and ex-periments (Mourtes1999; Williams2001).
These assessment techniques are valuable in that they can provide researchers and practitioners with detailed insight into students’understanding of engineering design. However, in the classroom, the demands of teaching many students (particularly in secondary schools) often prevent teachers’ thoughtful analysis of these products. In con-trast, multiple-choice (MC) items can be scored more quickly, and the results can be incorporated more readily into teachers’ instructional decisions (Briggs et al. 2006). A common criticism of assessments based on MC items is that they provide limited diagnostic information regarding students’conceptualization of complex concepts (Klassen
2006). However, it is possible to construct MC items such that analyses of students’answer choices provide insight into students’conceptualizations of the assessed concept (Haladyna and Rodriguez 2013). In particular, distractor analysisis an approach to examining response patterns on MC items in which students’answer choices are examined alongside measures of achievement. When MC items are
constructed such that the distractors are related to im-portant aspects of student understanding of a particular concept, this analytic approach provides valuable insight into the types of correct and alternative conceptions that are present within a sample of students, as well as insight into the developmental hierarchy of the misconceptions included within the item distractors. This information can be used to inform instructional decisions to target specific areas of student understanding without the use of more time-intensive performance assessment procedures. Re-searchers have discussed and applied distractor analysis techniques in many different content areas, including sci-ence and engineering (discussed further below). However, there has been relatively limited research on the use of distractor analysis in engineering education for middle school students, and limited use of this approach to evalu-ate students’understanding of the EDP. Furthermore, few researchers have used distractor analysis to explore differ-ences in student conceptualizations across subgroups.
Purpose
The primary purpose of this study is to illustrate the diag-nostic value of distractor analysis for exploring middle school students’(grades 6–8) understanding of the EDP. As a secondary purpose, we use distractor analysis to ex-plore differences in student achievement across subgroups. Accordingly, we focus on the following research questions:
1. What does distractor analysis of multiple-choice EDP assessment items reveal about students’ conceptions of the EDP?
2. How can distractor analysis of multiple-choice EDP assessment items be used to understand differences in student performance on individual items across learning environments?
Distractor analysis as a diagnostic tool
Despite the limitations that are commonly associated with assessments based on multiple-choice (MC) items, many practitioners and researchers use assessments with MC items in educational settings. One reason is that MC items are easy to implement and score objectively, thus allowing test users to assess a wide range of content in a single ad-ministration of an assessment. Furthermore, it is possible to construct MC items such that they provide test users with useful diagnostic information about student under-standing (Gierl et al.2017; Thissen et al.1989). Gierl et al. (2017) conducted a comprehensive literature review of the use of MC item distractors in education, and concluded that, when constructed with diagnostic purposes in mind and analyzed appropriately, MC item distractors provide useful diagnostic information.
researchers and practitioners can use to extract diagnos-tic information from MC items whose answer choices are constructed to provide meaningful diagnostic infor-mation, such as alternative conceptions or developmen-tal stages related to a particular concept. Gierl et al. called the first type of distractor analysis traditional dis-tractor analysis. Traditional distractor analysis tech-niques can be conducted using either classical test theory (CTT) or item response theory (IRT) techniques. In both CTT and IRT traditional distractor analyses, re-searchers and practitioners examine patterns of students’ responses at different total scores (CTT) or achievement estimates (IRT) in order to identify the relationship be-tween students’understanding of the particular concept included in the item, including students’tendency to se-lect particular incorrect answer choices, and students’ overall achievement. Such information can be useful for informing theory related to students’ development re-lated to a concept or set of concepts as well as for plan-ning or revising instructional activities. Traditional distractor analysis techniques also include analyses of differential distractor functioning (DDF). DDF analyses provide valuable information about the degree to which individual distractors function in the same way for stu-dent subgroups given the same achievement level (Terzi and Suh 2015; Penfield 2008). Along with differential item functioning (DIF) analyses, DDF can be used for a variety of purposes, including refining existing tests, de-veloping new instruments, and providing validity evi-dence for the interpretation and use of test score inferences.
Second, Gierl et al. describedcontemporary distractor analysisas distractor analysis techniques that are based on relatively more-recent psychometric developments, with the goal of obtaining diagnostic information about students’ understanding using their responses to MC items. In particular, some researchers have integrated cognitive diagnostic methods (CDM) with the construc-tion and analysis of MC item distractors. In tradiconstruc-tional multiple-choice educational tests, the purpose of dis-tractors is just to identify students with limited under-standing or possible misconceptions of the concept being tested. Among these techniques include the use of two-tier items (Treagust 1995). Two-tier items in-clude traditional MC items that are paired with follow-up, open-ended items that ask students to explain why they selected their answer. Researchers have used the two-tiered item approach to explore student miscon-ceptions (Treagust1995) as well as to develop new dis-tractors for MC items (Hestenes et al. 1992). Another example of a contemporary distractor analysis approach is the use of ordered multiple-choice items (Briggs et al. 2006). When test developers construct ordered MC items, they use a learning model to develop distractors
that reflect ordinal, increasing levels of understanding of a particular concept. Then, responses to ordered MC items can be analyzed using IRT models in which par-tial credit is assigned to distractors relative to their proximity to the correct response, such as the ordered partition model (OPM; Wilson 1992). The distinguish-ing feature of the OPM is that multiple answer choices can share the same score. Similar to the OPM, Wang (1998) proposed a distractor model that assigns different levels of difficulty to each distractor and examines model-data fit statistics associated with the distractors. As a final example of contemporary distractor analysis tech-niques, Gierl et al. described de la Torre’s (2009) modified version of the multiple-choice deterministic-input noisy
“and”gate model (DINA; Junker and Sijtsma2001). Essen-tially, researchers use this analytic approach to model stu-dent responses to MC items in order to estimate a profile of“attributes”for each student that represent the particular knowledge, skills, or cognitive processes that the student used to arrive at a particular answer choice.
Distractor analysis in engineering education
As the above review demonstrates, research related to distractor analysis techniques is relatively common in re-search on educational measurement in general (Gierl et al.2017). Several researchers have also examined the use of distractor analysis techniques in the context of engin-eering education. For example, two teams of enginengin-eering education researchers proposed frameworks related to the development and evaluation of curriculum and as-sessment that incorporate distractor analysis as a key component.
analysis techniques based on CTT that reflect the trad-itional distractor analysis approach, as defined by Gierl et al. (2017). Similarly, Kong et al. (2014) proposed a framework to guide the design of curriculum and assess-ment. Focusing on nanotechnology as a content area, these researchers presented distractor analysis as a method through which researchers and practitioners can evaluate and improve assessment instruments made up of MC items, as well as a tool for identifying areas for improve-ments to engineering curricula. Kong et al. illustrated their framework using empirical data from a MC assessment of nanotechnology concepts. Similar to Jorion et al. (2015), these researchers discussed traditional distractor analysis techniques based on CTT.
In addition to these frameworks, several researchers have used distractor analyses in applied research as a diagnostic method for improving instructional practices. For example, Wage et al. (2005) applied traditional dis-tractor analysis techniques based on CTT to assessments in an undergraduate signals and systems course. These researchers used distractor analysis to identify the most common misconceptions, as well as misconceptions that persisted between a ptest and post-test. More re-cently, Peuker et al. (2013) applied traditional distractor analysis techniques based on CTT to an assessment in an undergraduate introductory engineering course. Their study included a comparison of the benefits of con-structed response (CR) and MC-format assessments for informing instructional practices in engineering educa-tion. These researchers concluded that distractor ana-lysis “can give insight to student misconceptions in the same way that the traditional CR problems can provide the instructor information about misunderstandings,” and provide an efficient means through which to incorp-orate this information into instruction (p. 9). Along the same lines, Sengupta et al. (2017) used traditional dis-tractor analysis techniques based on CTT to examine a concept inventory in an undergraduate environmental engineering course. These researchers discussed the ben-efits of distractor analysis as a tool for improving the quality of MC items, as well as a method for improving instructional practices.
In this study, we use a traditional, Rasch-based ap-plication of distractor analysis to examine students’ conceptual understanding of the EDP. We also extend previous research on distractor analysis in general by illustrating a method for using Rasch-based distractor analysis to explore differences in patterns of student responses to MC items related to student subgroups.
Methods
In order to explore the research questions for this study, we used data from middle-school students’responses to a MC EDP assessment that was administered as part of
an experimental engineering curriculum project. After we examined the quantitative data, we also examined qualitative data from a later study of the same student participants in order to more fully understand the quan-titative results. The quanquan-titative data were our primary focus in the analysis, and the qualitative data served a secondary, explanatory role. We collected and analyzed the quantitative and qualitative data separately, and then merged the qualitative results with our quantitative re-sults. Thus, our study can be described as a convergent explanatory design where the quantitative results were primary (Creswell and Plano Clark 2011). We describe the context for data collection, the instruments, and our data analysis methods below.
Context for data collection
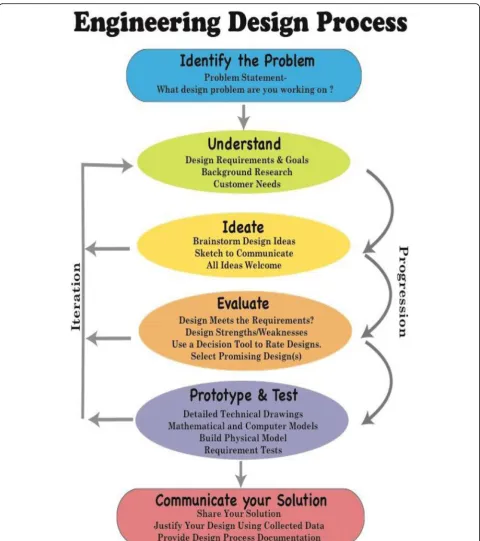
Our data were collected during the implementation of an 18-week STEM-Innovation & Design (STEM-ID) en-gineering curriculum for middle school students.1 Cur-riculum developers iteratively designed the courses based on feedback from teachers and observations of the course in action (Alemdar et al. 2017a, 2017b). The courses were designed around the framework of the en-gineering design process (EDP). Essentially, the EDP is a conceptual model for the application of engineering principles to practical design problems. Researchers and practitioners have used a variety of EDP models as guid-ing frameworks for engineerguid-ing education that vary in terms of specific terms and sequences of activities (Car-berry et al.2010). Figure1includes the specific EDP that was used in the curriculum context from which our data were collected; we provide operational definitions for each stage in our EDP model in Additional file 1. The engineering curriculum was designed to utilize the EDP within a problem-based learning context, combined with an emphasis on science and mathematics practices, as defined by the Next Generation Science Standards (NGSS; NGSS Lead States 2013) and the Standards of Mathematical Practice (Illustrative Mathematics 2014).
Instruments
Multiple choice engineering design process assessment
A team of engineering education experts and psycho-metricians developed a series of MC EDP assessments for each grade level (6th, 7th, and 8th) that corre-sponded to the experimental curriculum. The assess-ments were developed iteratively using a mixed-methods approach (Alemdar et al. 2017a; Wind et al.
additional instruction (for details about the development and students’ interpretations of the distractors, please see Alemdar et al.2017a,2017band Wind et al.2017). Results from previous analyses suggested that the final versions of
the EDP assessments demonstrated acceptable psychomet-ric properties, such that they could be used to evaluate stu-dent achievement following the implementation of the experimental engineering curriculum (see Wind et al.
2017). We provide additional background information about the EDP assessment used in this study, as well as the context in which we collected data in Additional file1.
Student interview protocol
After we collected student responses to the MC items, we collected supplementary qualitative data to inform our interpretation of the quantitative results. Specific-ally, we conducted semi-structured interviews with students using an interview protocol. All of the inter-viewers used the same semi-structured interview proto-col with follow-up questions to elicit rich data that could be subjected to sequential qualitative analysis (Miles et al.2014). We designed the interview protocol around several themes, including students’ understand-ing of the engineerunderstand-ing design process, their perceptions about the course, and the mathematics and science connections. In this study, we focused on interview re-sults related to students’ understanding of the EDP. Specifically, during the relevant section of the inter-view, we asked students to describe the use of the EDP while working on a design challenge. Some of the ques-tions included the following: “Tell me about how you used the Engineering Design Process in your STEM-ID class. Were you ever confused about what you were supposed to do for a certain stage in the engineering design process?”
Participants
In the current analysis, we focused on the Fall 2016 ad-ministration of the EDP assessment for seventh grade students, which included 20 items. A total of 128 stu-dents participated in this assessment who were enrolled in four classrooms in separate schools (teacher 1:N= 39; teacher 2: N= 25; teacher 3: N= 35; teacher 4: N= 29). These sample sizes are within the recommended range for Rasch analyses of low-stakes multiple-choice assess-ments for stable estimates of item or person calibrations within ± 1 logit over replication (Linacre 1994; Wright and Stone1979). Using the interview protocol described above, we collected qualitative data from thirty students from four middle schools.
Data analysis
In order to explore the use of distractor analysis as a method for understanding students’ conceptualizations of the EDP, we used a combination of quantitative and qualitative analytic tools. In light of the purpose of our study, we focused primarily on the results from the quantitative data analysis, and we used qualitative data to inform our interpretations of the quantitative results.
Quantitative data analysis
Our quantitative data analysis procedure consisted of four main steps. First, we calculated measures of student achievement and item difficulty using the dichotomous Rasch model (Rasch 1960). Briefly, the Rasch model is a statistical approach that can be used to examine student responses to items in educational assessments in order to obtain measures of student achievement and item dif-ficulty. This approach is based on a transformation of assessment item responses from an ordinal scale to a log-odds (logit) scale, such that measures of student achievement and item difficulty can be expressed on a common linear scale with equal units.
We selected the Rasch model for our analysis for three reasons. First, this model has been used in previous ap-plications of distractor analysis techniques in STEM education (Herrmann-Abell and DeBoer 2011, 2014; Wind and Gale2015). Second, the EDP assessment was developed based on the Rasch model (Wind et al.2017). Finally, the Rasch model leads to a straightforward inter-pretation of student achievement and item difficulty that facilitates the interpretation of results from the dis-tractor analysis procedure. The model can be stated in log-odds form as follows:
ln½Pniðx¼1Þ=Pniðx¼0Þ ¼θn−δi ð1Þ
whereln[Pni(x= 1)/Pni(x= 0)] is the log of the odds that a
stu-dentnprovides a correct response to itemi, rather than an incorrect response; θn is the location of student n on the logit scale; andδiis the location of itemion the logit scale. Student measures reflect student achievement levels, where higher values indicate higher achievement, and lower values indicate lower achievement. Likewise, item locations reflect item difficulty. For items, higher locations suggest more dif-ficult items, and lower locations suggest easier items. We conducted the Rasch analysis using the Facets™ software program (Linacre2015).
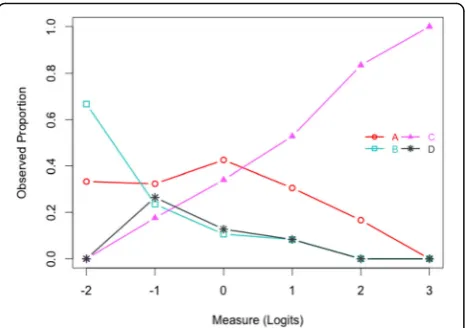
To interpret the distractor analysis results, we con-structed graphical displays that illustrate the relation-ship between measures of student achievement and the probability of selecting each of the four answer choices. Figure 2 is an example of a distractor analysis plot cal-culated using student achievement estimates from the Rasch model. The x-axis shows Rasch-model estimates of student achievement. The lines in the plot show the proportion of students (y-axis) who selected each swer choice, where different lines are used for each an-swer choice. The correct anan-swer for the example item is C. As might be expected, the proportion of students selecting answer choice C increased across increasing levels of student achievement. One can obtain add-itional information about students’ answer choices by examining the proportion of students who selected the three incorrect answer choices in relation to student achievement. Specifically, beginning with the lowest-achieving students (farthest left on the x-axis), students with the lowest overall achievement levels were most-often attracted to answer choice B, followed by answer choice A. Moving to the right, students with slightly higher achievement levels were most often attracted to answer choice A. Answer choice A remained the most popular distractor for all other achievement levels.
In step three, we identified items on the EDP assess-ment on which students in the four classrooms had sig-nificantly different performance using an extension of the Rasch model that included an additional variable
for classrooms. Specifically, we specified a Many-Facet Rasch (MFR) model (Linacre 1989) with a facet for classrooms as follows:
ln½Pnigðx¼1Þ=Pnigðx¼0Þ ¼θn−δi−ηg ð2Þ
where θn and δi are defined as in Eq. 1, and ηg is de-fined as the average achievement level of students within classroom g. We estimated this model using Facets (Linacre 2015).
Using Eq. 2, we examined differences in student achievement across classrooms related to individual items. Specifically, we used the Facets computer pro-gram to calculate the difficulty of each EDP assessment item separately for each classroom. Then, we used pair-wise analyses (ttests) to determine whether the difficulty of individual items were significantly different across the classrooms. This test is appropriate for comparing item estimates between classrooms because the item esti-mates are calculated on an interval-level scale.
Finally, in step four, we constructed distractor plots separately for the classrooms between which we ob-served significant differences in item difficulty. After constructing the graphical distractor analysis plots, we used substantive theory related to the EDP, information from the curricular context, and results from the quali-tative analyses (described below) to interpret the pat-terns revealed by the distractor plots.
Qualitative data analysis
We used the NVIVO™ software program to code and analyze the student interviews according to a sequential qualitative analysis process (Miles et al. 2014). We com-pleted qualitative coding in two phases. In the first phase, a single coder categorized student responses according to the major topic areas included in the interview protocol. In the next phase, a group of four coders applied a provisional list of sub-codes to a cross-sectional sample of interview tran-scripts. These sub-codes included process codes aligned to individual phases of the EDP (e.g., problem identification, prototyping, and testing solutions) and magnitude codes in-dicating positive and negative examples.
Mixed-methods analysis
After we collected and analyzed the quantitative and qualitative data, we merged the results from the qualita-tive analysis with the results from our quantitaqualita-tive ana-lyses. Specifically, we used the qualitative interview data to inform our interpretation of step two (distractor ana-lysis for EDP items based on the complete sample) and step four (distractor analysis across teachers) of our quantitative analyses.
Results
Step one: overall calibration of the EDP assessment
Before we conducted our analyses, we checked the Rasch model assumptions of unidimensionality (i.e., student responses to the assessment items are primarily due to only one latent variable), and local independence (i.e., after controlling for the latent variable of interest, there are no systematic relationships or dependencies among students’ responses to the items). We checked the unidimensionality assumption using a principal components analysis of the residuals, or differences be-tween the observed responses and the responses that would be expected based on the Rasch estimates (Lina-cre 1998). This analysis allowed us to check for any meaningful patterns in residuals that suggest that more than one latent variable significantly contributed to stu-dent responses. We checked the local independence assumption by calculating correlations between the re-siduals associated with each item.
In the combined sample (all of the classrooms), the Rasch measures explained 22.23% of the variance in re-sponses; this value is evidence of acceptable adherence to the assumption of unidimensionality for Rasch ana-lyses, because it is higher than the generally accepted critical value of 20% for analyzing potentially multidi-mensional instruments (Reckase1979). Furthermore, we examined the inter-item correlations of model residuals within the combined sample; these values were less than 0.30. We also observed adherence to the Rasch assump-tions within the individual school sites. Specifically, the Rasch measures explained > 20% of the variance in
students’responses for each of the classrooms. Further-more, the inter-item correlations of model residuals were less than 0.30 for all of the classrooms. Because all of our sub-samples approximated the Rasch model as-sumptions, we proceeded with our analyses.
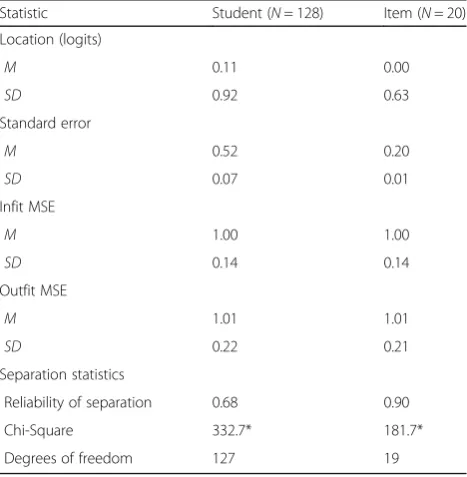
Table1 summarizes the results from the first step of the data analysis procedure. The average estimated student measure was θ= 0.11 (SD= 0.92), which is near the average estimated item difficulty location (mean δ= 0.00; SD= 0.63). This result suggests that the assessment was targeted well to the group of sev-enth grade students. The relatively low standard errors (SE) for student estimates (M= 0.52, SD= 0.07) and item estimates (M= 0.20, SD= 0.01) provide additional evidence of precision for the Rasch estimates. The average student SE is larger than the average item SE because there are more observations of each item (128 students responded to each item) compared to the ob-servations of each student (each student is observed using 20 items). Nonetheless, these SEs are within the ranges that other researchers have reported for low-stakes MC tests in a variety of educational do-mains (Bond and Fox 2015).
Furthermore, average values of model-data fit statis-tics are within the range of values that previous re-searchers have established as expected when there is acceptable fit to the Rasch model (MSE fit statistics around 1.00; Smith 2004; Wu and Adams 2013). For items, the Rasch reliability of separation statistic indi-cated significant differences in difficulty across the in-dividual items (Rel= 0.90); however, the reliability of separation statistic for students was notably lower (Rel= 0.60), suggesting that there were several groups of students who had similar levels of achievement. Taken together, the practical implication of these re-sults is that the distractor analyses can be meaning-fully interpreted in terms of students’ understanding of the EDP.
Step two: distractor analysis for EDP items based on the complete sample
For all 20 items, the correct response was associated with the highest average achievement level. These results suggest that the answer choices for the MC EDP items were functioning as intended. Accordingly, we examined students’ responses to the EDP items using distractor analysis plots. We illustrate the results from this step using four example items: item 12, item 14, item 17, and item 19. We selected these example items for two main reasons. First, they represent different stages of the EDP. Second, these items provide clear examples of the types of patterns of student answer choices that we observed over all 20 items.
Table 1Summary statistics from the dichotomous Rasch model
Statistic Student (N= 128) Item (N= 20)
Location (logits)
M 0.11 0.00
SD 0.92 0.63
Standard error
M 0.52 0.20
SD 0.07 0.01
Infit MSE
M 1.00 1.00
SD 0.14 0.14
Outfit MSE
M 1.01 1.01
SD 0.22 0.21
Separation statistics
Reliability of separation 0.68 0.90
Chi-Square 332.7* 181.7*
Degrees of freedom 127 19
Item 12
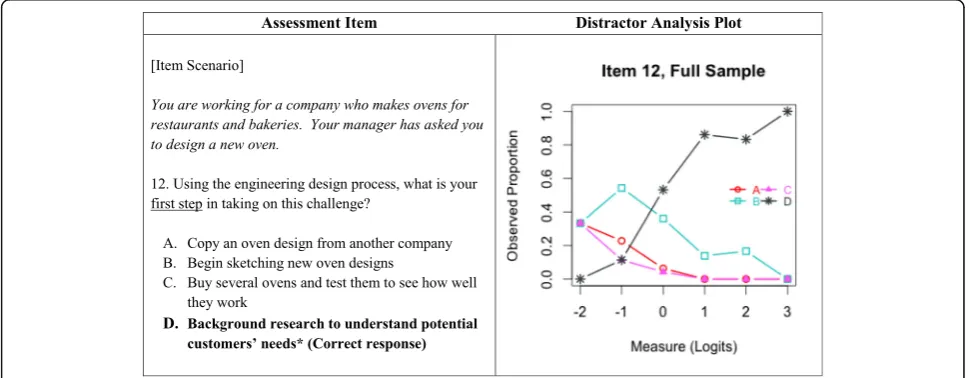
Item 12 was developed to assess students’understanding of the Identify the Problem stage of the EDP, as well as their general understanding of the EDP as a process. To answer this item, students had to consider a scenario in which they were asked to design a new oven for a com-pany that makes ovens for restaurants and bakeries, and identify the first step in this process according to the EDP. We present the text and distractor analysis plot for item 12 in Fig.3. Examination of the plot reveals several interesting aspects of student understanding related to the first stage of the EDP. First of all, the proportion of students who selected the correct response (D) increased across increasing levels of student achievement— sug-gesting that the highest-achieving students had the expected understanding of this stage of the EDP. Next, it is interesting to note that the second-most prominent answer choice was distractor B, followed by distractor C. This pattern suggests that students who did not select the correct answer appeared to skip ahead in the EDP to the Ideatestage, as reflected in answer choice B, or the Prototype & Teststage, as reflected in answer choice C.
Item 14
Item 14 was developed to assess students’understanding of theEvaluateand theCommunicate your Solutionstages of the EDP. This item asked students to identify relevant de-sign details to communicate to the manager of an oven company (see Fig.4). As expected, the proportion of stu-dents who selected the correct response (D) increased across increasing achievement levels; likewise, students were less attracted to each of the distractors as achievement
levels increased. Among those students who selected incor-rect responses, students selected distractor A most often, followed by distractor B. Inspection of the three most popular answer choices (D (correct response), A, and B) in-dicates that students recognized that a company manager may not be interested in results from early stages of the EDP, as reflected in distractor C, but had some difficulty determining which of the other details would be most relevant for the specified customer. The results from our qualitative analyses of student interviews reflected similar findings. For example, one student described the Commu-nicate your Solution stage as follows: “Communicating your solution, like thinking of what to say, specific things you have to think and to tell other people to get your product. That’s really hard, too.” In general, student re-sponses to the interview questions suggested that students have a general grasp of what is needed to communicate with a client, but that this step is difficult.
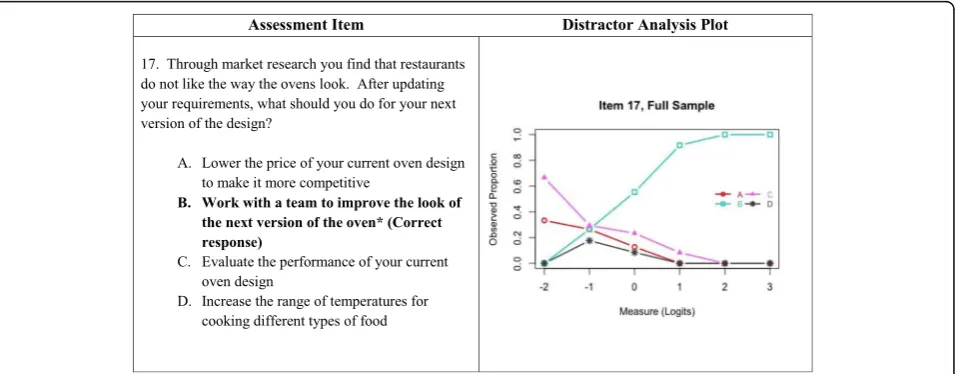
Item 17
Item 17 was intended to evaluate students’ under-standing of the Understand stage of the EDP. This item asked students to determine an appropriate next step after learning that customers do not prefer the visual characteristics of an oven design (see Fig.5). As expected, the proportion of students who selected the cor-rect response (B) increased across increasing achievement levels, suggesting that high achieving students had the ex-pected understanding of this stage of the EDP. Across the range of achievement levels, students who provided incor-rect responses to this item selected distractor C most
often. Examination of the other distractors indicates that most of the students recognized that the appropriate next step according to the EDP involved revising the design of the oven, as reflected in distractor C. Students who se-lected distractor C focused on theperformanceof the oven rather than the visual characteristics of the design.
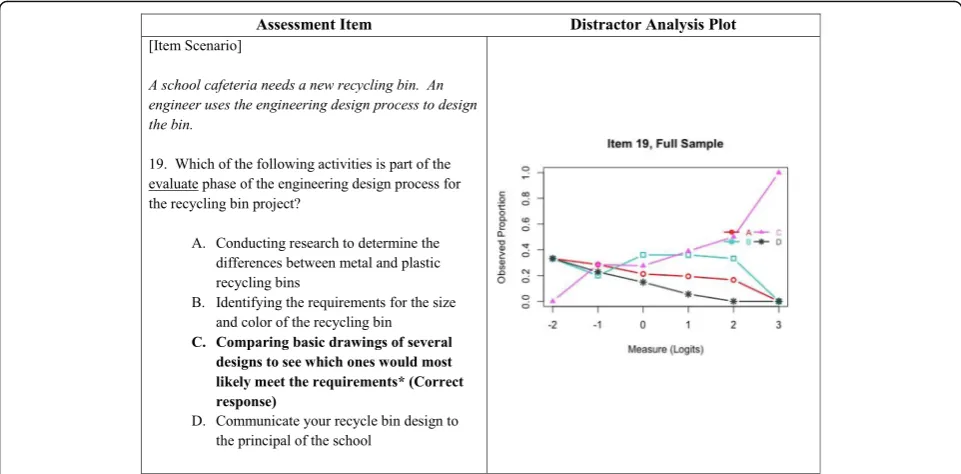
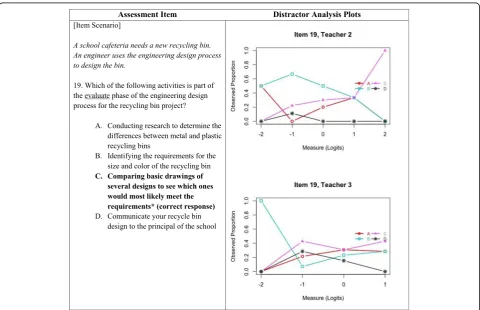
Item 19
Item 19 was intended to assess students’understanding of the Evaluate stage of the EDP. This item asked students
to identify an activity that reflects the Evaluate stage of the EDP with regard to the design of a recycling bin for a school cafeteria (see Fig. 6). The correct answer for this item is C. Compared to the previous example items, students’responses to item 19 were more evenly distrib-uted among all four answer choices. Although the highest-achieving students selected the correct response most often, the lowest-achieving students (θ< 0) were equally attracted to the three distractors. Students with middle-range achievement (0≤θ≤1) selected distractor B most
Fig. 4Distractor analysis plot for item 14: full sample. The plot shows patterns of student answer choices for item 14 within the entire sample. Thex-axis displays estimates of student achievement. Student achievement estimates are shown in logits, and these estimates were calculated using the Rasch model. Low values indicate lower achievement, and high values indicate higher achievement. They-axis shows the observed proportion of responses for a given answer choice. The lines in the plot show the proportion of students who selected each of the four answer choices (A, B, C, or D) at each level of achievement. For this item, the correct response is D (black line with asterisk plotting symbols)
Fig. 5Distractor analysis plot for item 17: full sample. The plot shows patterns of student answer choices for item 5 within the entire sample. The
often. Interestingly, the activity described in distractor B in-volves aspects of the correct response, in that the engineer considers the requirements for the recycling bin—indicating that students who selected this answer choice may have had some emerging understanding of theEvaluatestage of the EDP. Student responses during the interviews often indi-cated an understanding of the purpose of theEvaluatestage, which is to choose a design based on how likely it is to meet the requirements. For example, when asked how a wing de-sign was selected from among the potential airplane dede-signs, one student responded: “We decided based on how we would meet your requirements and what would be the best possible choice for it.”However, some students did not understand this purpose. For example, in the fol-lowing quotation, a student explains that the wing de-sign choice was based upon personal preference.
Interviewer:“How did you decide which one you were going to try?”
Student:“Because I’ve always had a favorite plane. You know the planes that they got the low wings and those little standup things on the end? That’s my favorite plane. I don’t know what it’s called but it’s my favorite plane. I always do that one. That’s how I chose my plane.”
Together, our qualitative analyses of student interview responses corroborate our quantitative results. That is, the
students who did not fully understand the purpose of the Evaluate stage of the EDP demonstrated some confusion with regard to the purpose of this stage, which may have led them to select incorrect answer choices.
Step three: items with different difficulty levels across classrooms
The third step in our data analysis procedure was to iden-tify differences in item difficulty across the four classrooms of students who participated in the administration of the EDP assessment using the MFR model (Eq. 2; Linacre
1989). We observed seven items for which there were sta-tistically significant differences in difficulty between at least two classrooms (p< 0.05): items 1, 2, 3, 7, 9, 16, and 19.
Step four: distractor analysis across teachers
For each the items that we identified in step three, we constructed distractor analysis plots separately using the data from students in each of the four teachers’ class-rooms. We created these teacher-level plots for items for which we observed statistically significant differences in item difficulty. We illustrate our procedure for exploring students’responses separately by teacher using three ex-ample items: item 7, item 9, and item 19.
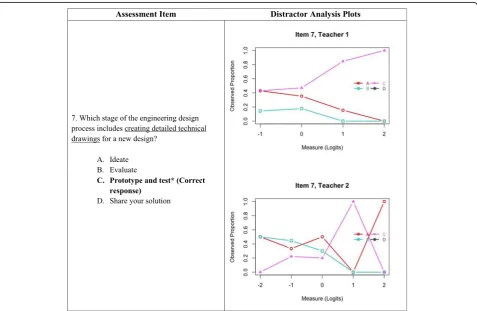
Item 7
Item 7 was intended to assess students’ understanding of the Prototyping & Testing stage of the EDP. This
item asked students to identify the stage of the EDP during which engineers create detailed technical draw-ings for a new design. For this item, we observed statis-tically significant differences in achievement between students who were instructed by teacher 1 and teacher 2. Accordingly, we constructed distractor analysis plots separately for these two subgroups of students (see Fig. 7). For all of teacher 1’s students, the correct re-sponse (C) was the most popular answer choice, and no students selected answer choice D. Because distractors A and B reflect earlier stages in the EDP than the correct an-swer choice (Prototype & Testing), these results suggest that the students in teacher 1’s classroom understood that creat-ing technical drawcreat-ings is an activity that occurs before the final stages of the EDP. Students’answer choices were more varied in teacher 2’s classroom. In this classroom, stu-dents with the lowest achievement level were most often attracted to answer choices B and A. Similar to teacher 1’s students, none of teacher 2’s selected an-swer choice D. However, it is interesting to note that,
for teacher 2’s students, the correct response was only the most popular answer choice among students with achievement levels around θ= 1. Students with the highest achievement levels (θ≥1) selected answer choice A most often. Results from our qualitative ana-lyses suggested that students’ confusion between the Prototyping & Testing stage and other stages is often due to the students’ desire to quickly move through the stages in order to create a prototype, as illustrated by the following quotations from a student interview:
Interviewer: “Have there ever been times when you’ve skipped any of these stages or noticed other students skipping any of the stages?”
Student: “Someone skipped Ideate in my last class. Theirs just completely failed. Their catapult completely failed. Last year we had to make a game for a carnival, it had to do with a catapult and shooting it. It hit none of the points.”
Interviewer:“That’s interesting. In your class, how do you know that they skipped that stage?”
Student:“Because after they thought of the idea, they just skipped right into making the prototype.”
In this interview excerpt, the student described a situ-ation where their classmates skipped a stage of the EDP—thus corroborating the results from our distractor analysis, which indicated confusion about the sequence of activities in the EDP.
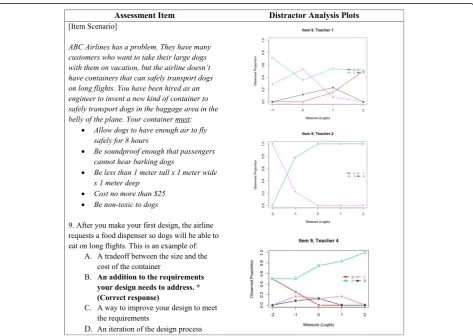
Item 9
Item 9 was intended to assess students’ understanding of theUnderstandstage of the EDP. This item is based on a scenario where students are asked to consider a set of design requirements for a dog container to be used in air-planes. To answer the item, students were asked to con-sider a new customer request and determine what the
new request represents with regard to the EDP. For this item, we observed statistically significant differences in achievement between students who were instructed by teacher 1 and teacher 2, as well as between the students who were instructed by teacher 1 and teacher 4. Accord-ingly, we constructed distractor analysis plots separately for the students who were instructed by teacher 1, teacher 2, and teacher 4 (see Fig.8). Among teacher 1’s students, it is interesting to note that the correct response was the most popular answer choice for the lowest-achieving stu-dents, as well as among high-achieving students. However, for students with mid-range achievement (θ around 0), distractor C was most popular. Furthermore, an equal proportion of the highest-achieving students in this class-room selected the correct response (B) as well as dis-tractor A. On the other hand, students in classroom 2 were only attracted to one distractor (C). Finally, among teacher 4’s students, the correct response was the most popular for students with all achievement levels. However,
for the lowest-achieving students who did not answer item 9 correctly, distractor A was most attractive. Based on the quantitative results, this item was effective at identifying students who had a sophisticated understanding of the role of requirements in engineering design, specifically with regard toaddinga requirement (Understand). In the qualitative data, we identified several students who ap-peared to combine this stage with activities typically in-cluded in theIdeatestage:
Interviewer: What sort of things did you do to understand the problem?
Student: We looked up some websites that were going to help us in the cell phone holder, and we designed some sketches on paper to what we liked.
In this example, the student demonstrated some con-fusion with regard to the unique characteristics of the Understandstage of the EDP.
Item 19
Our final example of teacher-level distractor analysis is item 19. As we noted above, item 19 was intended to as-sess students’understanding of theEvaluatestage of the EDP, and the item asks students to identify an activity that is part of this stage. For this item, we observed sta-tistically significant differences in achievement between students who were instructed by teacher 2 and teacher 3; accordingly, Fig. 9 includes distractor analysis plots for these subgroups of students. Among teacher 2’s students, students with the lowest achievement levels (θ <−1) were most often attracted to distractors B and A. According to the EDP used in the experimental curricu-lum, the activities included in these stages precede Evaluate. Accordingly, these students’responses indicate that they were able to eliminate activities associated with the final stages of the EDP, as reflected in answer choice D. Among teacher 3’s students who did not provide a correct response to item 19, students with the lowest achievement levels (θ≤ −1) were attracted to answer
choice B most often. Although the proportion of stu-dents selecting the correct response decreased slightly in some intervals across increasing achievement levels, it was the most popular answer choice for students with mid-range and high achievement levels.
Conclusions
In this study, we used distractor analysis to explore stu-dents’understanding of the EDP in the context of an ex-perimental engineering curriculum for middle school students. Specifically, we examined the alignment between students’ overall proficiency levels on a multiple-choice EDP assessment and the probability that they selected cer-tain answer choices. Because the assessment items were developed such that the answer choices reflected alterna-tive conceptions related to engineering in general or par-ticular stages in the EDP that could be addressed with additional instruction, patterns of students’responses over different levels of achievement provided insight into the relationship between students’ overall achievement and their conceptualizations of the EDP. We also considered differences in patterns of students’responses between sub-groups of students. In particular, for items on which we observed differences in student performance, we used dis-tractor analysis techniques to explore further the differ-ences in students’conceptualizations of the EDP that may have contributed to different overall performance between subgroups.
Overall, our results suggested that distractor analysis provides insight into students’conceptualizations of the EDP across different levels of achievement. Our obser-vation that students with different achievement levels selected different incorrect answer choices suggests that students with different levels of overall achievement may have different conceptualizations of the EDP stages. By examining patterns of student responses to individual items, we were able to identify particular stages of the EDP that relatively lower-achieving students struggled to understand in general, and stages of the EDP that students may have been inclined to skip or use out of order.
During our analysis of semi-structured qualitative in-terviews with students related to the EDP inin-terviews, students expressed many of the same findings that we observed using distractor analysis—that is, that there were certain stages of the EDP that relatively lower-achieving students struggled to understand, and stages of the EDP that students may have been inclined to skip or use out of order. For example, in our distractor analysis of item 14, which asked students to identify relevant details to communicate to a company manager, we observed that students had some difficulty deter-mining the specific details that would be most relevant for the specified customer. Results from student inter-views reflected a similar finding. Specifically, students’
responses to the interview questions suggested that stu-dents have a general grasp of what is needed to com-municate with a client, but that this step is difficult. Further, in our distractor analysis of item 19, which asked students to identify an activity that reflects the Evaluate stage of the EDP, we found that students had some difficulty in distinguishing the unique characteris-tics of this stage from other stages in the EDP. Student responses during the interviews often indicated an un-derstanding of the purpose of theEvaluatestage, which is to choose a design based on how likely it is to meet the requirements. However, some students demon-strated confusion with regard to the activities that cor-respond to this stage.
Our distractor analysis results also revealed stages of the EDP that students were inclined to skip over when consid-ering a design challenge. In particular, our analyses of item 7 and item 12 revealed that students who did not select the correct answer choice experienced confusion related to the appropriate sequence of EDP stages. Students expressed similar difficulties during our interviews. For ex-ample, several students expressed confusion between the Prototype and Teststage and other stages in the EDP. Fur-thermore, student responses suggested that their confusion between EDP stages is often due to their desire to quickly move through the stages in order to create a prototype— similar to our distractor analysis results for item 7 and item 12.
The results from our comparison of patterns of stu-dent answer choices across teachers were also interest-ing. Although all of the teachers who participated in our study received the same professional development with regard to the experimental curriculum and all of the students participated in the same curriculum, we observed different patterns of answer choices on the items for which there were significant differences in student achievement. In other words, students who se-lected incorrect responses appeared to do so for different reasons across classrooms. These results provide a starting point for additional research on differences in student achievement related to the EDP, and how achievement dif-ferences correspond to various misconceptions.
Implications for engineering education
practices. As we noted earlier, although several re-searchers have applied distractor analysis techniques to science education (Herrmann-Abell and DeBoer 2011,
2014; Wind and Gale 2015), researchers have not yet used distractor analysis to explore students’ responses to MC items in the context of engineering education. Accordingly, our study provides initial insight into the use of distractor analysis as a method for exploring stu-dents’conceptualizations of engineering concepts. When contrasted with other forms of engineering assessment that are intended to help researchers and practitioners understand students’conceptualizations of the EDP, such as engineering notebooks, distractor analysis of MC items is a promising alternative. In particular, when used with purposefully constructed MC items, distractor analysis techniques can provide researchers and practitioners with a potentially less time-consuming method by which to gain insight into students’ understanding of engineering concepts. This approach is particularly promising when other approaches to assessing student understanding of the EDP are not practical. The approach that we demon-strated in our study can provide insight into student con-ceptualizations of EDP stages beyond the typical“correct/ incorrect”scoring procedures for MC assessments.
Our findings are particularly meaningful in light of re-cent emphases on engineering design as a key compo-nent of student proficiency in the integrated Science, Technology, Engineering, and Mathematics (STEM) dis-ciplines (e.g., Borgford-Parnell et al.2010; Cardella et al.
2008; Kelly 2014; Kolmos and De Graff 2014). Further-more, current STEM curricula in the USA emphasize student proficiency in engineering as a key component of college and career readiness (Auyang2004; Carr et al.
2012). Despite the importance placed on engineering education in policy and practice, there has been rela-tively limited attention in research on the development of psychometrically sound engineering assessment tech-niques. In this study, we illustrated a method that re-searchers and practitioners can use to explore the results from MC engineering assessments from a diagnostic perspective. In practice, researchers and practitioners can apply the techniques that we illustrated here to other MC assessments of engineering concepts. As we observed in this study, such analyses can provide insight into student conceptualizations of engineering concepts.
Furthermore, researchers and practitioners can use the distractor analysis techniques that we illustrated in this study as a diagnostic tool to evaluate the performance of distractors in MC items in order to improve assessment practices in engineering education. For example, distractor analysis techniques can help researchers and practitioners identify individual distractors in MC items that are not providing useful diagnostic information, or that might be eliciting confusion from otherwise high-achieving
students. For example, evidence that none or very few of a sample of students selected a particular distractor may suggest that the answer choice is not helpful for distin-guishing among students with different levels of under-standing for a particular concept. Furthermore, evidence that otherwise high-achieving students are most attracted to a distractor rather than the correct answer choice may suggest a need to revise the distractor so that it does not introduce unnecessary confusion. Likewise, as we ob-served in our analysis of item 9, evidence that the lowest-achieving students are most attracted to the correct an-swer, while students with higher levels of achievement se-lect distractors may suggest confusion related to particular distractors that may encourage guessing from low-achiev-ing students.
Finally, our results suggest that researchers and practi-tioners can use distractor analysis techniques as a diagnos-tic tool for exploring differences among subgroups of students in terms of their conceptualization of the EDP. In this study, we used distractor analysis techniques to in-vestigate differences in patterns of students’ responses within different classrooms for items on which we ob-served differences in student performance. This approach allowed us to understand the degree to which differences in students’ conceptualizations of the EDP within these subgroups may have contributed to differences in their performance on the MC items. In practice, researchers and practitioners can use distractor analysis techniques to explore how achievement differences between other sub-groups of students, such as demographic subsub-groups, may be related to different patterns of alternate conceptions that are reflected in MC item distractors.
Implications for research on distractor analysis
of more time-intensive performance assessment procedures.
Limitations and directions for future research
Our study has several limitations that researchers and practitioners should consider before generalizing the re-sults to other contexts. First, we conducted our analyses using data from seventh grade students who participated in an experimental middle grades engineering curriculum project in the USA. Likewise, we used data from one MC engineering assessment instrument. Our student sample and assessment instrument may not reflect the character-istics of other student populations and MC engineering assessments. Accordingly, we encourage researchers and practitioners to consider the alignment between the stu-dent sample and instrument that we used in this study and other populations of students and assessment instru-ments before generalizing our results. In future studies, researchers could explore the use of distractor analysis in other engineering education contexts in order to provide additional insight into the generalizability of our findings. In particular, we encourage researchers to explore the generalizability of our findings to larger samples of stu-dents than the sample that we included in this analysis. Along the same lines, we encourage researchers to con-duct additional mixed-methods studies in which they explore student the alignment between student conceptu-alizations of the EDP and their specific answer choices to MC items. Specifically, researchers might use a sequential exploratory mixed-methods design in which they begin with a distractor analysis, and design qualitative data col-lection to purposefully target students who selected par-ticular answer choices. Such analyses would provide additional insight into the interpretation of distractor ana-lysis as a method for exploring student understanding of the EDP.
Second, it is important to note that we focused on one type of distractor analysis. Other types of distractor ana-lysis, including methods based on cognitive diagnostic models or other distractor analysis models, may provide different information about students’ response patterns. In future studies, researchers should apply distractor analysis techniques besides the methods that we used in this study to MC engineering assessments.
It is also important to note that the degree to which one can gain insight into students’conceptualizations of the EDP using distractor analysis is somewhat lim-ited compared to other approaches, such as qualitative analyses of engineering design notebooks and inter-views with students. Nonetheless, our findings suggest that distractor analysis provides valuable initial insight into student conceptualizations of the EDP that can serve as a starting place from which to inform add-itional investigations. In future studies, we encourage
researchers to consider other forms of mixed-methods designs in which they combine distractor analysis techniques with qualitative methods in order to more fully understand students’ conceptualizations of the EDP.
Finally, it is important to note that we used distractor analysis techniques to explore students’ understanding of the EDP. We did not directly explore how teachers could use the results from such analyses to inform their approach and pedagogy, or the effectiveness of distractor analysis results for this purpose. In future studies, re-searchers could explore the implications of using dis-tractor analysis results to inform teaching practices.
Endnotes 1
This study was approved by the IRB at Georgia Insti-tute of Technology, protocol number H13201.
Additional file
Additional file 1:Background information about the Engineering Design Process assessment. (DOCX 23 kb)
Acknowledgements
The authors wish to acknowledge Dr. Jessica D. Gale and Dr. Sunni Newton for their assistance with data collection.
Funding
This research was supported by a grant from the National Science Foundation, grant # 1238089. Any opinions, findings, and conclusions or recommendations expressed in these materials are those of the author(s) and do not necessarily reflect the views of the National Science Foundation.
Availability of data and materials
Please contact the corresponding author for data requests.
Authors’contributions
SW, MA, JL, and RM designed the assessments used to collect data for this study. SW proposed the research questions and analytic approach, analyzed the data, and drafted most of the manuscript sections. AA assisted with the literature review and construction of the distractor analysis plots. MA, JL, and RM offered comments, revised the manuscript, and provided editorial suggestions. All of the authors read and approved of the final manuscript.
Ethics approval and consent to participate
The Institutional Review Board for Georgia Institute of Technology has approved the study reported in this manuscript. Parental consent and student assent procedure are in place per IRB requirement. The IRB protocol identification number is #H13201. Additional documentation related to IRB approval is available from the corresponding author.
Consent for publication Not applicable.
Competing interests
The authors declare that they have no competing interests.
Publisher’s Note
Author details
1Educational Studies in Psychology, Research Methodology, and Counseling,
The University of Alabama, Box 870231, Tuscaloosa 35487, AL, USA.2Georgia
Institute of Technology, Atlanta, GA, USA.
Received: 19 June 2018 Accepted: 20 December 2018
References
Adams, R. S., Turns, J., & Atman, C. J. (2003). Education effective engineering designers: the role of reflective practice.Design Studies, 24(3), 275–294. Alemdar, M., Lingle, J. A., Moore, R., & Wind, S. A. (2017a). Developing an
engineering design process assessment using think-aloud interviews.
International Journal of Engineering Education, 33(1(B)), 441–452.
Alemdar, M., Lingle, J. A., Newton, S., Moore, R., Rosen, J., & Usselman, M. (2017b). Students’perceptions of middle school STEM innovation and design course. In Proceedings of the ASEE 2017 Annual Conference. Columbus, OH. Atman, C. J., Eris, O., McDonnell, J., Cardella, M. E., & Borgford-Parnell, J. L. (2014).
Engineering design education: research, practice, and examples that link the two. In J. Aditya & B. M. Olds (Eds.),Cambridge handbook of engineering education research(pp. 201–225). Cambridge: Cambridge University Press. Auyang, S. Y. (2004).Engineering—an endless frontier. Cambridge, MA: Harvard
University Press.
Borgford-Parnell, J., Deibel, K., & Atman, C. J. (2010). From engineering design research to engineering pedagogy: bringing research results directly to the students.International Journal of Engineering Education, 26(4), 748–759. Briggs, D. C., Alonzo, A. C., Schwab, C., & Wilson, M. (2006). Diagnostic assessment
with ordered multiple-choice items.Educational Assessment, 11(1), 33–63 https://doi.org/10.1207/s15326977ea1101_2.
Carberry, A. R., Lee, H.-S., & Ohland, M. W. (2010). Measuring engineering design self-efficacy.Journal of Engineering Education, 99(1), 71–79 https://doi.org/10. 1002/j.2168-9830.2010.tb01043.x.
Cardella, M., Atman, C. J., Turns, J., & Adams, R. (2008). Students with differing design processes as freshmen: case studies on change.International Journal of Engineering Education, 24(2), 246–259.
Carr, R. L., Bennett, L. D., & Strobel, J. (2012). Engineering in the K-12 STEM standards of the 50 U.S. states: an analysis of presence and extent.Journal of Engineering Education, 101(3), 1–26.
Creswell, J. W., & Plano Clark, V. L. (2011).Designing and conducting mixed methods research. Thousand Oaks, CA: Sage.
de la Torre, J. (2009). A cognitive diagnosis model for cognitively based multiple-choice options.Applied Psychological Measurement, 33(3), 163–183 https://doi. org/10.1177/0146621608320523.
Eliot, M., & Turns, J. (2011). Constructing professional portfolios: sense-making and professional identity development for engineer undergraduates.Journal of Engineering Education, 100(4), 630–654.
Gierl, M. J., Bulut, O., Guo, Q., & Zhang, X. (2017). Developing, analyzing, and using distractors for multiple-choice tests in education: a comprehensive review.Review of Educational Research, 87(6), 1082–1116.
Haladyna, G., & Rodriguez, M. C. (2013).Developing and validating test items. New York, NY: Routledge.
Herrmann-Abell, C. F., & DeBoer, G. E. (2011). Using distractor-driven standards-based multiple-choice assessments and Rasch modeling to investigate hierarchies of chemistry misconceptions and detect structural problems with individual items.Chemistry Education Research and Practice, 12(2), 184–192.
Herrmann-Abell, C. F., & DeBoer, G. E. (2014). Developing and using distractor-driven multiple-choice assessments aligned to ideas about energy forms, transformation, transfer, and conservation. In R. F. Chen, A. Eisenkraft, D. Fortus, J. Krajcik, K. Neumann, J. Nordine, & A. Scheff (Eds.),Teaching and learning of energy in K–12 education (pp. 103–133). Springer.
Hestenes, D., Wells, M., & Swackhamer, G. (1992). Force concept inventory.The Physics Teacher, 30(3), 141–158.
Jorion, N., Gane, B. D., James, K., Schroeder, L., DiBello, L. V., & Pellegrino, J. W. (2015). An analytic framework for evaluating the validity of concept inventory claims.Journal of Engineering Education, 104(4), 454–496.
Junker, B. W., & Sijtsma, K. (2001). Cognitive assessment models with few assumptions, and connections with nonparametric item response theory.
Applied Psychological Measurement, 25(3), 258–272https://doi.org/10.1177/ 01466210122032064.
Kelly, A. F. (2014). Design-based research in engineering education: current state and next steps. In A. Johri & B. M. Olds (Eds.),Handbook of engineering education research(pp. 497–518). New York, NY: Cambridge University Press. Klassen, S. (2006). Contextual assessment in science education: background,
issues, and policy.Science Education, 90(5), 820–851.
Kolmos, A., & De Graff, E. (2014). Problem-based and project-based learning in engineering education. In Handbook of engineering education research(pp. 797–518). New York, NY: Cambridge University Press.
Kong, Y., Diefes-Dux, H. A., Rodgers, K. J., Douglas, K. A., & Madhavan, K. (2014). Development and validation of a nano size and scale instrument (NSSI). In
2014 IEEE Frontiers in Education Conference (FIE) (pp. 1–4). IEEEhttps://doi.org/ 10.1109/FIE.2014.7044332.
Linacre, J. M. (1989).Many-facet Rasch measurement. Chicago, IL: MESA Press. Linacre, J. M. (1994). Sample size and item calibration stability.Rasch
Measurement Transactions, 7(4), 328.
Linacre, J. M. (1998). Structure in Rasch residuals: Why principal components analysis (PCA)?Rasch Measurement Transactions, 12(2), 636.
Linacre, J. M. (2015).Facets Rasch measurement (version 3.71.4). Chicago, IL: Winsteps.com.
Marra, R., Jonassen, D. H., Palmer, B., & Luft, S. (2014). Why problem-based learning works: Theoretical foundations.Journal on Excellence in College Teaching, 25(3&4), 221–238.
Miles, M. B., Huberman, A. M., & Saldana, J. (2014).Qualitative data analysis(3rd ed.). Thousand Oaks, CA: Sage.
Mourtes, N. J. (1999). Portfolio assessment in aerodynamics.Journal of Engineering Education, 88, 223–229.
NGSS Lead States. (2013).Next generation science standards: For states, by states. Washington, DC: The National Academies Press.
Purzer, S. (2011). The relationship between team discourse, self-efficacy, and individual achievement: a sequential mixed-methods study.Journal of Engineering Education, 100(4), 655–679.
Rasch, G. (1960).Probabilistic models for some intelligence and achievement tests (expanded edition, 1980). Chicago: University of Chicago Press.
Reckase, M. D. (1979). Unifactor latent trait models applied to multifactor tests: Results and implications.Journal of Educational and Behavioral Statistics, 4(3), 207–230https://doi.org/10.3102/10769986004003207.
Sengupta, S., Ergas, S., Cunningham, J., Goel, R., Feldman, A., & Chen, Y.-H. (2017). Concept inventory for fundamentals of environmental engineering courses: concept inventory development and testing.Environmental Engineering Science, 34(12), 895–907.
Smith, R. M. (2004). Fit analysis in latent trait models. In E. V. Smith & R. M. Smith (Eds.),
Introduction to Rasch measurement(pp. 73–92). Maple Grove, MN: JAM Press. Sobek, D., II. (2002).Use of journals to evaluate student design processes. Montreal:
Paper presented at the American Society for Engineering Education conference. Thissen, D., Steinberg, L., & Fitzpatrick, A. R. (1989). Multiple-choice models: the
distractors are also part of the item.Journal of Educational Measurement, 26(2), 161–176.
Treagust, D. F. (1995). Diagnostic assessment of students’science knowledge. In S. M. Glynn & R. Duit (Eds.),Learning science in the schools: Research reforming practice(pp. 327–346). Mahwah, NJ: Erlbaum.
Wage, K. E., Buck, J. R., Wright, C. H. G., & Welch, T. B. (2005). The signals and systems concept inventory.IEEE Transactions on Education, 48(3), 448–461. Wang, W.-c. (1998). Rasch analysis of distractors in multiple-choice items.Journal
of Outcome Measurement, 2(1), 43–65.
Williams, J. M. (2001). The engineering portfolio: communication, reflection, and student learning outcomes assessment.International Journal of Engineering Education, 18(2), 199–207.
Wilson, M. (1992). The ordered partition model: an extension of the partial credit model.Applied Psychological Measurement, 16(4), 309–325 https://doi.org/10. 1177/014662169201600401.
Wind, S. A., Alemdar, M., Gale, J. D., Lingle, J. A., & Moore, R. (2017). Developing an engineering design process assessment using mixed methods: an illustration with Rasch measurement theory and cognitive interviews.Journal of Applied Measurement, 18(2), 100–121.
Wind, S. A., & Gale, J. D. (2015). Diagnostic opportunities using Rasch measurement in the context of a misconceptions-based physical science assessment.Science Education, 99(4), 721–741 https://doi.org/10.1002/sce. 21172.
Wright, B. D., & Stone, M. H. (1979).Best Test Design. Chicago, IL: MESA Press. Wu, M., & Adams, R. J. (2013). Properties of Rasch residual fit statistics.Journal of