R E S E A R C H
Open Access
Performance evaluation of WMN-GA system
for different settings of population size and
number of generations
Admir Barolli
1, Shinji Sakamoto
2,3,4,5,6, Tetsuya Oda
2,3,4,5,6, Evjola Spaho
2,3,4,5,6*, Leonard Barolli
2,3,4,5,6and Fatos Xhafa
2,3,4,5,6*Correspondence: [email protected] 2Canadian Institute of Technology, Zayed Center, Rr. Sulejman Delvina, Tirana, Albania
3Graduate School of Engineering, Fukuoka Institute of Technology (FIT), 3-30-1 Wajiro-Higashi, Higashi-Ku, Fukuoka, 811-0295 Fukuoka, Japan
Full list of author information is available at the end of the article
Abstract
Wireless Mesh Networks (WMNs) distinguish for their low cost nature that makes them very attractive for providing wireless Internet connectivity. Such infrastructures can be used to deploy community networks, metropolitan area networks, municipal and corporative networks, and to support applications for urban areas, medical, transport and surveillance systems. The main issues in WMNs are achievement of network connectivity and stability as well as QoS in terms of user coverage. In this paper, we deal with the effect of changes in population size and number of generations for node placement problem in WMNs for Normal distribution of mesh clients. We consider two population sizes 8 and 512 and for every population size the number of generations are 200 and 20,000. As evaluation metrics we used size of giant component and number of covered users. The simulation results have shown that the increase of the population size results in better performance. Best results are obtained for the number of generation 20,000. However, when the number of generation is increased, the computation time is also increased.
Keywords: Wireless mesh networks; Genetic algorithms; Population size; Size of giant component; Number of covered users
Introduction
Wireless Mesh Networks (WMNs) are applicable in deployment of medical, transport and surveillance applications in urban areas, metropolitan, neighboring communities and municipal area networks. At the heart of WMNs are the issues of achieving network con-nectivity and stability as well as QoS in terms of user coverage. These issues are very closely related to the family of node placement problems in WMNs, such as mesh router nodes placement. Node placement problems have been long investigated in the optimiza-tion field due to numerous applicaoptimiza-tions in locaoptimiza-tion science (facility locaoptimiza-tion, logistics, services, etc.) and classification (clustering). In such problems, we are given a number of potential facilities to serve costumers that are connected to facilities aiming to find loca-tions such that the cost of serving all customers is minimized. In traditional versions of the problem, facilities could be hospitals, polling centers, fire stations serving to a num-ber of clients and aiming to minimize some distance function in a metric space between clients and such facilities.
Facility location problems are thus showing their usefulness to communication net-works, and more especially from WMNs field. WMNs [1,2] are currently attracting a lot of attention from wireless research and technology community due to their impor-tance as a means for providing cost-efficient broadband wireless connectivity. WMNs infrastructures are currently used in developing and deploying medical, transport and surveillance applications in urban areas, metropolitan, neighboring communities and municipal area networks [3]. WMNs are based on mesh topology, in which every node (representing a server) is connected to one or more nodes, enabling thus the informa-tion transmission in more than one path. The path redundancy is a robust feature of this kind of topology. Compared to other topologies, mesh topology needs not a central node, allowing networks based on such topology to be self-healing. These characteris-tics of networks with mesh topology make them very reliable and robust networks to potential server node failures. In WMNs mesh routers provide network connectivity ser-vices to mesh client nodes. The good performance and operability of WMNs largely depends on placement of mesh routers nodes in the geographical deployment area to achieve network connectivity, stability and user coverage. The objective is to find an opti-mal and robust topology of the mesh router nodes to support connectivity services to clients.
For most formulations, node placement problems are shown to be computationally hard to solve to optimality [4-7], and therefore heuristic and meta-heuristic approaches are useful approaches to solve the problem for practical purposes. Several heuris-tic approaches are found in the literature for node placement problems in WMNs [8-12].
Genetic Algorithms (GAs) have been recently investigated as effective resolution methods. Mutation operator is one of the GA ingredients.
In this paper, we present the implemented system: Wireless Mesh Network - Genetic Algorithm (WMN-GA) system and investigate the effect of population size and number of generations in the node placement problem in WMNs considering giant component and number of covered users.
The rest of the paper is organized as follows. In Section ‘Proposed and imple-mented WMN-GA System’ is shown the proposed and impleimple-mented WMN-GA system. The simulation results are given in Section ‘Simulation results’. We end the paper in Section ‘Conclusions’ with conclusions.
Proposed and implemented WMN-GA System
In this section, we present WMN-GA system. Our system can generate instances of the problem using different distributions of client and mesh routers.
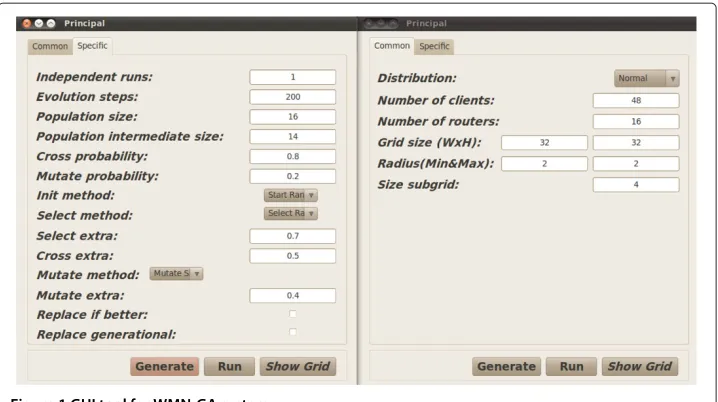
The GUI interface of WMN-GA is shown in Figure 1. The left site of the interface shows the GA parameters configuration and on the right side are shown the network configuration parameters.
For the network configuration, we use: distribution, number of clients, number of mesh routers, grid size, radious of transmission distance and the size of subgrid.
Figure 1 GUI tool for WMN-GA system.
Genetic algorithms
Genetic Algorithms (GAs) [13] have shown their usefulness for the resolution of many computationally combinatorial optimization problems. For the purpose of this work we have used thetemplategiven in Algorithm 1.
Algorithm 1Genetic Algorithm Template Generate the initial populationP0of sizeμ; EvaluateP0;
whilenot termination-conditiondo
Select the parental poolTtof sizeλ;Tt:=Select(Pt);
Perform crossover procedure on pairs of individuals in Tt with probability p
c; Pct :=
Cross(Tt);
Perform mutation procedure on individuals inPt
cwith probabilitypm;Pmt :=Mutate(Ptc); EvaluatePmt ;
Create a new populationPt+1of sizeμfrom individuals inPtand/orPt m;
Pt+1:=Replace(Pt;Pmt ) t:=t+1;
end while
returnBest found individual as solution;
We present next the particularization of GAs for the mesh router nodes placement in WMNs (see [14] for more details).
Encoding
The encoding of individuals (also known as chromosome encoding) is fundamental to the implementation of GAs in order to efficiently transmit the genetic information from parents to offsprings.
nodes. This information is kept in data structures, namely, pos_routersfor posi-tions of mesh router nodes,routers_linksfor link information among routers and
client_router_linkfor link information among routers and clients (matrices of the same size as the grid area are used). Based on these data structures, the size of the giant component and the number of users covered are computed for the solution.
It should be also noted that routers are assumed to have different radio coverage, there-fore to any router could be linked to a number of clients and other routers. Obviously, whenever a router is moved to another cell of the grid area, the information on links to both other routers and clients must be computed again and links are re-established.
Selection operators
In the evolutionary computing literature we can find a variety of selection operators, which are in charge of selecting individuals for the pool mate. The operators consid-ered in this work are those based onImplicit Fitness Re-mappingtechnique. It should be noted that selection operators are generic ones and do not depend on the encoding of individuals.
• Random Selection: This operator chooses the individuals uniformly at random. The problem is that a simple strategy does not consider even the fitness value of individuals and this may lead to a slow convergence of the algorithm.
• Best Selection: This operator selects the individuals in the population having higher fitness value. The main drawback of this operator is that by always choosing the best fitted individuals of the population, the GA converges prematurely.
• Linear Ranking Selection: This operator follows the strategy of selecting the individuals in the population with a probability directly proportional to its fitness value. This operator clearly benefits the selection of best endowed individuals, which have larger chances of being selected.
• Exponential Ranking Selection: This operator is similar to Linear Ranking but the probabilities of ranked individuals are weighted according to an exponential distribution.
• Tournament Selection: This operator selects the individuals based on the result of a tournament among individuals. Usually winning solutions are the ones of better fitness value but individuals of worse fitness value could be chosen as well,
contributing thus to avoiding premature convergence. Particular cases of this operator are theBinary Tournament and N -Tournament Selection, for different values of N.
Crossover operators
The crossover operator selects individuals from the parental generation and interchang-ing their genes, thus new individuals (descendants) are obtained. The aim is to obtain descendants of better quality that will feed the next generation and enable the search to explore new regions of solution space not explored yet.
calledintersection operators(denotedCrossRegion, hereafter), which take in input two individuals and produce in output two new individuals (see Algorithm 2).
Algorithm 2Crossover Operator
1: Input: Two parent individualsP1andP2; valuesHgandWgfor height and width of a small grid area;
2: Output: Two offspringsO1andO2;
3: Select at random aHg×WgrectangleRP1in parentP1. LetRP2be the same rectangle
in parentP2;
4: Select at random aHg ×Wg rectangleRO1in offspring O1. LetRO2be the same
rectangle in offspringO2;
5: Interchange the mesh router nodes: Move the mesh router nodes ofRP1toRO2and
those ofRP2toRO1;
6: Re-establish mesh nodes network connections in O1andO2 (links between mesh
router nodes and links between client mesh nodes and mesh router nodes are computed again);
7: returnO1andO2;
Mutation operators for mesh routers nodes placement in WMNs
Mutation operator is one of the GA ingredients. Unlike crossover operators, which achieve to transmit genetic information from parents to offsprings, mutation operators usually make some small local perturbation of the individuals, having thus less impact on newly generated individuals.
Crossover is “a must” operator in GA and is usually applied with high probability, while mutation operators when implemented are applied with small probability. The rationale is that a large mutation rate would make the GA search to resemble a random search. Due to this, mutation operator is usually considered as a secondary operator.
In the case of mesh routers node placement, the matrix representation is chosen for the individuals of the population, in order to keep the information on mesh router nodes positions, mesh client positions, links among routers and links among routers and clients. The definition of the mutation operators is therefore specific to matrix-based encoding of the individuals of the population. Several specific mutation operators were considered in this study, which are move-based and swap-based operators.
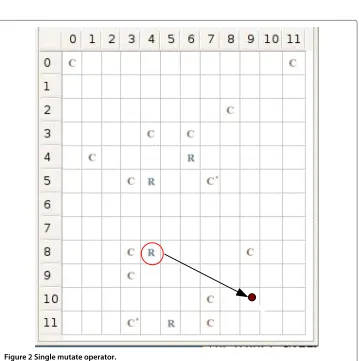
SingleMutate
This is a move-based operator. It selects a mesh router node in the grid area and moves it to another cell of the grid area (see Figure 2).
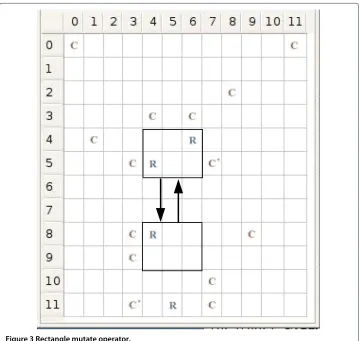
RectangleMutate
This is a swap-based operator. In this version, the operator selects two “small” rectangles at random in the grid area, and swaps the mesh routers nodes in them (see Figure 3).
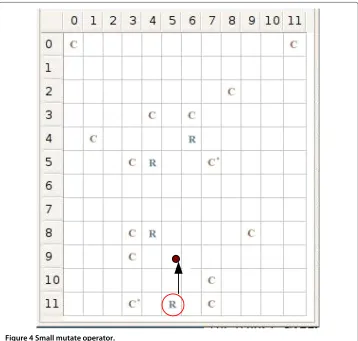
SmallMutate
This is a move-based operator. In this case, the operator chooses randomly a router and moves it a small (a priorifixed) number of cells in one of the four directions: up, down, left or right in the grid (see Figure 4). This operator could be used a number of times to achieve the effect of SingleMutate operator.
SmallRectangleMutate
This is a move-based operator. The operator selects first at random a rectangle and then all routers inside the rectangle are moved with a small (a priorifixed) numbers of cells in one of the four directions: up, down, left or right in the grid (see Figure 5).
Simulation results
We carried out many simulations to evaluate the performance of WMNs using WMN-GA system. In this work, we consider the population size (n). We consider two parameters, m and n and the relation between them is: n 2m, m {m ∈ Z |0 ≤ m ≤12}and 1≤n≤4096. The grid size is considered 32×32. There are many distribution methods,
Figure 5 Small rectangle mutate operator.
0 2 4 6 8 10 12 14 16
1 2 4 8 16 32 64 128 256 512 1024 2048 4096
Size of Giant Component
Population Size
0 5 10 15 20 25 30 35 40 45
1 2 4 8 16 32 64 128 256 512 1024 2048 4096
Number of Covered Users
Population Size
Figure 7 Number of covered users vs. population size (48 clients).
but we take in consideration only the normal distribution. As selection method we used linear ranking and as mutation method we used single mutation. The crossover rate is considered 0.8 and the mutation rate 0.2.
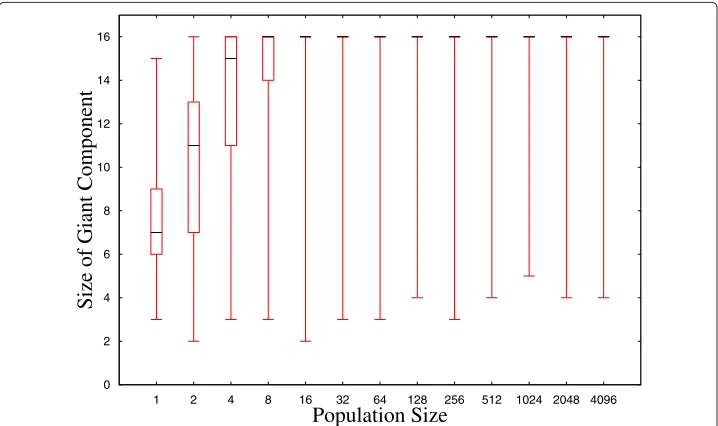
We used box plots to analyze the range of data values. The bottom and top of the box are the 25th and 75th percentile (the lower and upper quartiles, respectively), and the band near the middle of the box is the 50th percentile (the median). The ends of the whiskers represent the minimum and maximum of all the data.
In Figure 6 is shown the size of giant component vs. population size. In this case, the number of mesh routers is considered 16.
0 5000 10000 15000 20000
1 2 4 8 16 32 64 128 256 512 1024 2048 4096
Calculation Time [sec]
Population Size
Best Found Time Total Spent Time
In Figure 7 is shown the number of covered users vs. population size. The number of clients is considered 48. We can see that with the increase of the population size, the size of giant component and the number of covered users is increased. The maximal number of users covered is 45 and this is reached for population size 32.
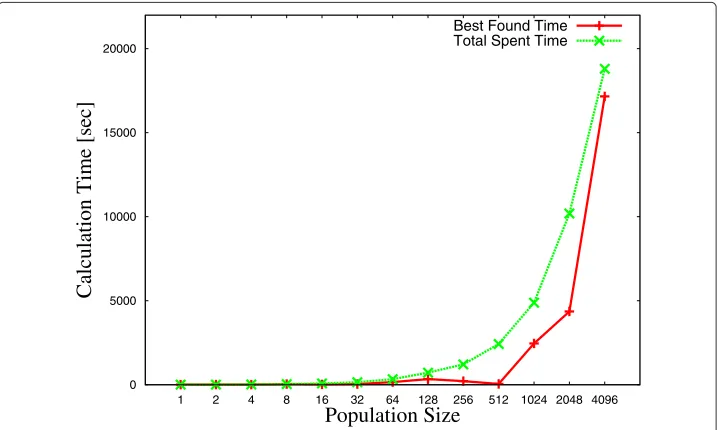
In Figure 8 is shown calculation time vs. population size. We measured the calculation time for 48 clients. As can be seen from the graph, the computational time is high and it increases almost exponentially. However, until the population size is 512 the calculation time is very small. For this reason, we made extensive simulations for population sizes: 8 and 512 considering number of generations 200 and 20,000.
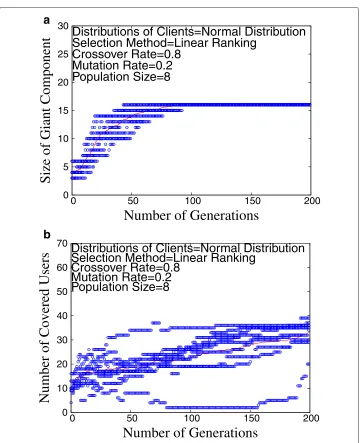
In Figure 9 are shown the simulation results for population size 8 and number of gener-ations 200. In Figure 9(a) is shown the size of giant component vs. population size. In this
0 5 10 15 20 25 30
0 50 100 150 200
Size of Giant Component
Number of Generations
Distributions of Clients=Normal Distribution
Selection Method=Linear Ranking
Crossover Rate=0.8
Mutation Rate=0.2
Population Size=8
0 10 20 30 40 50 60 70
0 50 100 150 200
Number of Covered Users
Number of Generations
Distributions of Clients=Normal Distribution
Selection Method=Linear Ranking
Crossover Rate=0.8
Mutation Rate=0.2
Population Size=8
a
b
case, the number of mesh routers is considered 16. In Figure 9(b) is shown the number of covered users vs. population size. The number of clients is considered 48.
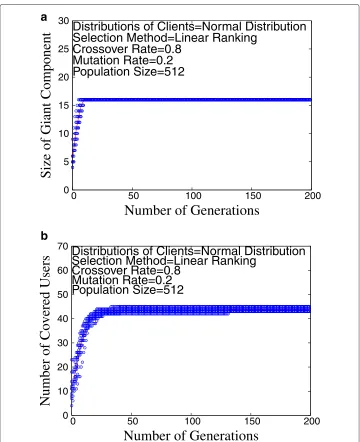
In Figure 10, we increased the population size to 512 and the number of generations is 200. In Figure 10(a) is shown the size of giant component vs. population size and in Figure 10(b) is shown the number of covered users vs. population size.
If we compare Figure 9(a) and Figure 10(a), we can see that in both cases all 16 mesh routers are connected with each other. Comparing the results for population sizes: 8 and 512 (Figure 9(b) and Figure 10(b)), we can see that with the increase of the population size, the performance of WMN is increased and the mesh routers can cover more mesh clients.
0 5 10 15 20 25 30
0 50 100 150 200
Size of Giant Component
Number of Generations
Distributions of Clients=Normal Distribution
Selection Method=Linear Ranking
Crossover Rate=0.8
Mutation Rate=0.2
Population Size=512
b
0 10 20 30 40 50 60 70
0 50 100 150 200
Number of Covered Users
Number of Generations
Distributions of Clients=Normal Distribution
Selection Method=Linear Ranking
Crossover Rate=0.8
Mutation Rate=0.2
Population Size=512
a
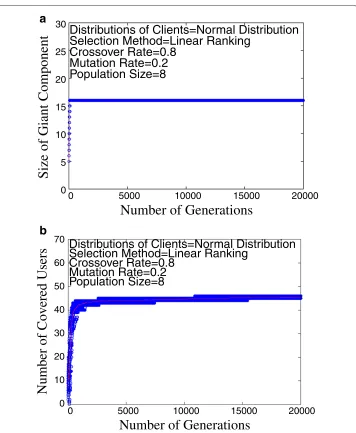
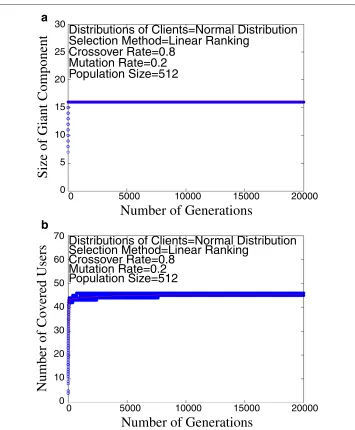
We made other simulations by changing the number of generations to 20,000. In Figure 11 and Figure 12 are shown the simulation results for the population size 8 and 512, respectively. In both cases, the connectivity between all routers is established (see Figure 11(a) and Figure 12(a)) and the number of covered users is almost the same (see Figure 11(b) and Figure 12(b)).
From the results, we can see that the best results are obtained when the number of generation is 20,000. Thus, for higher number of generations and larger population size, the system has better performance.
Conclusions
In this work, we carried out simulations with WMN-GA system to see effect of changes in population size and number of generations for node placement problem in WMNs.
0 5 10 15 20 25 30
0 5000 10000 15000 20000
Size of Giant Component
Number of Generations
Distributions of Clients=Normal Distribution
Selection Method=Linear Ranking
Crossover Rate=0.8
Mutation Rate=0.2
Population Size=8
0 10 20 30 40 50 60 70
0 5000 10000 15000 20000
Number of Covered Users
Number of Generations
Distributions of Clients=Normal Distribution
Selection Method=Linear Ranking
Crossover Rate=0.8
Mutation Rate=0.2
Population Size=8
a
b
0 5 10 15 20 25 30
0 5000 10000 15000 20000
Size of Giant Component
Number of Generations
Distributions of Clients=Normal Distribution
Selection Method=Linear Ranking
Crossover Rate=0.8
Mutation Rate=0.2
Population Size=512
0 10 20 30 40 50 60 70
0 5000 10000 15000 20000
Number of Covered Users
Number of Generations
Distributions of Clients=Normal Distribution
Selection Method=Linear Ranking
Crossover Rate=0.8
Mutation Rate=0.2
Population Size=512
a
b
Figure 12 Simulation results for population size 512 and number of generations 20000.(a)Size of giant component vs. number of generations (16 mesh routers).(b)Number of covered users vs. number of generations (48 clients).
We considered two population sizes: 8 and 512, and for every population size the number of generations was 200 and 20,000. As evaluation metrics, we used the size of giant component and number of covered users. From the simulations we found out the following results.
• With the increase of the population size, the size of giant component and the number of covered users is increased.
• When the number of clients is 48, the computational time is high and it increases almost exponentially.
• When the number of generation is increased to 20,000, we obtained better results.
• The computational time is highly increased with the increasing of the population size, for the same number of generations.
In the future work, we would like to evaluate the performance of WMN-GA system for different parameters and different distributions of mesh routers and clients.
Competing interests
The authors declare that they have no competing interests.
Authors’ contributions
AB, SS and TO perticipated in: the design and implementation of WNN-GA system; analysis and interpretation of data and in the draft of the manuscript. ES, LB and FX pericipated in: the conceptation and design of the system; the discussion and evaluation of the proposed system and in giving the final approval of the version to be published. All authors read and approved the final manuscript.
Acknowledgements
This work is supported by a Grant-in-Aid for Scientific Research from Japanese Society for the Promotion of Science (JSPS). The authors would like to thank JSPS for the financial support.
Author details
1Faculty of Business and Technologies, Department of Information Technology, Kristal University, Autostrada Tirane
-Durres, Km 3, Tirana, Albania.2Canadian Institute of Technology, Zayed Center, Rr. Sulejman Delvina, Tirana, Albania. 3Graduate School of Engineering, Fukuoka Institute of Technology (FIT), 3-30-1 Wajiro-Higashi, Higashi-Ku, Fukuoka,
811-0295 Fukuoka, Japan.4Fukuoka Institute of Technology (FIT), 3-30-1 Wajiro-Higashi, Higashi-Ku, Fukuoka, 811-0295
Fukuoka, Japan.5Department of Information and Communication Engineering, Fukuoka Institute of Technology (FIT),
3-30-1 Wajiro-Higashi, Higashi-Ku, Fukuoka, 811-0295 Fukuoka, Japan.6Department of Languages and Informatics
Systems, Technical University of Catalonia, C/Jordi Girona 1-3, 08034 Barcelona, Spain.
Received: 31 January 2014 Accepted: 17 March 2014
References
1. Akyildiz IF, Wang X, Wang W (2005) Wireless mesh networks: a survey. Comput Network 47(4): 445-487 2. Nandiraju N, Nandiraju D, Santhanama L, He B, Wang J, Agrawal D (2007) Wireless mesh networks: current
challenges and future direction of web-in-the-sky. IEEE Wireless Comm 14(4): 79–89
3. Chen C-C, Chekuri C Urban wireless mesh network planning: the case of directional antennas. Tech Report No. UIUCDCS-R-2007-2874, Department of Computer Science, University of Illinois at Urbana-Champaign, 2007 4. Garey MR, Johnson DS (1979) Computers and intractability -a guide to the theory of NP-completeness. Freeman,
San Francisco
5. Lim A, Rodrigues B, Wang F, Xua Zh (2005)k-center problems with minimum coverage. Theor Comput Sci 332(1–3): 1–17
6. Amaldi E, Capone A, Cesana M, Filippini I, Malucelli F (2008) Optimization models and methods for planning wireless mesh networks. Comput Networks 52: 2159–2171
7. Wang J, Xie B, Cai K, Agrawal DP (2007) Efficient Mesh Router Placement in Wireless Mesh Networks. In: Mobile adhoc and sensor systems. MASS-2007, Pisa, Italy, pp 9–11
8. Muthaiah SN, Rosenberg C (2008) Single Gateway Placement in Wireless Mesh Networks In: Proc. of 8th International IEEE Symposium on Computer Networks, Turkey. (ISCN), Istanbul, Turkey, pp 4754–4759 9. Zhou P, Manoj BS, Rao R (2007) A gateway placement algorithm in wireless mesh networks. In: Proc. of the 3rd
International Conference on Wireless Internet (Austin, Texas, October 22–24, 2007). ICST (Institute for Computer Sciences Social-Informatics and Telecommunications Engineering), Brussels, pp 1–9
10. Tang M (2009) Gateways placement in backbone wireless mesh networks. Int J Comm Netw Syst Sci 2(1): 45–50 11. Franklin AA, Siva C, Murthy R (2007) Node placement algorithm for deployment of two-tier wireless mesh networks.
In: Proc. of IEEE Global Communications Conference GLOBECOMM (2007), Washington DC, USA, pp 4823–4827 12. Vanhatupa T, Hännikäinen M, Hämäläinen TD (2007) Genetic algorithm to optimize node placement and
configuration for WLAN planning. In: Proc. of 4th International Symposium on Wireless Communication Systems, pp 612–616
13. Holland J (1975) Adaptation in natural and artificial systems. University of Michigan Press, Ann Arbor 14. Xhafa F, Sanchez C, Barolli L (2010) Genetic algorithms for efficient placement of router nodes in wireless mesh
networks. In: Proc. of IEEE International Conference on Advanced Information Networking and Applications, Perth, Australia, pp 465–472
doi:10.1186/s13673-014-0005-y