http://www.sciencepublishinggroup.com/j/sjams doi: 10.11648/j.sjams.20170504.15
ISSN: 2376-9491 (Print); ISSN: 2376-9513 (Online)
The Application of Binary Logistic Regression Analysis on
Staff Performance Appraisal
Runyi Emmanuel Francis
Department of Mathematics, Arthur Jarvis University of Science and Technology, Calabar, Nigeria
Email address:
To cite this article:
Runyi Emmanuel Francis. The Application of Binary Logistic Regression Analysis on Staff Performance Appraisal. Science Journal of Applied Mathematics and Statistics. Vol. 5, No. 4, 2017, pp. 164-168. doi: 10.11648/j.sjams.20170504.15
Received: June 5, 2017; Accepted: June 14, 2017; Published: July 26, 2017
Abstract:
This study investigates and models salient factors that influences the performance of staff in an appraisal exercise and as well estimate the odds of these factors influencing the outcome variable (performance rating) as compared to their reference group or category. The Binary Logistic regression model was used to estimate chance of the staff given the influence of the identified independent variables. In the study, marital status was found to be significant in distinguishing staff performance as identified from the outlined factors influencing their performance.Keywords:
Performance Appraisal, Binary Logistic, Odds1. Introduction
Performance is a standard for every successful organization, as such members are required to contribute their best to achieve the goals of the organization. Performance is hence defined as “accomplishing, executing, and carrying out anything ordered or undertaken”. Performance appraisal is defined as “the process of identifying, evaluating and developing the work performance of the employee in the organization, so that organizational goals and objective are effectively achieved while at the same time, benefiting employees in terms of recognition, receiving feedback, and offering career guidance”. Also, Performance appraisal is a process of evaluating employee performance for the purpose of placements, selections for promotions, career planning, financial rewards, motivation etc. Performance appraisal seeks therefore to achieve the following objectives:
a. To assess the performance, personal attributes and potential attributes of the employee.
b.Performance-based rewards in terms of promotion, increments etc.
c. To identify training needs
d.To assess strengths, area of improvements and give feedback to the employee.
The terms “Performance Assessment”, “Performance Evaluation”, “Performance Management” are also used to describe the process. Though performance appraisal system
has been debated by many, it is however viewed that performance appraisal is an inseparable and vital sectional part of organizational life. Practicing of performance appraisal is one of the top vehicles for creating competitive advantage. The key sequence of performance management are as follows
a. Identification of strategic objectives b.Setting of departmental/team goals
c. Activities identified/performance plan developed d.Monitor/review of performance through appraisal e. Determine development needs
f. Allocate reward
Performance Management is an increasingly common phenomenon in the public sector. All public sector organization will be required to scrutinize the performance of the organization and its staff. The Performance Appraisals are essential for the effective management and evaluation of staff. Appraisal helps develop individuals, improve organizational performance, and feed into business planning. Performance appraisals are vital for managing the performance of employee and organization. Therefore, the purpose of the process of staff appraisal is to meet the following:
a. Achievement of Organization goals b.Setting of Individual Objectives
c. Evaluation of individual performance against objectives d.Allocation of rewards
as regards this study: a. Age
b.Job knowledge and skills c. Educational Qualification d.Length of Service e. Globalization
f. Advance and innovations in technology g.Changes in the market conditions
h.Gender inequality and Health related factors
2. Methodology
Data for this work/study were obtained from 120 filled questionnaire from selected small public sector.
2.1. Logistic Regression
Linear logistic regression is one of the many special cases of generalized linear models. It is characterized by three components: a random component, which identifies the probability distribution of the response variable; a systematic component, which specifies a linear function of explanatory variables that is used as a predictor; and a link function
describing the functional relationship between the systematic component and the expected value of the random component. Linear logistic regression technique fits the model for binary or ordinal response data using the method of Maximum Likelihood.
Logistic regression model has been in use in statistical analyses for many years. It is frequently used when an individual is to be classified into two or more groups.
The fundamental assumption in linear logistic regression analysis is that natural logarithm of odds is linearly related to the independent covariates. Here, odds is defined as the ratio of the probability of an event occurrence to the probability of non-occurrence of the event.
2.2. Logistic Regression Model
For a binary response variable Y and an explanatory variable (covariate) X,
let π(x) = P(Y=1/X=x) = 1- P(Y=0/X=x). The logistic regression model is therefore
+
=
∑
∑
= = ij p j j p j ij j iX
X
1 1exp
1
exp
β
β
π
Here,
+
=
∑
∑
= = ij p j j p j ij j iX
X
1 1exp
1
exp
β
β
π
is regarded as afunction of the two regression parameter (the intercept, β0, and the regression parameter for X, β1)
2.3. Binary Response Model
In the binary response model expressed above, the response variable is binary or dichotomous. An individual can take on one of the two possible values, denoted for convenience by 0 and 1. Observations of this nature arise, for instance, an individual has either been promoted (Y=I) or has not (Y=0) in the annual staff promotion exercise. We may then define
Pr(Y=O) = 1 – π and Pr(Y=1) = π for the probabilities of 'failure' and 'success' respectively.
The main goal of this analysis is to find the best fitting and most parsimonious yet practical and reasonable model to describe the relationship between the response variables and a set of independent explanatory variables (covariates).
3. Results
The dependent variable used in the study was the classification variable of the performance of staff at their respective organization (0=for those who score below 79%, 1=for those who score 80 and above).
Explanatory variables used in this study are factors influencing (or contributing to) the performance of these staff which are Age of Staff, Gender (Male or Female), Marital Status (Married or Single), Educational Qualification (BSc, MSc, PGD), Experience (length of Service in years), Proficiency with current technology (High-Average-Low).
Also, staff responded to their perception on appraisal were also noted based on the given questionnaire, as stated below.
Question 2: Do you think performance appraisal helps people set and achieve meaningful goals?
Question 6: Do you think globalization improves the performance of an employee?
Question 10: Do you think the change in market conditions affect the performance of an employee?
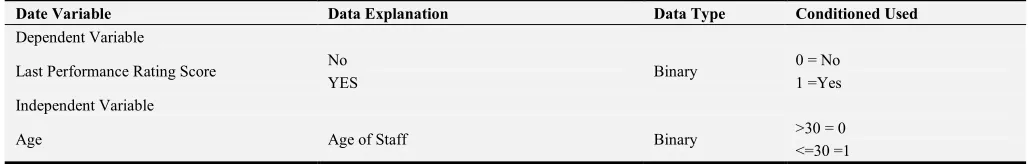
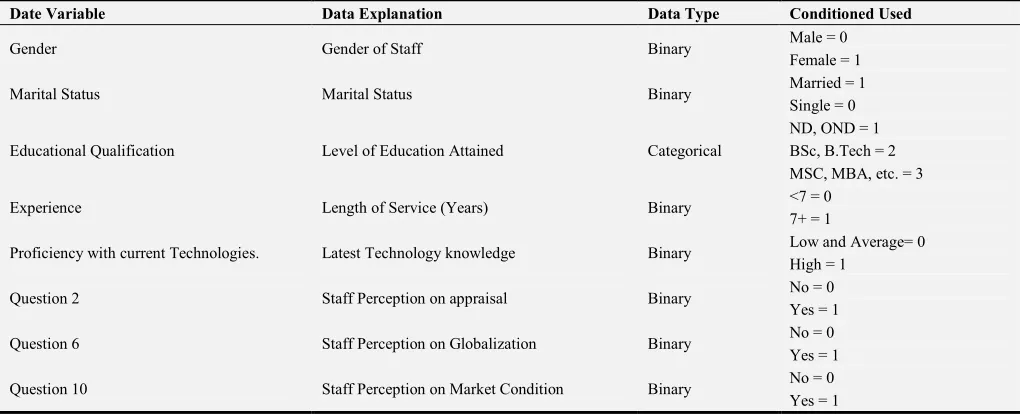
The table below shows the coding of variables influencing the performance of staff used explicitly.
Table 1. Coding of variables affecting staff performance appraisal.
Date Variable Data Explanation Data Type Conditioned Used
Dependent Variable
Last Performance Rating Score No Binary 0 = No
YES 1 =Yes
Independent Variable
Age Age of Staff Binary >30 = 0
Date Variable Data Explanation Data Type Conditioned Used
Gender Gender of Staff Binary Male = 0 Female = 1
Marital Status Marital Status Binary Married = 1 Single = 0
Educational Qualification Level of Education Attained Categorical
ND, OND = 1 BSc, B.Tech = 2 MSC, MBA, etc. = 3
Experience Length of Service (Years) Binary <7 = 0 7+ = 1
Proficiency with current Technologies. Latest Technology knowledge Binary Low and Average= 0 High = 1
Question 2 Staff Perception on appraisal Binary No = 0 Yes = 1
Question 6 Staff Perception on Globalization Binary No = 0 Yes = 1
Question 10 Staff Perception on Market Condition Binary No = 0 Yes = 1
Here we consider performance of staff as a dependent variable, whereas factors affecting staff performance (age, gender, marital status, educational qualification, experience, proficiency, and questions related to staff perception towards appraisal) as the independent variable.
Table 2. The estimated coefficient, its standard error and Wald test.
Covariates β Estimate Standard Error Wald Significance
Age (<=30) 0.269 0.601 0.200 0.654
Gender (Female) 0.413 0.513 0.649 0.421 Marital Status (Married) 1.394 0.564 6.111 0.013 Educational Qualification (ND) -0.656 0.820 0.640 0.424 Educational Qualification (HND) 0.909 0.738 1.516 0.218 Educational Qualification (PGD Above) -0.409 0.587 0.484 0.487
Experience 0.047 0.780 0.366 0.545
P.C.T (High) 1.049 0.589 3.173 0.075
Question 2 (Appraisal) 0.884 0.554 2.548 0.110 Question 6 (Globalization) 0.173 0.497 0.121 0.728 Question 10 (Market Condition) 0.417 0.524 0.633 0.426
Constant -1.610 0.994 2.620 0.106
At the 0.05 Level of significance, table above shows that “marital status (married)” has a high significance in affecting the performance of a staff.
The odds of married staff making above 80 in their performance rating is about 4 times that of the single staff. As far as this analysis is concern, marital status (married) is the only prominent contributing factor that influences the performance of the staff.
The coefficients are used to estimate the probability of the staff performance as follows:
= 1\ =
1 + =
1 1 +
Where Z = α+β1x1+ β2x2……+ βpxp
Hence, Z= -1.610 + 0.269 (Age) + 0.413 (Gender) + 1.394 (Marital Status) - 0.656 (ND) + 0.909
(HND) – 0.409 (PGD) + 0.047 (Experience) + 1.049 (PCT) + 0.884 (Q2) + 0.173 (Q6) + 0.417 (Q10).
3.1. Odd Ratio
The following odds ratio were calculated using the formula;
= 1
2=
1 1 − 1
2 1 − 2
For every covariate used in this study, results are given in table below.
Table 3. Odd Ratios and 95% confidence interval for covariates.
Variables Odd Ratio 95% Confidence
Age 1.309 {0.403 – 4.248} Gender 1.511 {0.553 – 4.130} Marital Status 4.029 {1.335 – 12.162} ND 0.519 {0.104 – 2.589} HND 2.481 {0.584 – 10.536} PGD 0.665 {0.210 – 2.101} Experience 1.048 {0.900 – 1.220} P.C.T 2.854 {0.900 – 9.048} Q2 2.421 {0.818 – 7.166} Q6 1.189 {0.449 – 3.150} Q10 1.517 {0.544 – 4.232}
highly more regarded to be promoted or rewarded as a result of their performance (80+) based on the analysis carried out.
The below gives the classification table. Using the obtained Z function observation is classified as follows, using a probability of 0.05.
Table 4. Classification table.
Observed Predicted
LPRS Grouped Percentage Correct <80 80+ <80
LPRS Grouped <80 16 20 44.4 80+ 7 77 91.7 Overall Percentage 77.5
From the table, we conclude that
a. 16% of the staff performance are correctly classified, and 20% are incorrectly classified.
b.77% of the staff performance as correctly classified, 7% are incorrectly classified.
c. The overall correct percentage was 77.5% which reflects the model overall explanatory strength.
3.2. Assessment of the Model
The Wald test is obtained by comparing the maximum likelihood estimate of the beta’s, β1, to its standard error, i.e., the ratio of the regression coefficient estimate and the standard error. The resulting ration under the hypothesis that β1 = 0
It is evident that the covariate (Marital Status) is statistically significant while the covariates (Age of Staff, Gender, Experience and Educational Qualification, Proficiency with technology, Q2, Q6, Q10) are statistically not significant, i.e., they don’t contribute to the performance of the staff.
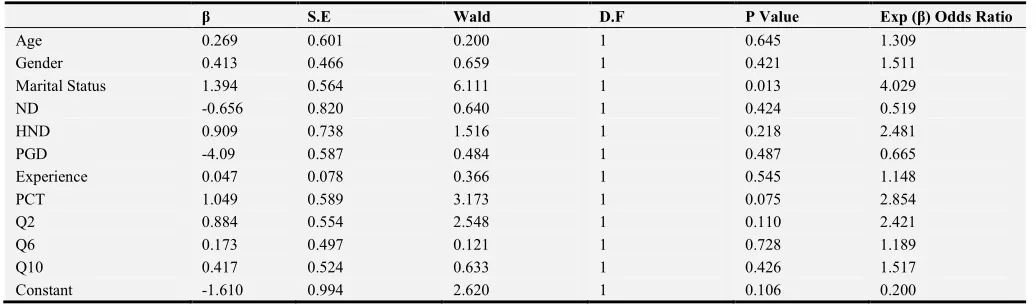
Stepwise Logistic regression is used to reduce the number of covariates. Results are summarized in the below table.
Table 5. Logistic Regression Analysis of Staff Performance Appraisal.
β S.E Wald D.F P Value Exp (β) Odds Ratio
Age 0.269 0.601 0.200 1 0.645 1.309
Gender 0.413 0.466 0.659 1 0.421 1.511 Marital Status 1.394 0.564 6.111 1 0.013 4.029
ND -0.656 0.820 0.640 1 0.424 0.519
HND 0.909 0.738 1.516 1 0.218 2.481
PGD -4.09 0.587 0.484 1 0.487 0.665
Experience 0.047 0.078 0.366 1 0.545 1.148
PCT 1.049 0.589 3.173 1 0.075 2.854
Q2 0.884 0.554 2.548 1 0.110 2.421
Q6 0.173 0.497 0.121 1 0.728 1.189
Q10 0.417 0.524 0.633 1 0.426 1.517
Constant -1.610 0.994 2.620 1 0.106 0.200
Using the contributing factor (Significant covariate) that influences the performance of staff, therefore, its Logit is;
Z= -1.610 + 1.394 (Marital Status – Married) It follows that
= 1 +
=
. . !"! # $% %&' !!"()
1 + . . !"! # $% %&' !!"()
The logit π(x) above indicates that: Married Staff are more reliable in performing better than single staff. The exp(β) is the ODD RATIO; thus the odds for the married staff to single staff performance are 4.029.
The value of the Hosmer-Lemeshow goodness of fit statistic computed for the full model was C=8.216 and the corresponding P-Value computed from the chi square distribution with 8 degree of freedom is 0.413. This indicates that the model seems to fit quite well.
4. Summary & Conclusion
In this study, some factors that influenced staff
performance were studied using logistic regression. The factors influencing staff performance used are Age, Gender, Educational Qualification, Experience, Marital Status, Proficiency with latest technology, Perception on Appraisal, Perfection on Globalization, Perception on Market condition.
The binary logistic model used to estimate the probability of the staff performance. Significance testing for the logistic coefficient using Wald test shows that marital status (married) is a significant factor. The Odd ratio for each covariate whether the probability of having a staff performing well is the same for each covariates group. The Odds ratio for married staff to single staff ranges between 4 ties with confidence interval 95%. To assess the fitness of each model, the Hosmer and Lemeshow test was used.
In conclusion, we also demonstrated that logistic regression can be powerful analytical technique for use when the outcome variable is dichotomous in this study. The effectiveness of the logistic model was shown to be supported by;
a. The significance test of the model against the null model
References
[1] Adcroft, A. & Willis, R. (2005) the (UN) intended outcome of public sector performance measurement. International Journal of Public Sector Management. Vol 19, no. 5. Pp 386-400. [2] Agresti, A (2002) “Categorical Data Analysis” New York;
Wiley.
[3] Alexander, K L Dauebr, S, L, and Entwisle D. R, (1999) Children in motion: School transfer and performance. The Journal of Education Research, 90 (1), 3-11.
[4] Armstrong, M. & Baron, A. (2005) Managing Performance, Performance Management in Action. London, CIPD.
[5] Bach, S. (2000) Personnel Management, a comprehensive guide to theory and practice. London, Blackwell.
[6] Bates, R. A & Holton, E. F. (1995) Computerized Performance Monitoring-a review of human resources issues. Human Resources Management Review. Vol 5, issue 4. Winter 1995. Pp 267-288.
[7] Boland, T. and Fowler, A. (2000) A systems perspective of performance management in public sector organizations. International journal of public sector management. Vol 13, no. 5, pp 417-446.
[8] BOSWELL, W. R. & Boudreau, J. W. (2002) Separating the development and evaluative performance appraisal uses. Journal of Business and Psychology. Vol 16, pp 391-412. [9] Bird, P. (2003) Performance Appraisals. London, Hodder and
Stoughton.
[10] Brumbach, G. (1998) Some ideas, issues and prediction about performance management. Public Personnel Management. Winter, pp 387-402.
[11] De Nisi, A. S. (1996) Cognitive approach to performance appraisal. London, Routledge.
[12] Harrison, K & Goulding, A. (1997) Performance Appraisal in Public Libraries. New Library World. Vol 98, no 1138, pp 275-280.
[13] Homer, A. S and Lemshow, S (1992), Applied Logistic Regression” New York: Wiley.
[14] Hornby, A. S (2001), “Oxford advanced learner dictionary” (6th edition) Oxford University Press.
[15] KEUG, J (1998), Improving the performance appraisal process. Journal of Management in engineering, 14 (5), 19-20. [16] Landy, F. and Fan, J (1983). The Management of work
performance. NY Academic Press.
[17] Lawal, B. (2003), Categorical Data Analysis with SAS and SPSS Application”. Lawrence Erlbaum Associates, Publishers, London.
[18] Lawley and Maxwell, (1971); Marascuilo and Levin, (1983); Tabachick and Fidell, (1996, 2001).
[19] Mani B. G (2002), Performance Appraisal System, Productivity and Motivation. A case study: Public personnel management, 31 (2), 141-159.
[20] Masterson, John. Business Statistics. December, (2009). [21] McMASTER, M. (1994) Performance Management. Oregon,
Metamorphous Press.
[22] Roberts, G. & Pregister, M. (2007) Why employes dislike performance appraisals. Regent Global Business Review. Vol 1, no. 1, pp 14-21.
[23] Rose, A. & Lawton, A. (1999). Public Services Management. Harlow, Pearson Education Ltd.
[24] S. Kumar and D. Toshniwal, “A data mining framework to analyze road accident data”, Journal of Big Data, Springer, vol. 2, No. 26, pp. 1-18, 2015.
[25] S. Kumar, D. Toshniwal and M. Parida, “A comparative analysis of heterogeneity in road accident data using data mining techniques”, Evolving systems, vol. 8 (2), 2017. [26] Wisniewski, M. & Stewart, D. (2004) Performance
Management for Stakeholders. International Journal of productivity and performance Management. Vol 17, No 3, pp 222-233.