Published online December 30, 2013 (http://www.sciencepublishinggroup.com/j/ijmsa) doi: 10.11648/j.ijmsa.20130206.19
Calculation of phase transitions of uranium dioxide using
structure factor in molecular dynamics
Nagornov Yuri
*, Katz Andrey
Togliatti State University, Togliatti, Samara region, Russia
Email address:
[email protected] (Yu. Nagornov), [email protected] (A. Katz)
To cite this article:
Nagornov Yuri, Katz Andrey. Calculation of Phase Transitions of Uranium Dioxide Using Structure Factor in Molecular Dynamics. International Journal of Materials Science and Applications. Vol. 2, No. 6, 2013, pp. 228-232. doi: 10.11648/j.ijmsa.20130206.19
Abstract:
We calculate phase transitions of uranium dioxide using structure factor in molecular dynamics. Our method is based on analysis of the rate of the structure factor change with the temperature. The temperatures of melting and transition to the superionic state for the uranium dioxide obtained by this method are 3100K and 2600K, respectively. Theses temperatures much better conform to the experimental values of 3120K and 2670K than in the radial distribution function analysis method. Other methods give the melting temperatures substantially higher (3435-3600K) than the experimental value.Keywords:
Uranium Dioxide, Calculation of Phase Transitions, Rate of the Structure Factor Change, Molecular Dynamics1. Introduction
At present, the molecular dynamics (MD) method is widely employed for the simulation of thermodynamic and nonequilibrium processes [1,2]. One application of the MD method in material science is to determine the phase transition temperatures. There are various approaches for the MD simulation of the phase transition. One of them is the use of two atom regions separated by the interface, where one region corresponds to the molten state, while the other is associated with the crystal phase. Then, the MD calculation is performed at the given temperature. Some time after, the thermodynamic equilibrium is established, and the system behavior is determined. If the interface shifts towards more intense melting, this means the energy of atoms in the crystal phase area is enough for melting, and vice versa. The paper Ref. [2] uses this approach to determine phase transition temperature of stoichiometric uranium dioxide as 3400-3600K, which is by 300-500K higher than the experimental value (3120K).
Another method is based on the analysis of a radial distribution function of particle number density. Maximums of this function correspond to coordination spheres in a crystal. As the temperature grows, the peak amplitude gradually decreases, and melting causes them to disorder. In particular, the number of the peaks and the distance between them change, which denotes the atom system disordering. However, this approach gives overrated values
for the melting point since the MD calculation time does not exceed few nanoseconds. The melting process cannot be accomplished during such a short period, therefore, the MD method is considered to give the overestimated phase transition temperature.
The melting process correlated with the disordering of the structure of atoms in the lattice, which can be calculated when considering diffraction by a grating at different temperatures. It is known [3] that the intensity of the reflection X-ray diffraction or reflection of slow neutrons by the square of the scattering amplitude, which is equal to:
∑ ∑ (1)
where m,n,p - index indicating the cell of the crystal, - vector defining the coordinate of the crystal cell, i - the index that defines the atom inside the cell, - vector defining the coordinates of the atoms relative to the cell, fi
- atomic scattering factor, - reciprocal lattice vector. Considering that the first factor is not equal to zero only in the case when the scattering vector equals to the reciprocal lattice vector , we obtain the expression [3]:
, (2)
factor, equal to:
∑ . (3)
By definition, the intensity of the reflection is equal to the square of the scattering amplitude:
! ~ # #$~ # #$ (4)
It is known that the logarithm of the intensity of the diffraction peaks is proportional to the Debye-Waller factor and decreases almost linearly with temperature [3]. Hence logarithm of the square of the structure factor will decrease linearly with temperature up to the phase transition point, while the conditions of scattering. At point of phase transition the character of the scattering varies, vibrations of lattice atoms increases, and the structure factor decreases sharply. That is why, the article does not focus on the value of the structure factor, but we discuss its dependence on temperature in order to determine the phase transition point from the deflection from linearity.
2. Calculation Algorithm
In the classical molecular dynamics method the form and the type of the interatomic potential are postulated, and its parameters are constant regardless of the purpose of calculation. We perform reconstruction of the potential parameters using experimental data of the thermal expansion of the UO2 lattice and by enthalpy variation [1,2]. We took
the most popular rigid ion model that takes into account Coulomb interaction and the short-range Buckingham potential:
% & ' '(() · + ) +& · exp /0 01 1( ( (2 34 4(5( (5)
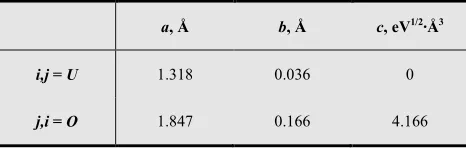
Here, the fractional charge value is specified for ions of oxygen and equal 1.2. The charge for uranium ion is obtained by multiplying the value by two (2.4). The parameter f is equal 0.0345. The other potential parameters were taken from Ref. [4] and are listed in Table 1.
Table 1. Parameters of the potential represented as (5).
a, Å b, Å c, eV1/2·Å3
i,j = U 1.318 0.036 0
j,i = O 1.847 0.166 4.166
The calculation was carried out on a supercomputer based on two Intel Xeon processors with 160 Gflops of computational power each, and four graphic processors Nvidia Tesla K10 with a peak computational power of 4.58 Tflops each. The software used for simulation was the
DL_POLY 4.04 system developed in Daresbury Laboratory (UK). Source codes of the program were obtained from the developer and were not modified. The system compiled with OpenMPI and CUDA 4.0 parallel processing technologies gives the edge by several orders in computation time over sequential implementation. This hardware-software appliance allowed to perform computations for simulation periods of 10 ns and more. The potential was set as a file with coefficients from the Table 1 and calculated using (5).
The periodic boundary conditions were applied. The translated cell was selected as a cubic fluorite structure crystal containing from 768 to 12000 ions. All computations implied the integration step of 2 fs and the cut-off radius of 10 Ǻ. The Coulomb interactions were treated with the classical Ewald summation technique. Depending on the task, computations were performed for a microcanonical NVE ensemble or a canonical NPT
ensemble, but both cases fulfilled isothermal conditions. Errors were calculated in accordance with root-mean-square deviation, and for measuring the lattice parameter dependence on the temperature they were 0.016-0.018%, and for measuring enthalpy they didn’t exceed 0.01%.
3. Determination of Phase Transition
Temperatures
The interesting way to determine the phase transition temperature is a method in which the structure factor is chosen as the ordering criterion in a crystal [2]. To achieve this goal, the normalized squared modulus of the structure factor is calculated individually for the uranium and oxygen sublattices for (002), (020) and (200) directions. The temperature changes of the structure factor are associated with the changes in the radial distribution function (RDF) of the particle number density. However, the structure factor is more suitable due to its simplicity for comparing the ordering with its numerical estimate. At the temperature of 0K the crystal has an ideal structure with the structure factor of one. At high temperatures, on the contrary, for the molten state the squared modulus of the structure factor tends to zero, and its numerical values vary within the range of 0.01-0.04. Unfortunately, similarly to the above mentioned ways, the simulation period is too short to transform the crystal from the solid into the molten state.
Figure 1. Temperature dependences of squared modulus averaged by directions (002), (020) and (200), separately for uranium and oxygen lattices with linear approximation between phase transition points at 2600K and 3100K. Three areas are shown in figure: I - solid area, II - superionic area, III - liquid area. The vertical lines show the two phase transition temperature – 2670 K and 3120 K.
Fig.1 shows three areas: solid area, superionic area and liquid area, which separated by vertical lines of phase transitions - 2670K and 3120K corresponding experimental data, as recommended in [11]. In the temperature region 2200-2600K dependence is a transitional area, then there is also a linear (region II) to the melting temperature of the lattice uranium (3120K).
Note that the transition area of 2200-2600 K, in our opinion, is related with the premelting of oxygen sublattice, since exactly in this temperature range, there are defects [5,6]. Calculations imply that the criterion of a defect or a Frenkel pair is the fact of transition of an atom to the interstice space by diffusional processes at simulation temperature. A defect is the atom that resides closer to the center of the interstice than to the node of the lattice. That is, if the parameter of the cubic lattice of a crystal is equal to a, the defect threshold is equal to √2/4; for the 2D case (Fig.2) and √3/4; for the 3D case. The radial distribution function changes only due to peaks widening. This fact signifies that oxygen atoms at the temperature of 2250K have sufficient kinetic energy and move with high amplitude, which allows them to leave a lattice node and enter the interstice space (Fig.3). Since the modeling time does not exceed 10 ns, the localization of oxygen atoms near the lattice node stays the same.
As seen on Fig.3 the number of defects in the oxygen sublattice sharply increases, which in turn produces the change in the oscillation amplitude of uranium atoms, and the slope of dependence curves significantly changes. Recent studies have shown [5,6], that the melting process starts at temperatures below the phase transition, the so-called premelting, which is accompanied by the growth of the number of defects.
Figure 2. Criteria for determination of number of defects in the oxygen sublattice for 2D case: the inner region is the creation of the defect.
Figure 3. The temperature dependence of the number of defects in the oxygen in 4x4x4 cell sublattice or 768 molecules of UO2.
Moreover the melting begins at the crystal surface and before reaching melting point the condition are occurred for thermodynamic phase equilibrium between the thin (a few nanometers) liquid film and solid of bulk crystal [7].
In accordance with these views the melting front extends from surface to crystal volume. At each temperature below the melting temperature two phases are coexisted: crystalline and liquid which is thin nanometric layer on the surface. Therefore considered to be the phase transition point is the highest temperature in the transition region (Fig.1, the area between I and II). In our case, this value becomes 2600 K for oxygen sublattice, and 3100 K – for uranium sublattice.
point where the linear character of the logarithmic dependence of the structural factor on temperature (Fig. 1) changes allows us to determine phase transitions in uranium dioxide crystals with decent accuracy.
3. Comparison with Other Methods and
Potentials
Papers [5, 6] use the molecular dynamics method to obtain melting temperatures of argon well-matching the experimental data by adding defects and voids to the crystal. The melting temperature is obtained from the transition temperature versus void size curve. We conducted calculations for the ideal crystal and for a crystal with voids produced as a result of exclusion of one molecule of UO2,
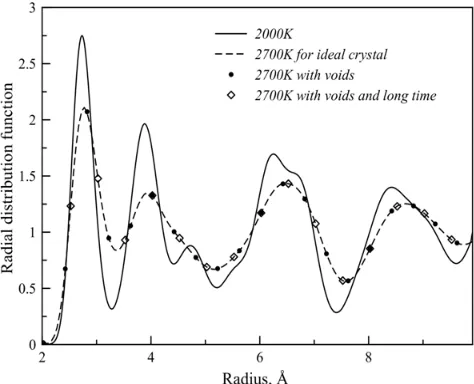
and the concentration of voids proved to be dependant on the number of translated cells (Fig.4). For uranium dioxide concentration of voids up to 1019 cm-3 leaves radial distribution function and, therefore, the melting temperature unaffected. Phase transition to the superionic state happens are the temperature of 2670 K, however, for 100 ps and 10 ns simulation periods and temperature of 2700 K there’s no difference between the ideal crystal and a crystal with voids. It is clear that as the size of voids increases, the melting temperature decrease, and the reason for that is both concentration of defects and the increase of surface energy. Thus the method of determining the transition temperatures by RDF was not usable in molecular dynamics simulation.
For comparison the melting temperature has been computed in [2] for a few rigid ion potentials [8-10]: Basak, Karakasidis, Morelon, Walker and Yamada. Authors in [2] used two atom regions separated by the interface at initial
temperature (Fig.5), where one region corresponds to the molten state, while the other is associated with the crystal phase. When the MD calculation is performed and the thermodynamic equilibrium is established, then the system behavior is determined at final temperature. If the interface boundary shifts towards more intense melting, this means the energy of atoms in the crystal phase area is enough for melting, and vice versa. At temperature melting and the coexistence of liquid and solid UO2 can become energetically possible.
Authors in [2,8-10] proceeded by varying the initial temperature of the simulations and looking (by visualisation of the atoms trajectory) which state is reached by the system after 200 ps. Results of calculations are reported in Table 2 the range of variation of the smoothed curve of temperature, once it became visually stable. These predictions have to be compared to the experimental value of 3120 ± 20 K for UO2
[11]. For some runs (Karakasidis potential and Walker potential with an initial temperature of 3200 K) it was not clear whether an equilibrium was reached at the end of the simulation or not [2]. It is possible that a longer simulation
would end with a solidification of the box. It is seen that the best values obtained for the melting temperature (3435-3600 K) is significantly higher experimental value.
Authors in [2] carried out test which concerns the sensitivity of the predicted temperature to the size of the system. They did not expect to obtain different predictions of the melting temperature, but rather to observe a different behaviour of the interface. Indeed for the smallest systems the ratio of the energy of the separation surface per atom can be quite high and the system will naturally tend to favour the growth of one of the phases. For larger systems, the interfacial energy is relatively less important to the total energy of the system and the coexistence of liquid and solid
UO2 can become energetically possible. It also appeared that
the simulations of large systems would require longer simulated times in order to achieve equilibration, particularly near the melting temperature. By authors in [2] the choice of a (5 × 5 × 5 unit cells solid phase + liquid phase of an equivalent size) seems thus a good compromise in view of the accuracy of the results and the computing time.
Figure 4. Radial distribution function (RDF) of oxygen atoms at the temperature of 2700K and various simulation conditions: for the ideal crystal, for a crystal with voids, and with varying simulation period – 100 ps and 10 ns. For comparison, RDF of oxygen at 2000 K is shown.
Table 2. The melting point of uranium dioxide for different initial temperatures and interatomic potentials are obtained in [2]. Bold data: coexistence of the solid and liquid phase; Italic data: solidification of the system; Normal data: liquefaction of the system.
Initial temperature, К
Potential
Basak [8] Karakasidis [2] Morelon [9] Walker [2] Yamada [10] Temperature of melting point
3000 3100 ± 50 3270± 15 3335± 20
3050 3145 ± 50 3340± 25
3100 3170 ± 50
3150 3205 ± 45
3200 3525 ± 25 3075 ± 25 3510± 20 3360 ± 40 3525± 20
3300 3610 ± 25 3585± 20
3400 3540 ± 65 3220± 20 3625± 25 3435 ± 45
3450 3540 ± 65 3710± 20 3460 ± 45
3500 3545 ± 60 3500 ± 65 3350± 20
3550 3440 ± 15 3320± 25 3530 ± 50
3600 3460 ± 20 3430± 25 3425± 20 3400± 25 3885± 25
3800 3640 ± 20 3635± 20 3570± 20 3580± 25 4065± 40
4000 3880 ± 20 3840± 30 3810± 20 3520± 30 4155 ± 55
4. Conclusion
To determine phase transition temperatures more accurately, we suggested a method that uses the change rate of temperature dependence of the structure factor. In this case, the temperatures of melting and transition into the superionic state are ~3100 K and ~2600 K, respectively. Theses temperatures much better conform to the experimental values of 3120 K and 2670 K than in the radial distribution function analysis method and other approaches. Other methods give the melting temperatures substantially higher (3435-3600 K) than the experimental value. Our method can be used for calculating transition temperatures in nanocrystals, and also in critical conditions, for example, under high pressure and/or under radiation when experimental measuring is difficult or impossible.
Acknowledgements
This work was supported by Russian Foundation for Basic Research (grant N 11-01-00311-а).
References
[1] K. Govers, S. Lemehov, M. Hou, M. Verwerft “Comparison of interatomic potentials for UO2. Part I: Static calculations” in Journal of Nuclear Materials, Vol. 366, 2007, pp. 161–177.
[2] K. Govers, S. Lemehov, M. Hou, M. Verwerft “Comparison of interatomic potentials for UO2 Part II: Molecular dynamics simulations” in Journal of Nuclear Materials, Vol. 376, 2008, pp.66-77.
[3] C. Kittel, Introduction to solid state physics. Wiley, New York, 1971.
[4] S. Yamasaki, T. Arima, K. Idemitsu “Evalution of Thermal Conductivity Hyperstoihiometric UO2+x by Molecular Dynamics Simulation” in International Journal of Thermophysics, Vol.28, №2, 2007, pp.661-673.
[5] Agrawal1 P.M., Rice B.M., Thompson D.L. “Molecular dynamics study of the effects of voids and pressure in defect-nucleated melting simulations” in J. Chem. Phys., Vol. 118, 2003, pp.9680-9684.
[6] J. Solca, A. J. Dyson, G. Steinebrunner, B. Kirchner and H. Huber “Melting curves for neon calculated from pure theory” in J. Chem. Phys., Vol. 108, 1998, pp.4107-4111.
[7] D. G. Gromov, S. A. Gavrilov “Manifestation of the heterogeneous mechanism upon melting of low-dimensional systems“ in Physics of the Solid State, Vol. 51, N 10, 2009. pp 2135-2144.
[8] C.B. Basak, A.K. Sengupta, H.S. Kamath “Classical molecular dynamics simulation of UO2 to predict thermophysical properties” in J. Alloys and Comp., Vol. 360, 2003, pp. 210-216.
[9] N.-D. Morelon, D. Ghaleb “A new empirical potential for simulating the formation of defects and their mobility in uranium dioxide” in Phil. Mag., Vol. 83, 2003, pp. 1533–1550.
[10] Yamada K., Kurosaki K., Uno M., Yamanaka S. Evaluation of thermal properties of uranium dioxide by molecular dynamics // J. Alloys and Comp. 2000. Vol. 307. P. 10-15.

![Table 2. The melting point of uranium dioxide for different initial temperatures and interatomic potentials are obtained in [2]](https://thumb-us.123doks.com/thumbv2/123dok_us/8471207.1711326/5.595.60.553.100.331/melting-uranium-dioxide-different-temperatures-interatomic-potentials-obtained.webp)
