Published online January 20, 2015 (http://www.sciencepublishinggroup.com/j/ajls) doi: 10.11648/j.ajls.20150301.13
ISSN: 2328-5702 (Print); ISSN: 2328-5737 (Online)
Effectiveness of breeding methods for production of
superior genotypes and maintenance of genetic variance in
Faba Bean (
Vicia faba
, L.)
Hossam Mohammed Ibrahim
Crop Science Department, Faculty of Agriculture Alexandria University, Alexandria, Egypt
Email address:
To cite this article:
Hossam Mohammed Ibrahim. Effectiveness of Breeding Methods for Production of Superior Genotypes and Maintenance of Genetic Variance in Faba Bean (Vicia faba, L.). American Journal of Life Sciences. Vol. 3, No. 1, 2015, pp. 11-16. doi: 10.11648/j.ajls.20150301.13
Abstract:
The present study was carried out during the period from 2007/ 08 to 2011/2012 at Agricultural Research Station, Faculty of Agriculture, Alexandria University, Alexandria, Egypt. The study aimed at evaluating the effectiveness of pedigree (P), single seed descent (SSD), and mass selection (MS) breeding methods. Two F2 populations, derived from two crosses,were used. Twenty families derived from each of the three breeding methods in each cross were tested for seed yield (t/ ha), seed yield per plant (g) and its components in F6 generation. A randomized complete block design with three replications was used. Significant differences existed, within F6 families of each cross, for seed yield, seed yield per plant and its components by applying either of the three methods. The widest range in seed yield was obtained by the SSD method. The SSD breeding method produced consistently more superior families in either and over the two crosses with 22, 19 and 18 families for (SSD), (P) and (MS) methods, respectively. The genotypic (δ2G) and phenotypic (δ2Ph) variances, for seed yield, estimated from SSD
method were the highest compared with the other breeding methods over the two crosses. Heritability estimates, in broad sense, and expected genetic advance from selection for higher seed yield indicated that the SSD method recorded higher values (h2= 0.87-0.93, δG= 0.51- 0.85) compared with the other two methods. Based on the obtained results, it seems that the SSD breeding
method was more effective compared to the other two breeding methods, in producing superior genotypes in seed yield and maintaining genetic variance for further selection and improvement of that character. Considering the partial allogamous nature of the crop, it could be concluded that the SSD method was more efficient and could be less costly in breeding for high seed yield.
Keywords:
Faba Bean (Vicia faba, L.),Breeding Methods, Genetic Variance1. Introduction
Faba bean (Vicia faba L.) is the most important nutritive popular food crop in Egypt. It plays a major role in the Egyptian diet as a source of protein. The crop is partially allogamous species having an intermediate level of out-crossing (in the 20-25% range). Increasing seed yield and improving the stability of yield are the main objectives of most breeding programs.
Breeding methods employed in faba beans range from single seed descent as proposed by Brim (1966), through pedigree or bulk pedigree approaches to mass selection. Mass selection is the most widely used breeding method in faba bean improvement especially in upgrading local
population following hybridization (Nassib and Khalil, 1981).
Selection (PS) SSD AND Mass Selection (MS) in f5
generation of vigna unguiculata .Seed yield/plant was strongly and positively associated with branches/plant, clusters/plant and in all three selection methods. Results revealed the superiority of SSD over PS and MS schemes for the production of high yielding progenies ,for the maintenance of high variability and for handling the segregating materials. Gill et al. (2000) compared four selection methods and three intervarietal crosses of mungbean. They concluded that considerable variability was present among lines of single seed descent, pedigree selection and bulk methods to conduct effective selection for the improvement of yield and its components. They also reported variability among selection methods and between
varietal crosses in heritability and expected genetic advance for studied yield and yield components. Meena and Kumar (2012) reported that estimates of phenotypic variances for seed yield and its components in F4 showed that single seed
descent method was superior to pedigree method in maintaining relatively high variances over five crosses of chickpea.
The main objective of this investigation was to compare the effectiveness of pedigree, single seed content, and mass selection methods in improvement of seed yield and its components in faba bean.
2. Materials and Methods
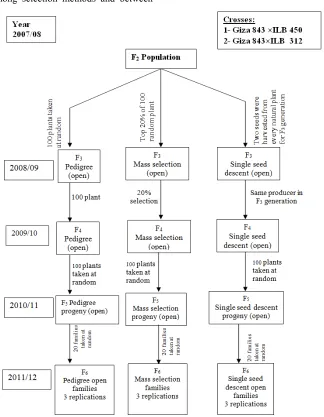
Fig 1. Outline of generation advance for Pedigree selection, Mass selection, and SSD methods
This study was carried out during the five years 2007/ 08 to 2011/2012 at Agricultural Research Station, Faculty of Agriculture, Alexandria University, Alexandria, Egypt.
The parental material consisted of three early maturing, medium seeded genotypes. These were Giza 843 (Egyptian, 100 seed weight 60- 65 g), International Lines of Broad Beans (ILB) ILB- 450 and ILB 312, (introduced from
ICARDA with 100 seed weight of 80 and 90g), respectively). The study aimed to evaluate the effectiveness of three selection methods in faba bean namely: Pedigree selection (PS), Single Seed Descent (SSD), and Mass selection (MS).
Two populations of the following two crosses were used, i.e., 1- Giza 843 × ILB 450, 2- Giza 843 × ILB 312.
F2 population were planted in the field, in ridges 60 cm apart with plants 20 cm apart within ridges.
The following characters were recorded, i.e, (1) Seed yield (t/ ha).(SYD), (2) Seed yield per plant (g).( SYD/ pl ), (3) 100-seed weight (g).( 100-SW), (4) Number of pods per plant (NP/PL), (5) Number of seeds per plant (NS/PL), (6) Number of branches per plant (NB/PL)
The pattern of generation advance for pedigree selection, single seed descent, and mass selection methods is presented in Fig. 1.
2.1. Statistical Analysis
The evaluation of pedigree, Single seed descent, and mass selection breeding methods was determined by planting the
F6 families for each method in a trial of randomized
complete block design. The three trials of each cross were subjected to combined analysis according to the procedure outlined by Gomez and Gomez (1984). The efficiency of the three breeding methods were compared based on the following:
1. The different measured statistics; i.e. ranges, means and number of superior families for all studied characters. 2. The different genetic parameters; i.e. variances
(genotypic δ2G and phenotypic δ2ph), heritability (h2),
expected genetic advance (∆G) and coefficient of
variability for seed yield per ha., Seed yield per plant (g).and 100-seed weight (g).
3. Results and Discussion
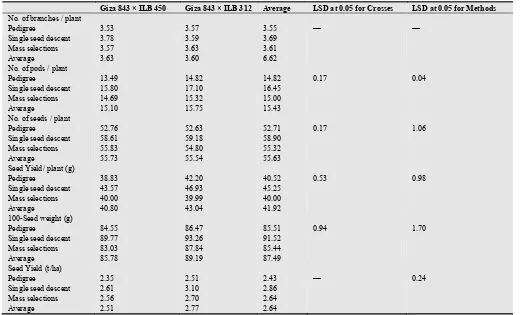
Table (1). Average F6 seed yield (t/ha) and other agronomic traits produced by applying three breeding methods in two crosses
Giza 843 × ILB 450 Giza 843 × ILB 312 Average LSD at 0.05 for Crosses LSD at 0.05 for Methods No. of branches / plant
Pedigree 3.53 3.57 3.55 –– ––
Single seed descent 3.78 3.59 3.69
Mass selections 3.57 3.63 3.61
Average 3.63 3.60 6.62
No. of pods / plant
Pedigree 13.49 14.82 14.82 0.17 0.04
Single seed descent 15.80 17.10 16.45
Mass selections 14.69 15.32 15.00
Average 15.10 15.75 15.43
No. of seeds / plant
Pedigree 52.76 52.63 52.71 0.17 1.06
Single seed descent 58.61 59.18 58.90
Mass selections 55.83 54.80 55.32
Average 55.73 55.54 55.63
Seed Yield/ plant (g)
Pedigree 38.83 42.20 40.52 0.53 0.98
Single seed descent 43.57 46.93 45.25
Mass selections 40.00 39.99 40.00
Average 40.80 43.04 41.92
100-Seed weight (g)
Pedigree 84.55 86.47 85.51 0.94 1.70
Single seed descent 89.77 93.26 91.52
Mass selections 83.03 87.84 85.44
Average 85.78 89.19 87.49
Seed Yield (t/ha)
Pedigree 2.35 2.51 2.43 –– 0.24
Single seed descent 2.61 3.10 2.86
Mass selections 2.56 2.70 2.64
Average 2.51 2.77 2.64
Analysis of variance for the six trials revealed significant differences between selected F6families for all studied
characters. The homogeneity of error between the two crosses enabled the performance of combined analysis, the results of which are presented in (Table 1). Significant differences were found between the two crosses in seed yield per plant, 100-seed weight, and number of pods per plant, whereas the remaining characters showed insignificant differences. It should be noted that cross. Giza 843 × ILB 312 gave significantly higher mean values for those three characters compared to cross Giza 843 × ILB 450. Meanwhile, single seed descent selection method resulted in significantly higher values, to both or one of the other two
breeding methods (Pedigree and Mass selections), in seed yield per ha, seed yield per plant, 100-seed weight, number of pods per plant and number of seeds per plant. The interaction of crosses × breeding methods was insignificant for all studied characters since crosses performed similarly in the applied selection methods.
high number of pods per plant in the first cross.
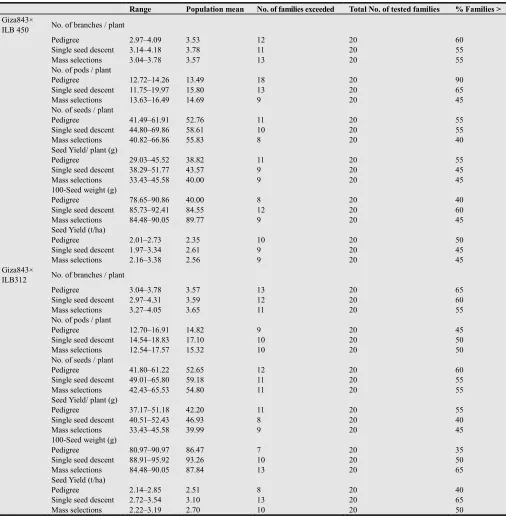
Table (2). Range, population means of seed yield and other agronomic traits and number of superior families derived through the three breeding methods Range Population mean No. of families exceeded Total No. of tested families % Families > Giza843×
ILB 450 No. of branches / plant
Pedigree 2.97–4.09 3.53 12 20 60
Single seed descent 3.14–4.18 3.78 11 20 55
Mass selections 3.04–3.78 3.57 13 20 55
No. of pods / plant
Pedigree 12.72–14.26 13.49 18 20 90
Single seed descent 11.75–19.97 15.80 13 20 65
Mass selections 13.63–16.49 14.69 9 20 45
No. of seeds / plant
Pedigree 41.49–61.91 52.76 11 20 55
Single seed descent 44.80–69.86 58.61 10 20 55
Mass selections 40.82–66.86 55.83 8 20 40
Seed Yield/ plant (g)
Pedigree 29.03–45.52 38.82 11 20 55
Single seed descent 38.29–51.77 43.57 9 20 45
Mass selections 33.43–45.58 40.00 9 20 45
100-Seed weight (g)
Pedigree 78.65–90.86 40.00 8 20 40
Single seed descent 85.73–92.41 84.55 12 20 60
Mass selections 84.48–90.05 89.77 9 20 45
Seed Yield (t/ha)
Pedigree 2.01–2.73 2.35 10 20 50
Single seed descent 1.97–3.34 2.61 9 20 45
Mass selections 2.16–3.38 2.56 9 20 45
Giza843×
ILB312 No. of branches / plant
Pedigree 3.04–3.78 3.57 13 20 65
Single seed descent 2.97–4.31 3.59 12 20 60
Mass selections 3.27–4.05 3.65 11 20 55
No. of pods / plant
Pedigree 12.70–16.91 14.82 9 20 45
Single seed descent 14.54–18.83 17.10 10 20 50
Mass selections 12.54–17.57 15.32 10 20 50
No. of seeds / plant
Pedigree 41.80–61.22 52.65 12 20 60
Single seed descent 49.01–65.80 59.18 11 20 55
Mass selections 42.43–65.53 54.80 11 20 55
Seed Yield/ plant (g)
Pedigree 37.17–51.18 42.20 11 20 55
Single seed descent 40.51–52.43 46.93 8 20 40
Mass selections 33.43–45.58 39.99 9 20 45
100-Seed weight (g)
Pedigree 80.97–90.97 86.47 7 20 35
Single seed descent 88.91–95.92 93.26 10 20 50
Mass selections 84.48–90.05 87.84 13 20 65
Seed Yield (t/ha)
Pedigree 2.14–2.85 2.51 8 20 40
Single seed descent 2.72–3.54 3.10 13 20 65
Mass selections 2.22–3.19 2.70 10 20 50
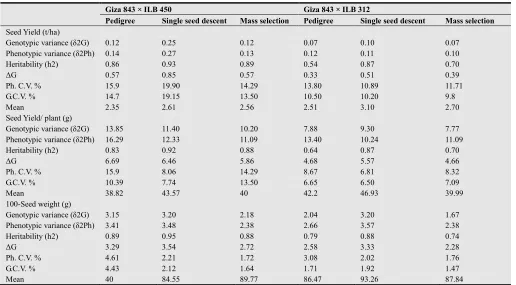
These findings were further emphasized through the data presented in (Table 3) for seed yield of tested F6 families in
the two crosses. Single seed descent selection showed almost double the values of phenotypic and genotypic variances compared to pedigree and mass selection methods, higher genetic advance from selection and heritability values in both crosses, The same trend of results could be observed for Seed yield per plant and 100-seed weight , where SSD method recorded considerable genotypic and phenotypic variances , higher genetic advance and heritability values , in addition to higher mean values compared to the pedigree and
mass selection methods .
yield components overall the two crosses. That method also resulted in higher number, or comparable, of high yield lines depending on the cross. At the F6 generation SSD maintained
higher genotypic and phenotypic variances compared to PS and MS methods, gave higher heritability and expected genetic advance estimates for seed yield as an average of the two crosses. Similar findings were reported by Gill et al.
(2000) and Meena and Kumar (2012). Dahiya et al. (1986) emphasized the superiority of single seed descent as a
selection method for the production of high yielding progenies, maintaining high variability and for handling the segregating material in mungbean.
In conclusion, the findings of the present investigation indicate the superiority of single seed descent selection method over mass selection and pedigree selection methods and could be recommended for application in faba bean breeding in local breeding programs.
Table (3). The genetic parameters estimated for seed yield and other agronomic trait of the F6 families derived through the three breeding methods for the two crosses
Giza 843 × ILB 450 Giza 843 × ILB 312
Pedigree Single seed descent Mass selection Pedigree Single seed descent Mass selection
Seed Yield (t/ha)
Genotypic variance (δ2G) 0.12 0.25 0.12 0.07 0.10 0.07
Phenotypic variance (δ2Ph) 0.14 0.27 0.13 0.12 0.11 0.10
Heritability (h2) 0.86 0.93 0.89 0.54 0.87 0.70
∆G 0.57 0.85 0.57 0.33 0.51 0.39
Ph. C.V. % 15.9 19.90 14.29 13.80 10.89 11.71
G.C.V. % 14.7 19.15 13.50 10.50 10.20 9.8
Mean 2.35 2.61 2.56 2.51 3.10 2.70
Seed Yield/ plant (g)
Genotypic variance (δ2G) 13.85 11.40 10.20 7.88 9.30 7.77
Phenotypic variance (δ2Ph) 16.29 12.33 11.09 13.40 10.24 11.09
Heritability (h2) 0.83 0.92 0.88 0.64 0.87 0.70
∆G 6.69 6.46 5.86 4.68 5.57 4.66
Ph. C.V. % 15.9 8.06 14.29 8.67 6.81 8.32
G.C.V. % 10.39 7.74 13.50 6.65 6.50 7.09
Mean 38.82 43.57 40 42.2 46.93 39.99
100-Seed weight (g)
Genotypic variance (δ2G) 3.15 3.20 2.18 2.04 3.20 1.67
Phenotypic variance (δ2Ph) 3.41 3.48 2.38 2.66 3.57 2.38
Heritability (h2) 0.89 0.95 0.88 0.79 0.88 0.74
∆G 3.29 3.54 2.72 2.58 3.33 2.28
Ph. C.V. % 4.61 2.21 1.72 3.08 2.02 1.76
G.C.V. % 4.43 2.12 1.64 1.71 1.92 1.47
Mean 40 84.55 89.77 86.47 93.26 87.84
References
[1] Allard, R.W. and J. Adams (1969). Population studies in predominantly self-pollinated species. Inter-genotypic competition and population structure in barley and wheat. Amer. Natural., 103: 6211-6245.
[2] Brim, C.A. (1966). A modified pedigree method of selection in soybean. Crop Sci., 6: 222-283.
[3] Cooper, J.P. (1982). Plant breeding for different climates. In Food Nutrition and Climate. P. 79- 99. (Blaxter, S.K. and Fowden L.D., ed. 1- Applied Science Publishers. London).
[4] Dahiya, B.S., Sekhar, M.J., S.E. Swaramurthy, M.R. Naidu and M. Bail (1986). Selection procedures in chickpea breading. In Genetic and Crop Improvement. P. 63-75. In Genetic and crop improvement (Gupta, P.K. and Bahl, J.R.ed.) Proceedings of t h e symposium on advances in genetics and crop improvement, Meerut, Dec., 1984., Rastogi and Company,India.
[5] Emping, L.T. and W.R. Febr (1971). Evaluation of methods of
generation advance in bulk hybrid soybean populations. Crop Sci. 11: 51- 54.
[6] Gill, J.S., M.M. Verma, R.K. Gumber and J.S. Brar (1995). Comparative efficiency of four selection methods for deriving high-yielding lines in mungbean (Vigna radiata (L.) Wilczek). Springer Berlin, Heidelberg, 90 (3): 554-560
[7] Gill, J.S., R.K. Gumber, M.M. Verma and P. Rathore (2000). Genetic estimates of advanced mungbean lines derived through different selection methods. Crop Improvement Society, India. 27: 1, 88-98.
[8] Gomez, K.A. and A.A. Gomez (1984). Statistical Procedures for Agricultural Research. 2nd Ed., John Wiley and Sons, New York, USA.
[9] Haddad, N.I. and F.J. Muehlbauer (1981). Comparsion of random bulk population and single-seed descent methods for lentil breeding. Euphytica, 30: 643- 651.
[11] Mehta, D.R. and P.P Zaveri (1997). Single seed versus single plant selection in cowpea .Legume Research 20, 130-132.
[12] Nassib, A.M. and S.A.Khalil (1982). Population improvement in faba beans. In: "Faba Bean Improvement, (eds). G. Wawtin and C. Webb" Martinus Nijhoff Publishers, The Hague and Netherlands, 71-74.
[13] Pawar, I.S., R.S. Paroda and S. Singh (1986). A comparison of
pedigree selection, single and seed descent and bulk method in two wheat crosses. Crop Improve. 13(1): 34- 37.
[14] Rahman, M.A. and P.N. Bahl (1985). Comparison of single seed descent, mass selection and random bulk methods in chickpea. India Journal of Genetics 45: 186- 195.