Prediction of Mechanical Properties of Plasma
Sprayed Thermal Barrier Coatings (TBCs)
with Genetic Programming (GP)
Mohammed Yunus
#1, Mohammad S. Alsoufi
#2#Mechanical Engineering Department, College of Engineering and Islamic Architecture, Umm Al-Qura
University, KSA, Makkah Abstract—The mechanical properties especially
hardness and porosity of plasma sprayed thermal barrier coating (TBC) play a major role in deciding their lifetime and performance with respect to input process parameters such as power input of plasma jet, coating thickness, stand-off distance and type of coating. Sources of mechanical properties values are experimental measurements only, and empirical correlations are to be built up (without appropriate fitting techniques), however, these are often too complicated, expensive and time consuming and can lead to erroneous results. Genetic programming (GP) is the most common approach from various evolutionary computation methods using multivariate regression fitting for the modelling of various systems. This study presents a new model for estimating the mechanical properties of TBC using GP. On the basis of a training data set, different genetic models for mechanical properties with great accuracy were obtained during simulated evolution. The newly developed GP-based computational model provides a more accurate prediction of mechanical properties compared to the empirical correlations, and the results can then be utilized to estimate a future set of parameters based on the historical data.
Keywords—Hardness, Porosity, Thermal Barrier Coatings, Plasma Spraying, Genetic Programming.
I. INTRODUCTION
Thermal barrier coatings (TBCs) are attracting ever-increasing attention in relation to various industrial, automobiles, gas turbines, power generators, and aerospace applications as they prepare a suitable engineering surface for existing materials and alloys due to their ability to withstand severe working conditions such as high temperature, oxidation, excessive wear and so on [1] [2]. Generally, TBCs provide thermal insulation, oxidation, wear, corrosion, chemical degradation resistance by coating the surface with industrial ceramic coatings using an atmospheric plasma spray coating method [3]. Moreover, TBCs are ceramic coatings applied on the metal substrate in order to increase the life of engineering materials. Furthermore, TBCs are formed by two layers namely, a metallic bond-coat layer, which prevents oxidation
and corrosion and increases adhesion strength [4] and a ceramic coating layer, which protects metal from severe working conditions [5] [6] [7][8]. Plasma-sprayed Alumina, Alumina, and Titania, Zirconia-based ceramics (Partially Stabilized Zirconia and Super-Z alloy) are the most significant coating materials because of their low thermal conductivity, excessive hardness, high wear resistance, oxidation, and reduced porosity as a result of the plasma spraying process [7] [9]. However, the durability of TBCs under severe mechanical loading conditions encountered remains one of the main issues outstanding. Hence, the development of TBCs demands better understanding of the mechanical performance of the coating materials under different process parameters to ensure the life and reliability of the various components.
During the past one to two decades, various plasma-sprayed TBC systems have been developed and characterized to determine their mechanical properties at ambient as well as at elevated temperatures. These attempts have been made using TBC substrate systems. However, various investigations have been carried out to present a multitude of mechanical properties of different TBC materials which can be conveniently employed as a history of past data. Mechanical properties of plasma-sprayed TBCs have been evaluated and compiled in this report to provide them as a history of design database. The mechanical properties include hardness and porosity determined under various input conditions. TBC associated with porosity so that they would be expected to reveal some of mechanical properties. The directionality effect has been quantified through hardness measurements and is also presented in this report [10] [11] [12].
The four different commercial, industrial ceramic materials are used in hardness and porosity testing at ambient temperature (25°C) for test specimens and spray parameters to plasma-spray. The final surface finish of test samples was achieved using a 500-graded diamond grinding wheel [13] [14].
A. The Atmospheric Plasma Spraying Process
electric arc which is struck between the cathode (tungsten electrode) and an anode (nozzle) in the presence of the mixture of Argon and nitrogen/hydrogen in the chamber. Coating material particles are heated within the plasma jet, and at high velocities, molten droplets sprayed onto the surface of a substrate to produce the coating. APS ceramic coatings are widely employed in those engineering applications which demand wear resistance, corrosion resistance and high strength at elevated temperatures [15][16].
B. Genetic Programming (GP)
Genetic Programming (GP) is an estimation or automated machine learning method instigated by natural evolution like biological growth to develop computer programs with high fitness to a particular process output by transporting a population of small specific programs [17]. GP is used for regression and binary classification problems. Various programs are produced by mutation and crossover using computational analog. We assign to the programs created classifiers. The suitability of each variable is evaluated using a fitness function to select the successful variables. GP also uses the principle of Darwinian Natural Selection to select, evolve and reproduce ―fitter‖ programs better than would a random search process. The symbolic regression function is too complex to assess by human trial and error functions whereas the machine learning technique of GP maps a set of inputs data to known output data of engineering problems to determine data mining and knowledge discovery. GP thus provides a significant benefit in many areas of science and industry [18].
The solutions generated by GP are computer programs which are easy to inspect, evaluate, test and are also easy to understand in terms of the relationship between input variables and output data as well as to tap the uncovered relationships that were unknown before. GP output results are fed into both the model and the constants concurrently. It is very successful in solving a broad range of problems involving systems modelling (SM), curve fitting (CF), data modelling (DM) and symbolic regression (SR). Applications include industrial process control (IPC), financial trading (FT), time series prediction (TSP), economic modelling (EM), optimisation and scheduling (O & S), medicine, signal processing (SP), entertainment and computer games (E & CG) [19] [20] [21].
Symbolic regression discovers both the working model of a target function and its fixed coefficients, or at least an approximation to these and differs from other types of regression e.g. polynomial regression which confines itself to merely trying to determine the coefficients of a pre-defined order of a polynomial. The GP technique involves obtaining evolutionary algorithms (EA) based on highlights of the study of natural selection and evolution to solve
problems using a process of first generating many random problem solvers (programs) rather than focussing on explicit design and analysis. Each program is executed and rated according to a fitness value defined by the developer similar to biological evolution in nature. EA selects the best programs in each generation and produces them [22][23].
This paper presents a new model for estimating/predicting the mechanical properties i.e., porosity (%), and hardness (RHc) of TBCs with various input parameters required for characterization using a genetic programming approach. In addition to this, it includes deriving empirical correlations used in forecasting mechanical property values to an accuracy level of 98.99% for characterization of MP of TBCs using DiscipulusTM software. The new model was designed to be simpler as it eliminates the numerous computations involved in any equation of state applications. These equations would help in developing and testing the developed or would be developed correlations and empirical relations in the future [24].
II. MATERIALS AND METHODS
The substrate made of mild steel and standard dimensions 48 mm × 48 mm × 6 mm was selected. One of the substrate flat sides was initially cleaned with acetone, subjected to grit blasting (using alumina) and degreased in ethyl alcohol. Several jigs and fixtures were used for mounting the specimens according to the spraying requirements. These substrates were secured tightly in suitable holders after cleaning. The initial thickness of the substrate was measured on a few spots to measure the bond coat and the ceramic coating thickness. The substrate on the mount was finally degreased again with ethyl alcohol. These steps were followed very precisely because any quantity of contamination on the substrate was likely to provide a weak point of adhesion for the subsequent coating. In the present study, 96% high-purity of Alumina Ceramic (Al2O3),
Alumina Titania (Al2O3+TiO2), Partially Stabilized
Zirconia ZrO2 (PSZ) and Super-Z alloy (20 % of
Al2O3 + 80% of PSZ) is used as the workpiece
material[5] [6] [7].
the average bond coat thickness was ascertained. The substrate was kept air cooled during spraying, the oven-dried plasma sprayable TBC powders of the desired composition were then plasma sprayed onto the bond-coated substrates. Here again, the number of passes required for deposition of a thickness of coating was ascertained by measuring the thickness of the ceramic coating after a single pass under the present chosen conditions of spraying. The thickness of the coated substrate was measured (metallic bond-coat layer and ceramic coating layer) on the substrate [24].
A. Porosity of TBC
The porosity of TBC prepared by thermal spraying technique is an important aspect in deciding various strengths and insulation properties such as the process of welding. Porosity referred to as the void fraction (a measure of the void or space) of a coated material. It is typically characterized as a percentage (0 to 100%) of the voids volume within the total volume. Pores (i.e., their size, shape and amount) reduce the strength of ceramics because they reduce the cross-sectional areas over which a load can be applied and, consequently, lower the stress that these materials can support. It can take on various forms such as open, closed, connected, elongated, etc. Porosity is a general occurring feature of thermal spray processes and is a very dynamic process, involving thermal, kinetic and chemical processes with serious issues as regards porosity in TBCs. The measurement of porosity is easy to understand but difficult to carry out. Numerous techniques are used to estimate porosity and the light microscope image analysis is the most well-known method which measures porosity along with checking the thickness, interfaces, contamination, and so on. Preparation of the sample includes sectioning, cleaning, mounting, grinding and polishing before microscopic inspection.
ASTM E2109-01 comprises methods to give porosity grades on metallographic samples and are prepared according to ASTM E1920 [25]. It uses an area measurement where area is equal to the porosity of the volume as long as the small pores are evenly dispersed [19] [26].
III.GENETIC PROGRAMMING METHODOLOGY
Data groups of experiments considered for the analysis of mechanical properties of different types of TBCs having spray factors such as standoff distance (100-140 mm), input power (16-40 kW) and thickness of coating (100-300 µm) were taken. The data groups were randomized using DiscipulusTM software. The randomized data groups were provided to the software in three groups viz., training, validation and applied [17]. Trial runs were carried out to find out the best parameters that generated an optimal solution in the minimum possible time. Initially, the runs were conducted with
the default one by one the parameters such as population size, crossover rate, DSS subset size, and the FPU registers used were varied to find optimum values [18]. The trials showed the following results. The population size of 600 was optimum rather than the default setting of 500. A higher crossover rate (75% non-homologous and 25% homologous) was found to be optimum. A smaller DSS subset size 60 was more optimal than the default 100. The above factors favourably affected result generation.
A. Regression
Regression analysis is a statistical method and symbolic regression discovers both the working model of a target function and its fixed coefficients, or at least an approximation to these.
B. Fitness Measurement
Fitness is nothing but how far the data value predicted by the GP coincides with the experimental value.
C. Correlation Coefficient, r/R
The quantity refers to linear correlation coefficient to measure the strength and direction of a linear relationship between two variables. The value of r lies such that -1 <r< +1 [27]. The (+) and (–) signs are utilized for positive and negative linear correlations, respectively. If P and Q have a strong positive linear correlation, r is close to +1 and indicates a perfect concrete fit i.e. a relationship between P and Q such that as values for P increase, those for Q also increase. Whereas, if P and Q have a strong negative linear correlation, r is close to -1 indicating a perfect negative fit showing a relationship between P and Q such that as values for
P increase, those for Q also decrease. A value r = 0 for no linear/ weak correlation and a value near zero indicates a random, nonlinear relationship between the two variables (inputs and output). The square of the correlation coefficient gives the coefficient of determination, r2, to find the proportion of the variance of output that is predictable from the inputs. It helps us to determine how certain one can be in making predictions from a defined model. r2 is defined from the ratio of the illustrated variation to the total variation in the range of 0 <r2< 1 signifies the strength of the linear correlation between P and
Q or represents the percentage of the data which is closest to the line of best fit [28]. If r = 0.977, then r2
= 0.994, which means that 99.4% of the total variation in Q can be explained by the linear relationship between P and Q and the remaining 0.6% of the variation in Q continues unexplained [26]. D. Factors involved in GP Modelling
TABLEI
VARIOUS FACTORS INVOLVED IN MODELLING GP
Terminal Set T = {P, Random-Constants}
Instructional Set
F = {Arithmetic, Subtraction, Division, Addition, Multiplication, Exponential and Trigonometric}
Fitness r2
The square root of the sum of the square of absolute value of the differences (errors), between the program’s output and the observed data.
Termination An individual emerges whose sum of absolute
errors is less than specified
Parameters
(a) Required number of runs are completed, or (b) Required correlation coefficient is obtained
IV.RESULTS AND DISCUSSIONS
In GP modelling, it is important select proper instructions from set F and available terminal genes from set f(0) [17]. From these, the evolutionary process will try to build an organism (i.e.
mathematical model) as fit as possible for the prediction of mechanical properties and which consists of both instructions and function genes behaving similarly to the nature of computer programs which differ in form and size [28] [29]. Measurement acquired converted into three independent data sets: training, validation, applied data sets. type of coating, coating thickness, stand-off distance, input jet power was used as independent input variables and the porosity and hardness number as the dependent output variable. From the training data set, different models for mechanical properties were developed by the genetic programming [22] [23][30]. Using GP simulation, the best mathematical model for porosity and hardness is given by Eq. (1) and Eq. (2), respectively.
(1)
Where;
(2)
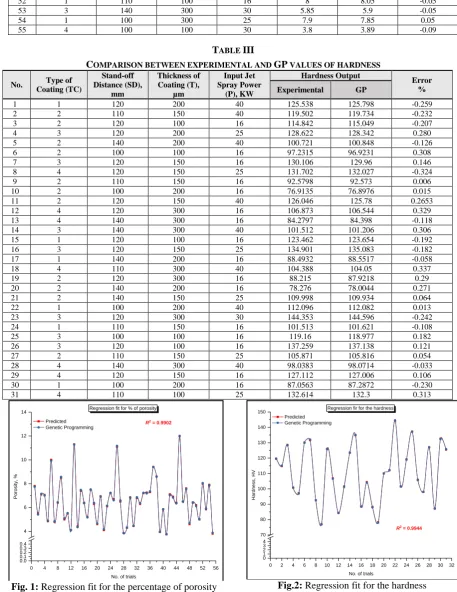
Comparison between the experimental outputs and predicted outputs using the derived mathematical model obtained from GP are illustrated in Tables II and III for porosity and hardness of the TBC mechanical properties. Errors are very low and
percentage of error is less than +/ -1% which shows that results are highly acceptable with this predicted model. Besides, Figures 1 and 2 show the regression fit for the % of porosity and hardness of the TBC
mechanical properties.
TABLE II
COMPARISON BETWEEN EXPERIMENTAL AND GP VALUES OF POROSITY
No. Type of
Coating (TC)
Stand-off Distance (SD),
mm
Thickness of Coating (T),
µm
Input Jet Spray Power
(P), KW
Porosity Output
Error %
experimental GP
1 3 140 200 40 7.8 7.74 0.06
2 1 140 100 40 5.5 5.41 0.09
3 3 120 150 16 7.1 7.14 -0.04
4 2 100 100 25 7.05 7.01 0.04
5 3 140 100 30 4.85 4.9 -0.05
6 4 110 300 16 10 9.92 0.08
7 2 110 100 40 4.8 4.84 -0.04
8 3 110 150 25 6.4 6.44 -0.04
9 3 120 200 16 8.5 8.57 -0.07
10 2 140 100 40 5 5.1 -0.1
11 1 140 150 30 5.5 5.53 -0.03
12 3 100 100 40 4.1 4.09 0.01
13 1 100 200 16 11.3 11.28 0.02
14 4 140 100 30 4.4 4.35 0.05
15 1 100 100 25 7.4 7.47 -0.07
16 4 140 100 25 6.4 6.36 0.04
17 4 110 300 30 5.2 5.17 0.03
18 2 100 100 16 7.5 7.51 -0.01
19 2 120 150 25 6.3 6.39 -0.09
20 2 120 150 30 4.6 4.66 -0.06
21 2 140 150 25 6.9 6.95 -0.05
22 4 100 150 30 4.1 4.18 -0.08
23 4 100 100 25 6.1 6.15 -0.05
24 2 140 100 25 7.2 7.23 -0.03
25 3 110 300 25 6.7 6.61 0.09
26 2 100 300 16 11.1 11.17 -0.07
27 4 120 150 16 6.5 6.59 -0.09
28 4 120 150 30 3.85 3.846 0.004
29 4 100 200 30 4.3 4.32 -0.02
30 2 110 150 25 6.85 6.82 0.03
31 3 140 100 40 4.45 4.46 -0.01
32 2 120 300 25 6.8 6.86 -0.06
33 1 120 300 30 6.3 6.35 -0.05
34 2 110 300 25 7.2 7.23 -0.03
35 1 100 150 25 7.25 7.18 0.07
36 1 120 300 25 7.3 7.36 -0.06
37 2 140 150 16 9.4 9.39 0.01
38 4 100 200 16 8.6 8.59 0.01
39 4 110 100 40 3.95 3.948 0.002
40 2 120 300 30 5.85 5.86 -0.01
41 3 120 100 40 3.75 3.76 -0.01
42 3 100 100 16 7.1 7.03 0.07
43 3 140 100 25 6.9 6.83 0.07
44 3 120 300 25 6.4 6.34 0.06
45 1 140 300 40 12 11.99 0.01
46 3 140 150 25 6.5 6.49 0.01
47 3 110 150 16 7.6 7.56 0.04
48 3 100 150 30 4.6 4.69 -0.09
49 4 100 100 16 6.4 6.43 -0.03
51 1 100 100 40 5 5.02 -0.02
52 1 110 100 16 8 8.05 -0.05
53 3 140 300 30 5.85 5.9 -0.05
54 1 100 300 25 7.9 7.85 0.05
55 4 100 100 30 3.8 3.89 -0.09
TABLE III
COMPARISON BETWEEN EXPERIMENTAL AND GP VALUES OF HARDNESS
No. Type of
Coating (TC)
Stand-off Distance (SD),
mm
Thickness of Coating (T),
µm
Input Jet Spray Power
(P), KW
Hardness Output
Error %
Experimental GP
1 1 120 200 40 125.538 125.798 -0.259
2 2 110 150 40 119.502 119.734 -0.232
3 2 120 100 16 114.842 115.049 -0.207
4 3 120 200 25 128.622 128.342 0.280
5 2 140 200 40 100.721 100.848 -0.126
6 2 100 100 16 97.2315 96.9231 0.308
7 3 120 150 16 130.106 129.96 0.146
8 4 120 150 25 131.702 132.027 -0.324
9 2 110 150 16 92.5798 92.573 0.006
10 2 100 200 16 76.9135 76.8976 0.015
11 2 120 150 40 126.046 125.78 0.2653
12 4 120 300 16 106.873 106.544 0.329
13 4 140 300 16 84.2797 84.398 -0.118
14 3 140 300 40 101.512 101.206 0.306
15 1 120 100 16 123.462 123.654 -0.192
16 3 120 150 25 134.901 135.083 -0.182
17 1 140 200 16 88.4932 88.5517 -0.058
18 4 110 300 40 104.388 104.05 0.337
19 2 120 300 16 88.215 87.9218 0.29
20 2 140 200 16 78.276 78.0044 0.271
21 2 140 150 25 109.998 109.934 0.064
22 1 100 200 40 112.096 112.082 0.013
23 3 120 300 30 144.353 144.596 -0.242
24 1 110 150 16 101.513 101.621 -0.108
25 3 100 100 16 119.16 118.977 0.182
26 3 120 100 16 137.259 137.138 0.121
27 2 110 150 25 105.871 105.816 0.054
28 4 140 300 40 98.0383 98.0714 -0.033
29 4 120 150 16 127.112 127.006 0.106
30 1 100 200 16 87.0563 87.2872 -0.230
31 4 110 100 25 132.614 132.3 0.313
Fig. 1: Regression fit for the percentage of porosity Fig.2: Regression fit for the hardness
V. CONCLUSIONS
In this paper, new models of the porosity and hardness of mechanical properties at different spraying parameters for various thermal barrier coatings were developed using GP. With the help of
a computational model, the mechanical properties for TBCs involving various spray parameters by easy substitution without carrying out any experiments can be predicted. The comparison between the new GP-based model and the experimental results indicated that the new model is more accurate close to +/- 0.006 to 0.009. Therefore,
0 4 8 12 16 20 24 28 32 36 40 44 48 52 56 0.0
0.1 0.2 0.3 0.4 4 6 8 10 12 14
Porosit
y
,
%
No. of trials Predicted
Genetic Programming
Regression fit for % of porosity
R2 = 0.9902
0 2 4 6 8 10 12 14 16 18 20 22 24 26 28 30 32 0
1 2 3 4 70 80 90 100 110 120 130 140 150
H
ardness
,
H
V
No. of trials Predicted
Genetic Programming
Regression fir for the hardness
the new model can be considered an alternative method to estimate the mechanical properties when the experimental measurement or correlations are not available. The correctness of solutions achieved by GP depends on correlated evolutionary parameters, the number of experimental results and their level of accuracy. To improve the structure of the model during evolution, more information supplied by providing the number of measurements and in the present proposed mathematical model for verifying the experimental results is subject to adaptation with reliability of about 99.4%. In the testing stage, the GP model gives the same result as found out during the experiment with the reliability of cent percent. The GP approach has thus proved to be a highly skilled and advantageous tool for recognizing correlations in data when no proper theoretical or other methods are possible or available.
CONFLICTS OF INTEREST
The authors have no conflicts of interest.
FUNDING
The authors received no financial support for the research and/or for the publication of this article.
REFERENCES
[1] Clarke, D.R., M. Oechsner, and N.P. Padture, Thermal-barrier coatings for more efficient gas-turbine engines.
MRS Bulletin, 2012. 37(10): p. 891-898.
[2] Vaßen, R., et al., Testing and evaluation of thermal-barrier
coatings. MRS Bulletin, 2012. 37(10): p. 911-916.
[3] Sampath, S., et al., Processing science of advanced
thermal-barrier systems. MRS Bulletin, 2012. 37(10): p.
903-910.
[4] Pan, W., et al., Low thermal conductivity oxides. MRS Bulletin, 2012. 37(10): p. 917-922.
[5] Yunus, M. and M.S. Alsoufi, Multi-Objective Optimization of Joint Strength of Dissimilar Aluminum Alloys Formed by Friction Stir Welding Using Taguchi-Grey Relation
Analysis. International Journal of Engineering &
Technology IJET-IJENS, 2016. 16(04): p. 10-17.
[6] Yunus, M., M.S. Alsoufi, and S.M. Munshi, Taguchi-Grey relation analysis for assessing the optimal set of control factors of thermal barrier coatings for high-temperature
applications. Mechanics of Advanced Materials and
Modern Processes, 2016. 2(1): p. 4.
[7] Yunus, M. and M.S. Alsoufi, Multi-output optimization of tribological characteristics control factors of thermally sprayed industrial ceramic coatings using hybrid Taguchi-grey relation analysis. Friction, 2016. 4(3): p. 208-216. [8] Li, C.-J. and A. Ohmori, Relationships between the
microstructure and properties of thermally sprayed
deposits. Journal of Thermal Spray Technology, 2002.
11(3): p. 365-374.
[9] Yunus, M. and M.S. Alsoufi, A Statistical Analysis of Joint Strength of Dissimilar Aluminium Alloys Formed By Friction Stir Welding Using Taguchi Design Approach, Anova For The Optimization Of Process Parameters.
IMPACT: International Journal of Research in Engineering & Technology (IMPACT: IJRET), 2015. 3(7): p. 63-70. [10] Shrestha, S. and A. Sturgeon, Characteristics and
electrochemical corrosion behaviour of thermal sprayed aluminium (TSA) coatings prepared by various wire
thermal spray processes. TWI Ltd, 2005: p. 4-8.
[11] Miller, R.A., Current status of thermal barrier coatings —
An overview. Surface and Coatings Technology, 1987.
30(1): p. 1-11.
[12] Miller, R.A., Thermal barrier coatings for aircraft engines:
history and directions. Journal of Thermal Spray
Technology, 1997. 6(1): p. 35.
[13] Beardsley, M.B., Thick thermal barrier coatings for diesel
engines. Journal of Thermal Spray Technology, 1997. 6(2):
p. 181-186.
[14] Soltani, R., T.W. Coyle, and J. Mostaghimi, Creep Behavior of Plasma-Sprayed Zirconia Thermal Barrier
Coatings. Journal of the American Ceramic Society, 2007.
90(9): p. 2873-2878.
[15] Eaton, H.E. and R.C. Novak, Sintering studies of
plasma-sprayed zirconia. Surface and Coatings Technology, 1987.
32(1): p. 227-236.
[16] Brink, R.C., Material Property Evaluation of Thick Thermal Barrier Coating Systems. Journal of Engineering for Gas Turbines and Power, 1989. 111(3): p. 570-577. [17] Yunus, M., J.F. Rahman, and S. Ferozkhan, Genetic
programming approach for the prediction of thermal
characteristics of ceramic coatings. IJIERD, 2011. 2(1): p.
69-79.
[18] Yunus, M., J.F. Rahman, and S. Ferozkhan, Evaluation of machinability characteristics of industrial ceramic coatings using genetic programming based approach.
International Journal of Mechanical Engineering and Technology (IJMET), 2011. 2(2): p. 126-137.
[19] Koza, J.R., Genetic Programming: On the Programming of
Computers by Natural Selection. 1992, Cambridge, MA.:
MIT Press. 836.
[20] Koza, J.R., Genetic Programming II (Automatic Discovery
of Reusable Programs). 1994, Massachusetts: The MIT
Press. 768.
[21] Koza, J.R., et al., Genetic Programming III: Darwinian
Invention and Problem Solving. 1999: Morgan Kaufmann.
1154.
[22] Brezocnik, M., M. Kovacic, and M. Ficko, Prediction of
surface roughness with genetic programming. Journal of
Materials Processing Technology, 2004. 157–158: p. 28-36. [23] Brezocnik, M. and M. Kovacic, Integrated Genetic
Programming and Genetic Algorithm Approach to Predict
Surface Roughness. Materials and Manufacturing
Processes, 2003. 18(3): p. 475-491.
[24] Cruse, T.A., B.P. Johnsen, and A. Nagy, Mechanical properties testing and results for thermal barrier coatings.
Journal of Thermal Spray Technology, 1997. 6(1): p. 57. [25] E2109-01, A., Standard Test Methods for Determining
Area Percentage Porosity in Thermal Sprayed Coatings.
2014, ASTM International: West Conshohocken, PA. [26] Choi, S.R., D.-M. Zhu, and R.A. Miller, Effect of Sintering
on Mechanical and Physical Properties of Plasma-Sprayed
Thermal Barrier Coatings. 2004, NASA/TM-2004-212625:
USA.
[27] Zhu, D. and R.A. Miller, Sintering and creep behavior of plasma-sprayed zirconia- and hafnia-based thermal barrier coatings. Surface and Coatings Technology, 1998. 108–109: p. 114-120.
[28] Gusel, L. and M. Brezocnik, Modeling of impact toughness of cold formed material by genetic programming.
Computational Materials Science, 2006. 37(4): p. 476-482. [29] Chang, Y.S., K.S. Park, and B.Y. Kim, Nonlinear model
for ECG R-R interval variation using genetic programming approach. Future Gener. Comput. Syst., 2005. 21(7): p. 1117-1123.
[30] Brezocnik, M. and L. Gusel, Predicting stress distribution
in cold-formed material with genetic programming. The