Published online November 30, 2013 (http://www.sciencepublishinggroup.com/j/ijepe) doi: 10.11648/j.ijepe.20130206.11
Power flow analysis by Artificial Neural Network
Serhat Berat EFE, Mehmet CEBECİ
Department of Electrical Engineering, Fırat University, Elazığ, Turkey
Email address:
[email protected] (S. B. EFE), [email protected] (M. CEBECİ)
To cite this article:
Serhat Berat EFE, Mehmet CEBECİ. Power Flow Analysis by Artificial Neural Network. International Journal of Energy and Power Engineering. Vol. 2, No. 6, 2013, pp. 204-208. doi: 10.11648/j.ijepe.20130206.11
Abstract:
Computer based methods used to analysis the power systems are developed instead of the steady state of mathematical methods. By the development of computer technology, solution of the network problems gets easier. Increment of the necessity to electrical energy by the development of technology, whereas the increment rate of raw energy sources doesn’t enough, it have made it mandatory to use the energy sources efficiently. Interconnected networks formed by the connection between not only the domestic sources and customers, but also between the different countries for the optimization and for the efficient use of the sources. Electrical engineers faced by the planning and optimization problems of developing interconnected networks. By this way, the requirement of the use of intelligent systems and computer analysis of power systems has become inevitable. In this study, power flow analysis the of a power system that consist five busbars performed by designed neural network. Results are compared by the results that gained by the analysis with classic Gauss- Seidel method of the same system, then the success of the neural network is investigated.Keywords:
Power Flow Analysis, Artificial Neural Networks, Gauss-Seidel Method1. Introduction
Development and getting complication of electrical power systems cause the necessity of detailed studies on planning and operating sections. Studies on this area expose a concept called power flow. Power flow can be described as calculations on defining characteristic properties of steady state operating situation of energy transmission systems. Power flow analysis on a transmission system includes the calculations of power flow and voltages for specified node or busbar situations. These calculations are also necessary for both dynamic and steady state behavior of power systems [1]. The power flow algorithm used on balanced and three phase energy systems under steady state conditions, based on the following rules:
• Generators supply all loads and total power loss of power lines. They cannot exceed their nominal active and reactive power capacities.
• Voltage amplitudes of all busbars are about nominal voltage limits.
• Power lines and transformers cannot overload. In power flow analysis, calculations are made by characteristic values of various components such as busbars, generators, power lines and transformers on power system. [2, 3]
1.1. Describe of Power Flow Problem
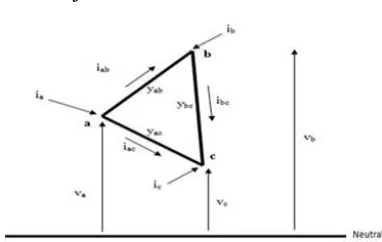
Figure 1. Single Phase Presentation of Three Node System
If k and j are described as any two nodes, vk is voltage
between node k and neutral; ykj is admittance between nodes
k and j; ikj is current flows from node k to node j and ik is
current flows to node k, then
a ab ac
i =i +i (1)
(
)
(
)
a a b ab a c ac
i
=
v
−
v y
+
v
−
v y
(2)(
)
a a ab ac b ab c ac
i
=
v y
+
y
−
v y
−
v y
(3)(
)
b a ba b ba bc c bc
i
= −
v y
+
v y
+
y
−
v y
(4)(
)
c a ca b cb c ca cb
i
= −
v y
−
v y
+
v y
+
y
(5)In these equations if
ab ac aa
ba bc bb
ca cb cc
y
y
y
y
y
y
y
y
y
+
=
+
=
+
=
(6)
then
a aa a ab b ac c
b ba a bb b bc c
c ca a cb b cc c
i
y v
y v
y v
i
y v
y v
y v
i
y v
y v
y v
=
−
−
= −
+
−
= −
−
+
(7)
The matrix form of these equations can be written as
a aa ab ac a
b ba bb bc b
c ca cb cc c
i
y
y
y
v
i
y
y
y
v
i
y
y
y
v
−
−
= −
−
−
−
or I = Y. V (8)
For n node system
1 11 1 12 2 13 3 1 2 21 1 22 2 23 3 2 3 31 1 32 2 33 3 3
1 1 2 2 3 3
...
...
...
.
.
.
...
n n n n n nn n n n nn n
I
Y V
Y V
Y V
Y V
I
Y V
Y V
Y V
Y V
I
Y V
Y V
Y V
Y V
I
Y V
Y V
Y V
Y V
=
+
+
+ +
=
+
+
+ +
=
+
+
+ +
=
+
+
+ +
(9)
For k.th node
1 1 2 2 3 3
...
k k k k kn n
I
=
Y V
+
Y V
+
Y V
+ +
Y V
or
1
n
k kj j j
I
Y V
=
=
∑
, k=1, 2, 3,...,n (10)In power flow calculations all voltages have to solve. However, currents can be described with complex power and voltage forms. So, for the node k
* * k k k
S
I
V
=
(13)The ‘*’ signed terms refer complex form.
If the busbar 1 selected as slack bus, the voltage calculation for this bus is not necessary, due to it has already described. So, the equation 10 can be written as
1
n
k kj j j
I
Y V
=
=
∑
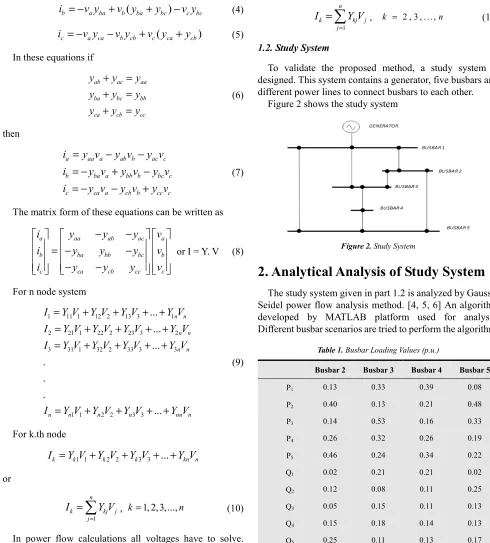
, k = 2 , 3 , . . . ,n (12)1.2. Study System
To validate the proposed method, a study system is designed. This system contains a generator, five busbars and different power lines to connect busbars to each other.
Figure 2 shows the study system
Figure 2. Study System
2. Analytical Analysis of Study System
The study system given in part 1.2 is analyzed by Gauss – Seidel power flow analysis method. [4, 5, 6] An algorithm developed by MATLAB platform used for analysis. Different busbar scenarios are tried to perform the algorithm.
Table 1. Busbar Loading Values (p.u.)
Busbar 2 Busbar 3 Busbar 4 Busbar 5
P1 0.13 0.33 0.39 0.08
P2 0.40 0.13 0.21 0.48
P3 0.14 0.53 0.16 0.33
P4 0.26 0.32 0.26 0.19
P5 0.46 0.24 0.34 0.22
Q1 0.02 0.21 0.21 0.02
Q2 0.12 0.08 0.11 0.25
Q3 0.05 0.15 0.11 0.13
Q4 0.15 0.18 0.14 0.13
Q5 0.25 0.11 0.13 0.17
Due to line parameters given in table 2, system admittance matrix can form as below:
10.958904 3.424658 3.424658 0 4.109589
25.997397 7.534247 7.534247 10.958904
3.424658 11.672080 4.123711 0 4.123711
7.534247 26.060948 9.278351 9.278351
3.424658 4.123711 10. 7.534247 9.278351
j j j j
j j j j
Y j j
− − −
− + + +
− − −
+ − + +
− −
= + + 23.119061475198 2.9268296.341463 0 2.926829 7.050541 4.123711
0 0 6.341463 15.594814 9.278351
4.109589 4.123711 0 4.123711 12.357012
10.958904 9.278351 9.278351 29.485605
j j
j j j
j j j j
The busbar loading values given in table 1 are used in algorithm. The algorithm produces voltage amplitudes and angles as given in table 3.
Table 2. Line Parameters
Source Busbar Target Busbar R (p.u.) X (p.u.) B (p.u.)
Busbar 1 Busbar 2 0.05 0.11 0.02
Busbar 1 Busbar 3 0.05 0.11 0.02
Busbar 1 Busbar 5 0.03 0.08 0.02
Busbar 2 Busbar 3 0.04 0.09 0.02
Busbar 2 Busbar 5 0.04 0.09 0.02
Busbar 3 Busbar 4 0.06 0.13 0.03
Busbar 4 Busbar 5 0.04 0.09 0.02
3. Artificial Neural Network Analysis of
Study System
Unlike the traditional calculation methods, Artificial Neural Network (ANN) learns the solution from a data set of training and offers an alternate calculation form. This idea inspired on biological neural system, especially from human brain. [7]
Human brain can be described as nonlinear and parallel knowledge processing system which has ability of learning, consolidation, adaptation and generalization skills.
ANN is a powerful tool for the simulation and prediction of nonlinear problems. A neural network comprises many highly interconnected processing units called neurons. Each neuron sums weighted inputs and then applies a linear or nonlinear function to the resulting sum to determine the output, and all of them are arranged in layers and combined through excessive connectivity. The typical ANN is a back propagation network (BPN) which has been widely used in many research fields. A BPN has hierarchical feed-forward network architecture, and the output of each layer is sent directly to each neuron in the layer above. Although a BPN can have many layers, all pattern recognition and classification tasks can be accomplished with a three-layer BPN. [10]
ANN gathers stores and generalizes information by learning sequence, like human brain. Learning sequence is consisting of learning algorithms which supplies to renew the weights of ANN to reach the target. Generalization is described as the respect of the ANN to unknown data that never seen in both learning and education sequences. ANN is in use at wide variety of applications by its advanced ability on solving complex problems. [8]
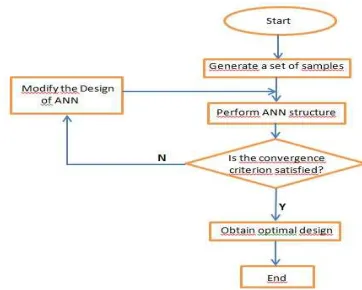
In most common form, basic ANN follows the flowchart given in figure 3 below.
Figure 4 shows the basic form of developed ANN for reference system.
Figure 4. Basic Form of ANN
Also figure 5 shows the internal structure of designed ANN under Simulink platform.
Figure 5. Internal Structure of ANN
Figure 6. ANN Training Process
one-row matrix form to obtain input parameters. System gives busbar voltages and voltage angels as output. Tansig and purelin functions are used as transfer functions cause of giving the most successful results among others. Tansig is used for hidden layer and purelin is used for output layer. The best result has been obtained by using trainbr as learning algorithm.
50 active power values and 50 reactive power values are
used to train the developed ANN. The output values of training are voltage magnitudes and angles which obtained from developed analytical algorithm. Training process ended after 373 iterations. Figure 6 shows training process.
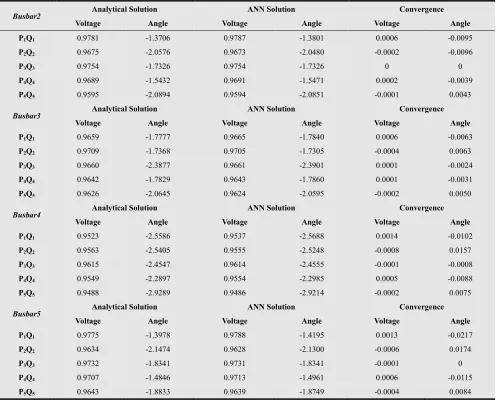
Both analytical and ANN analysis results are shown in table 3. that is given at the end of paper. The table also shows the convergence of analytical and ANN solution methods.
Table 3. Results
Busbar2 Analytical Solution ANN Solution Convergence
Voltage Angle Voltage Angle Voltage Angle
P1Q1 0.9781 -1.3706 0.9787 -1.3801 0.0006 -0.0095
P2Q2 0.9675 -2.0576 0.9673 -2.0480 -0.0002 -0.0096
P3Q3 0.9754 -1.7326 0.9754 -1.7326 0 0
P4Q4 0.9689 -1.5432 0.9691 -1.5471 0.0002 -0.0039
P5Q5 0.9595 -2.0894 0.9594 -2.0851 -0.0001 0.0043
Busbar3 Analytical Solution ANN Solution Convergence
Voltage Angle Voltage Angle Voltage Angle
P1Q1 0.9659 -1.7777 0.9665 -1.7840 0.0006 -0.0063
P2Q2 0.9709 -1.7368 0.9705 -1.7305 -0.0004 0.0063
P3Q3 0.9660 -2.3877 0.9661 -2.3901 0.0001 -0.0024
P4Q4 0.9642 -1.7829 0.9643 -1.7860 0.0001 -0.0031
P5Q5 0.9626 -2.0645 0.9624 -2.0595 -0.0002 0.0050
Busbar4 Analytical Solution ANN Solution Convergence
Voltage Angle Voltage Angle Voltage Angle
P1Q1 0.9523 -2.5586 0.9537 -2.5688 0.0014 -0.0102
P2Q2 0.9563 -2.5405 0.9555 -2.5248 -0.0008 0.0157
P3Q3 0.9615 -2.4547 0.9614 -2.4555 -0.0001 -0.0008
P4Q4 0.9549 -2.2897 0.9554 -2.2985 0.0005 -0.0088
P5Q5 0.9488 -2.9289 0.9486 -2.9214 -0.0002 0.0075
Busbar5 Analytical Solution ANN Solution Convergence
Voltage Angle Voltage Angle Voltage Angle
P1Q1 0.9775 -1.3978 0.9788 -1.4195 0.0013 -0.0217
P2Q2 0.9634 -2.1474 0.9628 -2.1300 -0.0006 0.0174
P3Q3 0.9732 -1.8341 0.9731 -1.8341 -0.0001 0
P4Q4 0.9707 -1.4846 0.9713 -1.4961 0.0006 -0.0115
P5Q5 0.9643 -1.8833 0.9639 -1.8749 -0.0004 0.0084
4. Conclusion
Main problem of power flow analysis is the necessity of processing too much parameter at same time because of the wide working area. This necessity forced engineers to develop modern methods such as artificial neural networks. In this paper, power flow analysis of five-busbar system is investigated. First, the analysis is performed by classic analytical method. Then a developed ANN is used to analysis the same system with same parameters. As the results given in table 3 are investigated, it can be seen that proposed method satisfies the convergence limits. The
compared results show that the ANN works properly and can be used in power flow analysis problems.
References
[1] S. Madan and K.E. Bollinger, “Neural Network Based Power Flow Predictor”, IEEE Canadian Conference on Electrical and Computer Engineering,1999, pp.1331-1334
[3] H.H. Müller and J.M. Rider, ”Power Flow Model Based on Artificial Neural Networks”, , IEEE Russia Powertech, 2005, pp.1-6
[4] L. Powell, Power System Load Flow Analysis, McGraw-Hill, 2004, USA.
[5] Y. Hase, Handbook of Power System Engineering, John Wiley and Sons, 2007, USA
[6] N. Kumar, R. Wangneo, P.K. Kalra and S.C. Srivastava, “Application Of Artificial Neural Networks To Load Flow Solutions,” IEEE Transactions on Power Systems, 1995, pp.199-203.
[7] W.S. McCulloch and W. Pitts, “A Logical Calculus of The Ideas Immanent in Nervous Activity”, Bull. Math. Biophys, 5, 1943, pp.115-133
[8] M. İnal and F. Aras, “Yalıtkan Malzemelerin Dielektrik Özelliklerinin Yapay Sinir Ağlarıyla Belirlenmesi”, Gazi Üniv. Müh. Mim. Fak. Der, Cilt 20, No 4, 2005, pp.455-462 [9] S.B. Efe, Güç Akışı Analizi Yöntemleri ve Uygulamaları,
PhD. Seminar, 2010,Fırat University, Elazig, Turkey [10] H.Shi, Y.Gao and X.Wang, “Optimization of injection