http://www.sciencepublishinggroup.com/j/earth doi: 10.11648/j.earth.s.2017060501.24
ISSN: 2328-5974 (Print); ISSN: 2328-5982 (Online)
Spatial Analysis Used in Baseline Study for the Preparation
of Management Plan of Kazbegi Protected Areas
Tamar Bakuradze
1, *, Andrei Kandaurov
2, *, Marine Mosulishvili
3, *, Dali Nikolaishvili
4, *,
Mamuka Gvilava
1, *, Sophiko Kenkebashvili
1, *1
GIS and Remote Sensing Consulting Center “GeoGraphic”, Tbilisi, Georgia 2Institute of Zoology, Ilia State University, Tbilisi, Georgia
3Institute of Botanic, Ilia State University, Tbilisi, Georgia
4
Faculty of Exact and Natural Sciences, Ivane Javakhishvili Tbilisi State University (TSU), Tbilisi, Georgia
Email address:
[email protected] (T. Bakuradze), [email protected] (A. Kandaurov),
[email protected] (M. Mosulishvili), [email protected] (D. Nikolaishvili), [email protected] (M. Gvilava), [email protected] (S. Kenkebashvili)
*Corresponding author
To cite this article:
Tamar Bakuradze, Andrei Kandaurov, Marine Mosulishvili, Dali Nikolaishvili, Mamuka Gvilava, Sophiko Kenkebashvili. Spatial Analysis Used in Baseline Study for the Preparation of Management Plan of Kazbegi Protected Areas. Earth Sciences. Special Issue: New Challenge for Geography: Landscape Dimensions of Sustainable Development. Vol. 6, No. 5-1, 2017, pp. 93-110.
doi: 10.11648/j.earth.s.2017060501.24
Received: August 4, 2017; Accepted: August 7, 2017; Published: August 23, 2017
Abstract:
Collected data were separated in three generalized subsystem: environment (its main elements: air, land and water) as an Abiotic subsystems; flora and fauna, as the elements of a Biotic subsystem and Cultural environment, as a third subsystem, with its historical-cultural heritage and existing infrastructure. Interpretation and evaluation of the data were made for each component (Abiotic, Biotic and Cultural) through the use of criteria of significance and description of constraints (limiting factors) which were elaborated under the project SPPA/CS/2015-5/RE1. In parallel with the studies, the structure of GIS geodatabase for the protected area was created, which consists of both base map features – GIS layers, and thematic part. The base map scale is 1:25k, the scale of thematic maps is 1:50k. Based on the study results, the recommendations were developed: on the issues of the protected area category relevance, internal zoning, use of natural resources, biodiversity protection and monitoring. These recommendations will assist in the management plan preparation process, in order to accurately define the objectives of protected area and to properly design the work of the management and staff of the protected area.Keywords:
Protected Areas, Functional-Territorial Planning of Protected Areas, Zoning, Zone, ABC Method, Abiotic, Biotic, Cultural Subsystems, Spatial Analysis, GIS Model1. Introduction
Under the framework of the “Support Programme for Protected Areas in the Caucasus – Georgia” (BMZ-N 2008.6582.4) with “GFA Consulting Group” representation in Georgia and Legal Entity of Public Law (LEPL) Agency of Protected Areas (APA) under the Ministry of Environment and Natural Resources Protection of Georgia was implemented “Baseline Studies on Four – Algeti, Kazbegi, Kintrishi and Pshav-Khevsureti Protected Areas” project
(SPPA/CS/2015-5/RE1). The study was implemented by GIS and Remote Sensing Consulting Center “Geographic”.
The objective of the overall project was to increase the efficiency of the management of four selected Protected Areas (PAs) and to improve the social-economic conditions of the adjacent local communities.
biodiversity protection and monitoring, which at the same time will assist the management plan preparation process, in order to accurately define the objectives and to properly design the work of the management and staff of the protected area.
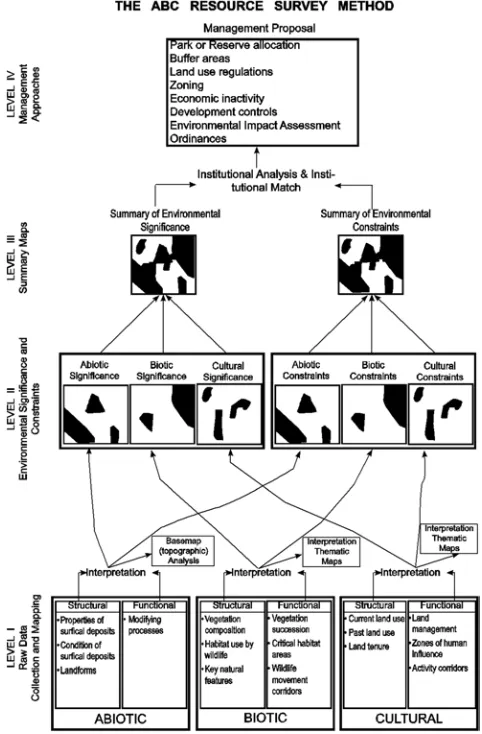
Baseline studies were carried out using the ABC (Abiotic-Biotic-Cultural) method of resource study [Bastedo, J. D. et al. 1984] (see figure 1.), which is based on the Geographic Information System (GIS) spatial modelling, and interpretation and visualization of the results obtained. Within the study, the most significant areas were identified in results of the spatial analysis of the Abiotic, Biotic and Cultural subsystems elements. Hereafter, the results of the analysis were reflected in the determination of the territorial-functional zones of the protected area. In compliance with the Law “On the System of the Protected Areas” (March 7, 1996, №136-IIs), the various zones were delineated. Among them, the Core Zone, the “strict protected zone”, is the most important in terms of conservation, where species and habitats of high conservation value will be protected, due to ensuring the limited impact of the resources used within the zone and on adjacent territories.
The following actions were performed:
1.Description of the site & generalized system based on the collected data; selection of criteria for each subsystem (Abiotic, Biotic, Cultural), identification of the target-species and significant sites;
2.Data interpretation, assessment & analysis using the GIS spatial analysis tool to derive the new knowledge based data;
3.Recommendations developed.
This article is demonstrating the methodology elaborated within the project and shows the results of the analysis done for the Kazbegi Protected Areas – one of the four selected PAs.
The Kazbegi Protected Areas are located on the northern slopes of the Greater Caucasus Mountain Chain on altitudes above 1400 m asl. Initially, the Kazbegi State Reserve was established as a protected area which consisted of 105 scattered land plots of different size. Generally, the reserve had to protect the remains of the mountain forest on the Central of Greater Caucasus. The PAs covered area of more than 9000 ha, 65% of which are subalpine, alpine meadows and rocks.
In 2012, the Georgian government decided to enlarge the Kazbegi PAs and combine small plots in a few large parts.
The proposed methodology can be used in case of a deficit of accurate data on species ranges of distribution within the PAs.
2. Methods and Initial Data
The result of the baseline studies considerably depends on the existence of accurate qualitative data. The recommendations for the PAs management plan, which will be prepared in the future by responsible authorities, were elaborated on the basis of interpretation and analysis of these
data at the final stage of the work.
All obtained data were separated into three generalized subsystems: environment (its main elements: air, land and waters) as an Abiotic subsystem; flora and fauna, as the elements of a Biotic subsystem and Cultural environment, as a third man-made subsystem, with its historical-cultural heritage and existing infrastructure. Interpretation and evaluation of the data were made for each component (Abiotic, Biotic and Cultural) through the use of criteria of significance and description of constraints (limiting factors) which were elaborated during the work on the project.
Figure 1. The abiotic-biotic-cultural strategy. [Redrawn from Bastedo, ABC Resource Survey Method for Environmentally Significant Areas, by M. Rapelji, 2000].
The requirements for data collection were structured in the same way. They included the following:
1.Abiotic subsystem
aPhysical features of territory: terrain surface (relief), geology and, hydrology;
bPhysical processes: e.g. erosion in Geomorphology; cNatural hazards: Landslides, mudflows, floods, erosion,
earthquakes, forest fires etc.
Distinguished physical features and processes were characterized and mapped.
layers were formed: from the Digital Elevation Model (DEM) were built the layers of hillshade relief, slope inclination (both in degrees and percent) and aspects-exposition of slopes. Also by a hydrological model (ArcSWAT, ArcHydro) were outlined the river basins.
2.Biotic subsystem
a. The following biological features were characterized: landscapes (in terms of geography) and vegetation cover, flora and fauna of the PAs territory - habitats, species, their populations and important communities, etc. The importance of the species was characterized according to the international, regional and national Red Data Lists, such as Red Data List of Georgia, IUCN Red Data List, Annexes of the Bern Convention of the Species and Habitats, and other international agreements signed by Georgia, and having regard to their scientific/educational and touristic values.
b. Biological processes: succession, important habitat functions (presence of places of breeding, of feeding areas and migration routes).
Habitat description was done according to “Habitats of Georgia” [Akhalkatsi M., Tarkhnishvili D., 2012]. However, this publication not presents maps of habitats. Therefore only issue to delineate the borders of the different habitats plots within the Kazbegi PAs was the Landscape map of the Caucasus [Beruchashvili N. L., 1983]. A layer of the selected sites of the “Emerald Network” (a network analogous to “Natura 2000” for EU non-member countries) was used, too.
The general principle of selection of the target-species for the analysis is that each species discussed has a strong argument for being put in the list of target-species. Target-species of the protected area are considered those Target-species, which depend on the resources of the protected area or are a part of the population, which from the viewpoint of survival is of great importance for entire Georgia and thus should be survived on this protected area as well, or a major part of the population spread in Georgia is within this protected area.
3.Cultural subsystem
a.Historical cultural heritage: historical places, monuments and objects of the historical-cultural heritage with cultural/religious monuments and touristic value within the Protected Area and in the surrounding territory;
b.The existing man-made infrastructure objects such as roads, settlements, transport system, communication, recreational facilities, land use and land tenure, and other, were expressed in the form of the map layers; c.Land use: forestry, agriculture (pastries, meadows), the
traditional use of traditional farms and resources from the historical aspect, hunting, fishing, harvesting of wild fruits etc.
Main sources of data for baseline study were: 1.Studies reports obtained by GFA, APA 2.Scientific literature
3.Different thematic maps, orthophotos, satellite images 4.Handbooks, guides and archive materials
5.Statistical data
6.Strategic Development Plans on Regional and
Municipal levels
Data were stored in a GIS format and were presented on a base map with various thematic maps, representing the various attributes that characterize the Abiotic (A), Biotic (B), Cultural and Social (C) components of the environmental system. The base map scale is 1:25k, the scale of thematic maps is 1:50k.
The criteria of the significance and constraints were determined within the project for Abiotic, Biotic and Cultural subsystems’ components. According to the methodology, on the first stage of work, the data of features and processes
were collected for each subsystem. The
refinement/improvement of the data was done on stage II, and their structural and functional features were divided into the elements of significance of the territorial units (e.g. ecologically sensitive areas) and into the constraints, which are discussed as limitations factors for the territorial units to satisfy the requirements of the ecologically sensitive territory. On the third stage of work, the interpretation of the data was done, base on the experts’ knowledge, because the actual data of monitoring do not exist. The existing data are rather qualitative than quantitative, though results of some studies conducted in the recent past were used. For the evaluation, where it was possible to unite both approaches, these data were correlated.
The presentation in a coherent framework transformed the data into information, useful for management. Completion of the above three steps provided information “fit for use”.
General methodological approaches - For the A, B, C subsystems were identified the significant sites. For Abiotic subsystem were selected the rare formations and terrain forms, the target-species (flora & fauna) for Biotic subsystem and significant cultural objects for the Cultural subsystem. Identification of the significant sites of Abiotic and Cultural subsystem was conducted by marking the location on the base map.
For the Biotic subsystem, data interpretation was based mainly on expert knowledge, because the comprehensive data on distribution within the protected area of the plant and animal species (including the species protected by law) does not exist. Data on the population numbers do not exist as well or are very outdated. It should also be mentioned that the population censuses of the animals were not requested within this study. However, results of some of the recent surveys were used (GPS points of recorded animals were kindly provided by Dr Al. Gavashelishvili, Dr Al. Abuladze, Dr Al. Bukhnikashvili via personal communications and publications indicated in the sources; “On wildlife objects accounting/study”, 2012 – Ilia State University, Institute of Ecology).
Layers of the thematic maps of potential distribution ranges for the selected target-species of the protected area were prepared as result of the data interpretation. It is important to note that these estimates could be strengthened by the monitoring and research results, conducted in this area.
species to the landscape cover of the studied area is an only opportunity to estimate a probability of the presence of the target-species on the study area. The species distribution ranges were target-species determined through evaluation of features of the territory within the protected area (food supplies of the habitats, proximity to man’s place of residence and to water sources, and existing shelters, etc.). The constraints were considered as those features that are restricting the use of the territory by the species. Evaluation of probability of species existence on the territory and expected size of the population is based on known demands of species, according to the space of their residence and resources they need, as well as on the altitude above the sea level, and geomorphology of the terrain (slopes exposure and steepness, slide rocks, and taluses, etc.).
Creation of the individual layers of the species was based on the critically needed available data processing (generation of the new data from the existing data). The maps of the fauna and flora target-species distribution ranges were derived by use of different tools and methods of spatial analysis and overlapping of various map layers, which involved the following: landscape map, land cover and land ownership, infrastructure facilities, the slope inclination and exposure, watersheds map, digital elevation model (DEM), etc. Such method can be called as the “the method of simple matrices” according to L. Canter (1996).
2.1. Data Storage and Documentation
All the obtained or generated data are collected and stored in GIS geodatabases (*.gdb format), according to the developed structure, which consists of both base map datasets and thematic layers. Data are collected in the three geodatabases (see Figure 2), where there are two vector datasets (KazbegiPA.gdb, KazbegiPA_25000.gd b) and one raster (KazbegiRASTER.gdb). KazbegiPA.gdb geodatabase consists of 6 feature datasets: A_Abiotic, B_Biotic, C_Cultural components thematic maps layers, which are the based on the 1:50k scale; Boundary layers are placed in the 01_Boundary feature dataset, 50k base topographic map layers are placed in the 02_BaseMap feature dataset, while the results obtained by the spatial analysis are in the 03_Analysis feature dataset (see Figure 3).
Data collection was carried out in several stages: the identification of the available data sources, the contacting with the relevant institutions and the requesting the data. During the study, it was found out that spatial data are scarce, and if any, they often fail to meet the requirements (reliability, source, scale, accuracy, etc.). In many cases, the
data do not have metadata. Determination of the scale is the important issue as well. The scale of the data obtained from different sources often varies. That should be taken into account during the data interpretation. At the same time, it is important to take into account the credibility of the data source.
Figure 2. Gathered data in 3 geodatabases.
Figure 3. KazbegiPA.gdb consists specific 6 feature datasets.
Data from the global sources were used in the study as well, e.g. the World land cover data – the 30-meter resolution
raster image from the MDA BaseVUE 2013
(http://doc.arcgis.com/en/living-atlas/item/?itemId=1f4672830e414a75916ff0b701bf9283).
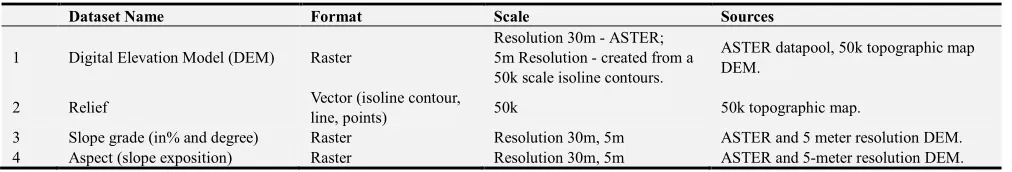
Table 1. The data used to generate Abiotic, Biotic & Cultural subsystem layers.
Dataset Name Format Scale Sources
1 Digital Elevation Model (DEM) Raster
Resolution 30m - ASTER; 5m Resolution - created from a 50k scale isoline contours.
ASTER datapool, 50k topographic map DEM.
2 Relief Vector (isoline contour,
line, points) 50k 50k topographic map.
3 Slope grade (in% and degree) Raster Resolution 30m, 5m ASTER and 5 meter resolution DEM.
Dataset Name Format Scale Sources
5 Rivers and streams Vector (line, polygon) 25k, 50k 25k, 50k topographic maps.
6 Watersheds and its subbasins Vector Accuracy of 5m resolution
DEM
Extracted from the ArcHydro model on the base on 5m resolution DEM.
7 Settlements Vector, Raster 25k, 50k
Derived from the 25k, 50k topographic maps as a polygon and a point features. Derived settlement polygon from the Landcover layer as well.
8 Landscape map Vector (polygon) 200k Landscape map of Georgia on the level of
genus, created by Prof. N. Beruchashvili.
9 Landcover map Raster Resolution 30m World Land Cover: MDA BaseVue 2013,
30-meter resolution, with 13 classes
10 Landcover map Vector 25k Digitalise the 25k topographic maps
11 Roads and other infrastructure
linear objects Vector 25k, 50k Based on the 25k, 50k topographic maps.
12 Soil map Vector 200k Soil map for Georgia - created within the
kfw Cadaster Project in 2002.
The data are presented as base map and different thematic maps created on the basis thereof. Individual layers created for each theme are also represented various attributes, that characterize the Abiotic, Biotic, Cultural and Social components of the environmental system.
3. Research Object
The research object of this paper is a GIS analysis as a process of modeling spatially of the values of the territorial units of the PA. The paper shows the results of the analysis done for the Kazbegi Protected Areas. There is a lack of knowledge of a spatial spreading of the most important vital processes and the absence of the accurate and detailed data on the distribution ranges of target-species and other features within the borders of the planned protected area.
The proposed methodology can be used in case of the deficit of accurate data on species ranges of distribution
within the PAs.
4. Main Results
4.1. GIS Data Modeling Spatially
The number of models is developed to find as much as possible accurate shapes of territories which can be considered as sites important to fulfil functions of the PAs. Process includes a large set of ArcGIS modeling functions that produce analytical results.
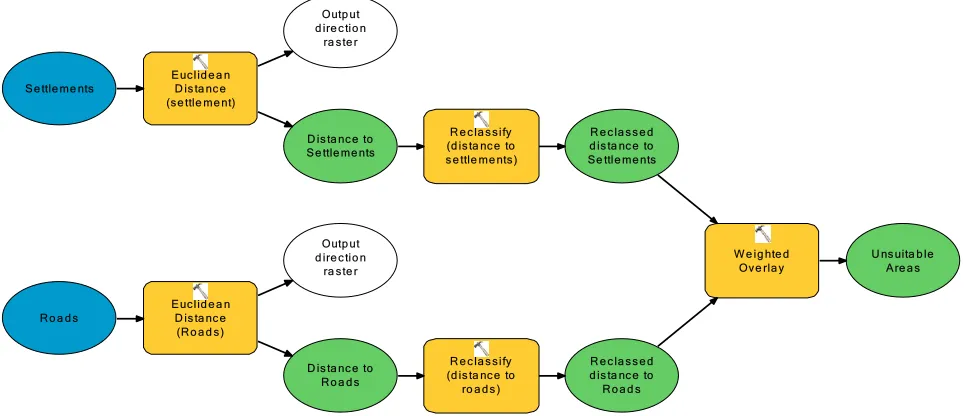
First of all, the areas, containing the constraints, should be excluded from the evaluations, because the constraints are preventing the occurrence of the target-species on them. As most evident constraint the distance from the residential areas and roads (different for different target-species) was used, and the data processing model was developed (See Figure 4).
Figure 4. Model of constraints for Biotic Subsystem based on Cultural features (different distance for different target species).
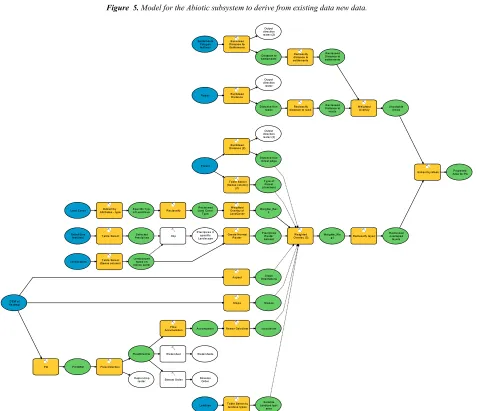
Also, the data processing model was developed for the abiotic subsystem, along with the hydrological model using - ArcHydro tools, from which has been received the outputs:
watersheds, rivers streams by the stream order of tributaries and other hydrological characteristics. At the same time, from this model has been derived new layers regarding the
R o a d s S e ttle me nts
E uc lid e a n D is ta nc e (R o a d s )
D is ta nc e to R o a d s Outp ut d ire c tio n
ra s te r E uc lid e a n
D is ta nc e (s e ttle me nt)
D is ta nc e to S e ttle me nts Outp ut d ire c tio n
ra s te r
R e c la s s ify (d is ta nc e to s e ttle me nts )
R e c la s s e d d is ta nc e to Se ttle me nts
R e c la s s ify (d is ta nc e to ro a d s )
R e c la s s e d d is ta nc e to R o a d s
W e ig hte d Ov e rla y
characteristics of relief as a results by model processing (See Figure 5).
Layers of thematic maps for the target-species potential spreading areas were prepared during data interpretation. Potential spreading area which offers main conditions necessary for particular species, that is a territory where target species is likely to be encountered (during breeding, foraging, or migration). Such territory is not entirely critical
for the preservation of a species on the territory of the PA. However, it should be sufficiently large, especially in case of large mammals (bear, lynx and chamois in this instance). The known places of the species distribution are presented as the separate map layers (See Figure 6 and Figure 14 below). After derived results by computer processing, these model results was examined and interpreted.
Figure 5. Model for the Abiotic subsystem to derive from existing data new data.
Figure 6. Model of significance for Biotic Subsystem.
D EM Ka zb e g i
As p e c t Orie nta tio no f Slo p e s
Fill Fill D EM Slo p e S lo p e inD e g re e
H ills ha d e S ha d e dR e lie f
R e c la s sify Slo p e s o rie nta tio n
R e c la s s e d As p e c t
R e c la s sify Slo p e s
R e c la s s e d S lo p e
Flo w D ire ctio n
F lo w D ire ctio n o f
s tre a m s Outp ut d ro p
ra s te r
W e ig hte d
Ov e rla y Suita b le Are a s
Flo w Ac c umula tio n
Flo w Ac c um ula tio n
A re a s
R a s te r Ca lc ula to r
Lo g o f Flo w D ire ctio n
R a ste r Ca lcula to r o f Lo g o f Flo w
D ire c tio n
Flo w a c c um ula tio n
Co nd itio n
R o a d s E uc li d e a nD i s ta nc e
D is ta nc e fro m ro a d s Outp ut d i re c ti o n ra s te r
R e c l a s s i fy d i s ta nc e to ra o d s
R e c l a s s e d D i s ta nc e to ro a d s
T a b le Se le c t Pre c ip i c e sS e l e c te d
Se ttle m e nts P o l y g o n fe a ture s
E uc li d e a n D is ta nc e fo r Se ttle m e nts
D is ta nc e to s e ttl e m e nts Outp ut d i re c ti o n ra s te r (2)
R e c l a s s i fy d is ta nc e to s e ttle m e nts
R e c l a s s e d D i s ta nc e to s e ttl e me nts
La nd s c a p e s
D EM o f Ka zb e g i
F o re s t
W e ig hte d Ov e rla y
U ns ui ta b le Are a s
T a b le Se le c t (Ge nus c o l umn)
La nd s c a p e s ty p e s o n Ge nus Le v e l R e l ie f (l ine
fe a ture s ) Cli p
P re c i p ic e s i n s p e c i fi c La nd s c a p e
Cre a te N o rma l R a s te r
Pre c i p i c e s R a s te r d a ta s e t La nd Co v e r E xtra c t b y
Attri b ute s - ty p e S p e c i fi c T y p e o f La nd Co v e r R e c l a s s ify
R e c la s s e d La nd Co v e r T y p e
W e i g hte d Ov e rla y o f La nd Co v e r
W e ig hte _R e c l 2
A s p e c t Sl o p e Orie nta tio ns
S lo p e S lo p e s
Fi ll F il l D EM
E uc li d e a n D is ta nc e (2)
D is ta nc e fro m fo re s t e d g e Outp ut d i re c ti o n ra s te r (3)
T a b le S e l e c t (Ge nus c o l umn) (2)
T y p e o f Fo re s t (d o mi na n t
F l o w D i re c tio n F l o wD i re c ti o n
Outp ut d ro p
ra s te r Stre a m Ord e r Stre a m s Ord e r W a te rs he d W a te rs he d s
Fl o w
Ac c um ul a tio n Ac c um ula ti o n R a s te r Ca lc ul a to r c a l c ula ti o n
La nd us e
W e ig hte d Ov e rla y (2)
W e i g hte _W e i g 1
T a b l e Se l e c t b y l a nd us e ty p e s
Sui ta b le La nd us e ty p e
a re a
R e c l a s s ify l a y e rs R e c l a s s e d o v e rla p e d la y e rs
4.2. Results and Their Interpretation
Areas of significance for Abiotic subsystem
Data interpretation and evaluation was carried out for each subsystem in the same way – using elaborated criteria of significance and constraints. The goal was to integrate different environmental values in analysis coherently. Identification of the areas of significance from the abiotic
point of view was made on the topographic map of 1:25k of scale (further – a base map). The abiotic criteria, such as rare geological formations and terrain forms, glaciers, places with attractive scenery were taking into account. There are many such places in Kazbegi Municipality, thus the Figure 7 shows only distinctive places from the abiotic point of view, evaluated by the developed criteria.
Figure 7. Areas of significance for the Abiotic subsystem.
Areas of significance for Biotic subsystem Places Significant from the Animals Point of View
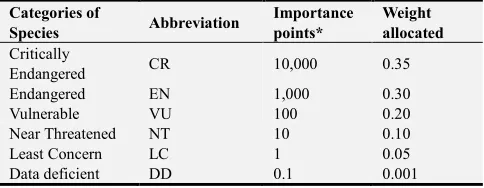
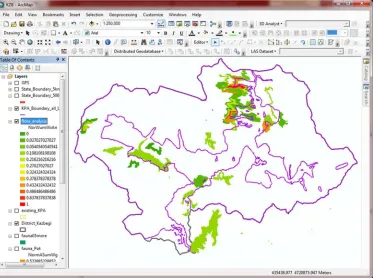
The areas significant from the standpoint of the animals protecting were derived using the Spatial Analysis tools of ArcGIS and the overlapping of the layers that are presenting the distribution ranges of the different target-species within the PAs (See Figure 8). The colours, shown on the Figure 8 depict quantitative results of the ranking. The sites of the high significance are represented in the red colour; the sites of a low significance - in the green colour. These values are received taking into account the “Importance points”* assigned to the IUCN Red List Categories of the species and the number of the target-species on the site (see Table 2). The results were normalized indicating the significance of the territory by the received a value range of 0 to 1 (See Figure 9).
Table 2. Weight allocation and aggregation.
Categories of
Species Abbreviation
Importance points*
Weight allocated
Critically
Endangered CR 10,000 0.35
Endangered EN 1,000 0.30
Vulnerable VU 100 0.20
Near Threatened NT 10 0.10
Least Concern LC 1 0.05
Data deficient DD 0.1 0.001
* “Importance points” indicates the value assigned to the IUCN’s category.
obtained maximum value and the minimum value (so called Min-Max normalization).
, …
Where:
Xi - data of the point i
XMin - The minima among all the data points XMax - The maxima among all the data points
Xi, 0 to 1 - The data of the point i normalized between 0 and 1.
The “Importance points” are assigned to the target-species (See Table 2) to find out the areas where the species belonging to the highest IUCN Red List categories are occurring. The “Importance points” are multiplied on 10 for each step to the higher category. The map on the Figure 9 is
presenting the areas containing habitats suitable for the species belonging to high categories of the IUCN Red Data List and depicts how many species of highest categories could be found on each plot of land. It is also possible to find out the sites where species belonging to higher categories are absent. They are marked by green colour on the map (See Figure 9 and Table 2).
The advantage of using this method is that at any place it is known - how many target-species and of which categories can be found there. target-species In the study area we have a minimum and maximum amount of the Importance points, 1 and 12500 respectively, which means that we have places, where only one target-species of the category “Least Concern” is presented, and the places where one “Critically Endangered”, two “Endangered” and five “Vulnerable” target-species are presented.
Figure 8. The Significance of the territory for the target-species weights normalized (from 0 to 1).
The data on the potential distribution ranges of the target-species were graded from 0 to 1. The territories that were rated higher than 0.5 are considered as the territories of high significance (See Figure 10).
The known places of the occurring of some of the target-species have been used as well (the results of various
research and GPS points seeing). Integration of the obtained results with the data on the known finding places of the faunal target-species allows determination of the most significant areas for their protection (potential Core Zone), see Figure 11.
Figure 10. The territories of high significance (> 0.5 rate).
Figure 12. Significant areas for mammals (black cross-hatching) and known GPS points of their seeing.
Figure 14. Areas containing constraints for faunal component of the Biotic subsystem.
The obtained results clearly are shown that significant areas from the standpoint of fauna protection are located within the planned Kazbegi PAs and a small part outside of it. In particular, significant places are as follows: the northern slopes of the Greater Caucasus ridge, the Truso Valley, with Suatisi and Mna Gorges, the river White Aragvi river head, and fragments in the Sno River Valley. Due to relatively
scarce information about Khde Valley, this place was not included in the significant areas from standpoint of fauna protection. In the Truso and Sno valleys, there are the significant areas, which are located outside the planned Kazbegi PAs.
In results of the field visits and evaluation of these sites, they were estimated as the areas significant to the biodiversity conservation. However, taking into account that most of the villages in the Truso Valley are abandoned and only a few people are still living there, it is recommended to include these parts of the Truso and Sno Gorges in the Protected Landscape of the support zone of the planned Kazbegi PAs (the 5th category of protected areas according to IUCN).
Places Significant from the Floristic Point of View
In addition to the animal target-species study, the similar spatial analysis was conducted for the significant floristic species. The ranges of distribution of the selected plant target-species were identified and represented as the separate map’s layers. The places significant from the standpoint of plants conservation were derived using the overlaps of these layers (See Figure 15).
Figure 15. The places significant from the standpoint of plants conservation.
In addition to these places, the Emerald Network sites were analyzed. They were considered as the significant places, which have to be protected together with the sites important to the flora target-species (See Figure 16). However, it should be noted that the sites of the Emerald Network are situated within the area of the former Kazbegi State Reserve. The majority of these places is the small forest
Figure 16. Significant places from the standpoint of the plants’ conservation with the overlap of the Emerald Network sites.
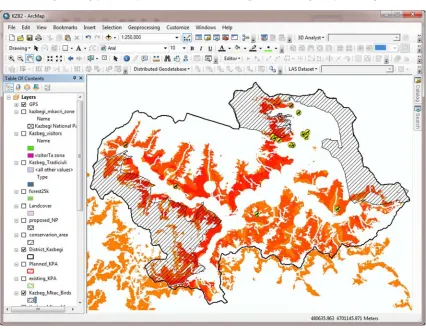
On the next step, the places that meet the Core Zone criteria for Biotic subsystem were determined via the combination of the resulting map layers, which contain the significant places from the standpoint of the plants’
conservation with the overlap of the Emerald Network sites and the significant areas from the standpoint of the animal target-species protection. (See Figure 17).
The above-depicted areas, which can be used as a basis for the allocation of the Core Zone, shall be adjusted. The areas that are loaded by any human activity (e.g. haylands and pastures) should be excluded (Cultural subsystem). However, it is impossible to display such areas on the map whereas, there are not pastures and haylands registered in the National Agency of Public Registry (NAPR) on this territory. For
these purposes, the layer containing the sub-alpine and alpine meadows was derived based on the topographic map of 1:25k of scale and land cover layer from the global sources - World land cover data – MDA BaseVUE 2013. The estimated pastures and haylands areas, derived from the land cover map, are represented in yellow colour on the Figure 18.
Figure 18. Map of the estimated pastures and haylands.
Borders of the areas, that should be protected, were received by the overlap of the layers containing the sites
significant for Abiotic and Biotic subsystems. (see Figure 19).
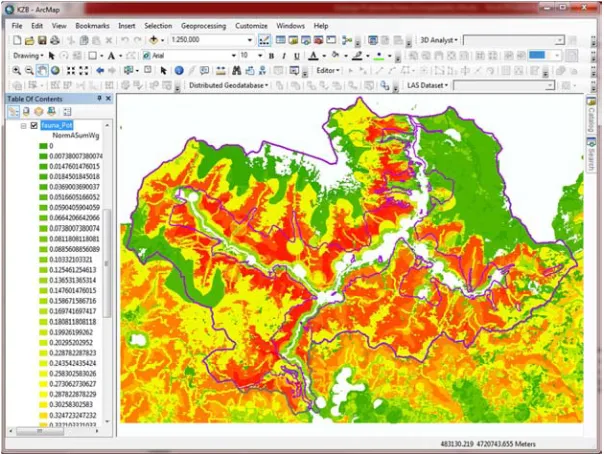
As for the Cultural subsystem, the components of this subsystem takes part in the analysis as a constraint factor. These include: the existing roads, settlements – villages, agricultural lands and pasture and hayland areas, cultural heritage monuments and objects, planned and the existing tourist routes, planned infrastructural construction objects,
the layers of which were created and they were integrated in order to exclude these areas from the territories, over which the Core Zone can be organized. Also, by analyzing of these layers the visitors’ zone was determined, which is based on the location of objects of cultural heritage, tourist routes and existing roads and paths (see Figure 20).
Figure 20. The “areas to be protected overlapped by the layers of settlements, cultural heritage monuments and objects, tourist routes and roads (existing and planned).
5. Conclusions
Recommendations regarding zoning - Protected areas should be managed to protect biological diversity at two levels: ecosystem and species levels. The ecosystem level involves protecting unique ecosystems, representative areas for each main type of ecosystem in a nation or region, and species-rich ecosystems and centers of endemic species. The species level is giving priority to the genetically most distinct species (e.g., families with few species or genera with only one species), and to culturally important species and endemic genera and species. The proposed zoning is based on the ecosystem and species level.
Zoning is usually a management tool within a single protected area. Management includes spatial planning, based on the knowledge of the distribution of the environmental functions within the spatial-territorial units using the zoning tool. Conservation management includes actions to achieve security and protection of the essential values of the spatial-territorial unit.
The proposed spatial planning and zoning of the protected area is based on the environmental values. Management zones are identified, and activities within these zones should be planned in accordance with the objectives of the PA as defined in the strategy document. Certain zones may require intensive management while others may require very little.
For preservation/improvement of the natural state of the environment and maximum conservation of the ecological functions of the territory based on natural values and agricultural use and level of economic development, the territory of the Kazbegi Municipality is divided into the gradational categories of nature protection.
Recommended Protected Areas Categories
1. The proposed Kazbegi National Park (II Category) with the total area of 79.262 ha. The total area of the PA is calculated according to Kazbegi National Park (existing and planned national park areas were combined, and the identified conflicting sites - corrected). The shapefile received as a result of analyses of boundaries using software ArcMap area calculation instruments. On the territory of the Kazbegi National Park the following zones are delineated:
a.strict protection zone (core zone) - 35,745.5 ha; b.regulated protection zone - 15,013.1 ha c.visitors’ zone - 9,203 ha;
d.administrative zone - 0.4 ha; e.traditional use zone - 19,300 ha. 2. Natural Monuments (III category);
a.Truso Travertine Natural Monument - 4.2 ha b.Abano Mineral Lake Natural Monument - 0.04 ha c.Keterisi Mineral Vaucluse Natural Monument - 1 ha d.Sakhizari Rock Natural Monument - 335.7 ha e.Jvari Pass Travertine Natural Monument - 2.7 ha 3. Protected Landscape (V Category) in Truso and Sno Gorges - 11,200.6 ha (Truso - 6,818.1 ha and Sno - 4,382.5 ha) which is suggested in the context of future discussions with the local population and stakeholders on the possible
expansion of the protected territories in Kazbegi municipality during the process of management plan development.
Proposed Kazbegi National Park will include the combined territories of the existing and planned Kazbegi National Park areas that are adjusted according to real situational analysis. The recommended boundary for the Kazbegi National Park is suggested considering the changes proposed in the result of the survey.
Natural Monuments remain in the unchanged boundaries and categories as presented in law on the Status of Protected Areas (November 22, 2007, №5486-II).
In future Truso and Sno Gorges should be assigned Protected Landscapes’ statuses where the following villages are located - Truso Gorge: Resi, Tephi, Jimara, Tsotsolta, Burmasighi, Qaratqau, Suatisi, Zakagori, Desi, Abano, Keterisi, Mna, lower and upper Okrokana, Shevardeni; villages in Sno Gorge: Sno, Akhaltsikhe, Koseli, Karkucha, Artkhmo, Juta.
Important historical and cultural monuments and the villagers' agricultural activity areas (meadows, pastures) are not included in the planned territory of the Kazbegi National Park.
Kazbegi National Park
Based on the results of discussions and the study, the strictly protected zone is significantly expanded in comparison to the existing one (See Figure 21), and that needs to be discussed with stakeholders.
a) The strict protection zone (core zone) justification After the planned expansion of Kazbegi National Park small areas of the existing zoning - "Traditional Use" and "Visitor" zones -will be included within the new territory of the National Park. The National Park zoning system and usage of National Park territory should be organized in compliance with the Law:
a The territories, outside the existing Kazbegi National Park that are used by the local residents, should be defined precisely (especially for the recommended Protected Landscape territories).
b According to existing zoning of Kazbegi National Park Traditional Use Zone is characterized by small fragmented land plots. It is necessary to determine the minimal size of the areas of the Traditional Use zone within the National Park area and provide locals with access-roads to these areas. These access-roads should not be situated within the boundaries of the National Park. Attractive sites within the National Park and access-roads to these places should be identified. c The rest of the territory may be defined as a National
Park Core Zone – Strictly protected zone. Important areas for preservation of biodiversity of Caucasus Mountains are shown on the map in red slashes, less important areas are given in green horizontal lines. Visitor Zone can be expanded to these less important areas; particularly the routes for the bird watchers and alpinists to mountain peak Mkinvartsveri.
1.River Tergi left bank of the Dariali Gorge – from the North of Abano glacier to the State border (within the National Park boundaries);
2.River Tergi right bank in Truso Gorge, the entire northern macroslope of the Main Caucasus Mountains Ridge within the National Park boundaries (to the South Ossetia/Samachablo border);
3.The mountains between River Khdistskali and the State border, which runs along the Okhkuri ridge, to the conventional line connecting the mountain Shani and mountain Kuro, following the entire valley of river Khdistskali to the Kibishi glacier and from this glacier to the northern bank of river Juta.
Division of those three areas into the “Visitor” and “Traditional Use” zones are extremely undesirable: the routes of the seasonal movement of ungulate are passing here. The East Caucasian Tur (Capra cylinricornis) moves in areas 1 and 3 and Northern Chamois (Rupicapra rupicapra) in the area 2. The gene drift which occurs here provides sustainability of these populations in the Caucasus. Here are nesting areas for a variety of the bird target-species.
The major part of the Dinnick's viper (Vipera dinniki) habitat is located westward – from the river Baydara it extends to the North-East of river Snostskali. This place is also important for Northern Chamois.
Perhaps, it might be possible to use these territories for the
economic activities, but in this part, we talk about their importance in terms of preserving biodiversity (not only in Georgia but throughout the Caucasus). Protection of biodiversity is one of the goals of establishing the National Park. For the survival of populations of large mammals, it is critical to maintaining the possibility of gene drift.
Strict Protection Zone is a high conservation value area, which at the same time are vulnerable to disturbance and can tolerate only a minimum of human use. Based on the survey potentially significant areas for the target-species are identified. The "Core Zone" management should be performed with a high level of protection. No disturbing uses should be allowed. The first step in designing a protected area would normally be to delineate the “Core zones”. The sizes of these zones can be most important in determining their usefulness as sanctuaries. Small areas of habitat generally have fewer species than larger ones. It is essential to delimit an area large enough to sustain a breeding population of the key species and to support their key habitats.
This is justified by conservation objectives as well as by providing endangered species the desired environment (sustainability of propagation and habitat of the species is vital to ensure the increase in population).
The proposed Strict protection Zone includes the area common for all target-species of flora and fauna.
Protected Landscape – in the context of the expansion of the Kazbegi Protected Areas on the area directly bordering the proposed Kazbegi National Park Core Zone. In this category, the low-impact activities are allowed.
According to the Law of Georgia on “System of Protected Areas” (N136-II's, 07/03/1996 Article 8) - (1) The Protected Landscape can be established to protect the natural landscapes having the high aesthetic value and national importance as well as natural-cultural landscapes formed as a result of harmonious interactions between the nature and humans, preserving the habitat, recreation-tourism and traditional economic activities; And (2) protected landscape requires wide territory of national importance and (or) the aquatic area, where the original natural and cultural landscapes are of high historical and aesthetic values.
Truso and Sno Gorges protected landscape goals could be the following:
(1) Truso and Sno Gorge protected landscapes are established for protecting the natural landscapes having the high aesthetic value and national importance as well as natural-cultural landscapes formed as a result of harmonious interactions between nature and humans, preserving the habitat, recreation-tourism and traditional economic activities.
(2) The goals for creation of Truso and Sno Gorges protected landscape are: (a) protection of the unique ecosystems, the individual components from the degradation-extinction due to anthropogenic impact; (b) preservation of rich national heritage - architectural monuments and cultural-historical landscape; (c) meeting the needs of a growing recreational demand for psychological-aesthetic resources of high mountainous natural and cultural landscape by creating the necessary infrastructure (d) maintaining and development of the traditions of folk art.
References
[1] Akhalkatsi M., Tarkhnishvili D., 2012, Habitats of Georgia (Habitats of Natura 2000 in Georgia are developed in the framework of the project of GTZ), Tbilisi, 118 pp.
[2] Abdaladze O., Akhalkatsi M., Nakhutsrishvili G., Smith W. K. 2005): Some Morphological Features of Betula litwinowii at Tree line in the Central Caucasus. - Proc. Georgian Acad. Sci. Biol. Ser. B, vol. 3, N 2, pp. 57-65.
[3] Abdaladze, O., Khetsuriani, L. 2003: Ecophysiological Peculiarities in Trifolium ambiguum in subalpine zone of the Central Caucasus. Bull. Georg. Acad. Sci. Vol. 167, 150-153.
[4] Abuladze A. 1990. Organization of feeding-places for large raptors // Study and protection of Birds of Prey. Moscow: 240-248 (in Russian).
[5] Abuladze A., 2013, Birds of Prey of Georgia// in Materials towards a Fauna of Georgia, Issue VI, Institute of Zoology, Ilia State University; Printing House “Lasha Khvichia”, Tbilisi: 218 pp.
[6] Agreement on Conservation of African-Eurasian Migratory Waterbirds, Appendix I&II. 1994.
[7] Arabuli A. 1989, Present condition of rare ungulate species in Georgia., All-Union USSR Conference I, Moscow (in Russian).
[8] Bakradze M., Chkhikvadze V., 1992. Checklist of Amphibians and Reptiles of Georgia. News of the Georgian Academy of Sciences, 146 (3): pp 623-628.
[9] Barthlott, W., Lauer, W., Placke, A. 1996: Global distribution of species diversity in vascular plants: towards a world map of phytodiversity. Erdkunde 50, 317-327.
[10] Bastedo, J. D., Nelson, J. G. & Theberge, J. B. Environmental Management (1984) 8: 125.
https://doi.org/10.1007/BF01866933
[11] Beruchashvili N., 1995, Beruchashvili. Caucasus: Landscapes, Models, Experiments, Tbilisi, UNEP-GRID, (In Russian).
[12] Beruchashvili N. L, 1983, Landscape Map of Georgia, N., Types of Vertical Structure of Natural-territorial Complexes. Tbilisi: TSU, Fund material. Scale 1: 500,000 (In Russian).
[13] Beruchashvili N., 1979, Landscape Map of Caucasus. Tbilisi: TSU, 1979. Scale 1:1,000,000.
[14] Bukhnikashvili A., Kandaurov A., Natradze I., 2008, Action Plan for Georgian Bats //Campester, Tbilisi, Georgia, “Uuniversali”: 103.
[15] Bukhnikashvili. A. 2004. On Cadastre of Small Mammals (Insectivora, Chiroptera, Lagomorpha, Rodentia) of Georgia.// Publ. House “Universal”. Tbilisi: 132 pp.
[16] Bukhnikashvili A., Kandaurov A., 2002, "The Annotated List of Mammals of Georgia" //Proceedings of the Institute of Zoology of Academy of Sciences of the Georgia, Metsniereba, Tbilisi, vol. XXI: 319 – 340.
[17] Bukhnikashvili A., Kandaurov A., 1998. The Threatened and insufficiently studied species (Insectivora, Rodentia).// Tbilisi: 56 pp., 27 maps.
[18] Canter, Larry W, "Environmental Impact Assessment.", 2nd edition, 1996, pp. 660.
[19] Gagnidze, 2005. Vaskular Plants of Georgia. A Nomenclatural Checklist. Tbilisi.
[20] Gavashelishvili, A. 2009. GIS-based Habitat Modeling of Mountain Ungulate species in the Caucasus Hotspot. Pp: 74-82. In: Zazanashvili, N. & Mallon, D. (Eds) Status and Protection of Globally Threatened Species in the Caucasus. Tbilisi: CEPF, WWF. Contour Ltd., 232 pp.
[21] Gavashelishvili, A. 2004. Habitat selection by East Caucasian tur (Capra cylindricornis). Biological Conservation 120: 391-398.
[22] Gurielidze Z., 1997. Large Mammals (Carnivora, Artiodactyla, Cetacea). In book: Chatwin, M. E., Kikodze, D., Svanidze, T., Chikvaidze, J., Gvritishvili, M., and Tarkhnishvili, D. (Eds.), Georgian Country Biological Diversity Study Report, (1996., Program "Assistance for preparation of Biodiversity Country Study in the Republic of Georgia"), UNEP, Ministry of Environment of Georgia, Noah's Ark Centre for Recovery of Endangered Species; 1997, Tbilisi, Georgia: 74-82. (in Georgian).
[24] IUCN. 2006. 2006 IUCN Red List of Threatened Species. [www.iucnredlist.org].
[25] IUCN. 2001. IUCN Red List Categories and Criteria – version 3.1. Gland, Switzerland and Cambridge, UK: IUCN.
[26] Janashvili A., 1963. Animals of Georgia, Vol. III - Vertebrates. Tbilisi.
[27] Jedrzejewski W., Nowak S., Kurek R., Myslajek R., Stachura K., Zawadzka B., Pchalek, 2009. Animals and Roads/ Methods of mitigating the negative impact of roads on wildlife. Mammal Research Institute, Polish Academy of Sciences, Bialowieza; Pp. 94.
[28] Joerin, F. and Musy, A. (2000). “Land Management with GIS and Multicriteria Analysis.” International Transactions in Operational Research. 7 (2000) 67-78.
[29] Kandaurov A. (editor); Yavruyan E., Rakhmatulina I., Bukhnikashvili A., Kandaurov A., Natradze I., Gazaryan S., 2008, Bats Conservation Action Plan for the Caucasus, Tbilisi, Publishing House “UNIVERSAL”, 87 pp. (Engl.).
[30] Ketskhoveli, N. (1960) Georgia’s Vegetation Cover. Tbilsi: Metsniereba. (in Georgian).
[31] Kharadze, А. 1960: Endemic hemi-xerophilous element of the Greater Caucasus. Botany Isuues 5, 115-126. (in Russian)
[32] Kharadze, A. (1946) For Studies of the Peri-glacial Vegetation of the Central Greater Caucasus. Bull. Georg. Acad. Sci. 7. p. 9-10.
[33] Khetsuriani, L. 1976: Eco-physiological features of some plants of the Central Greater Caucasus. Academy of Sciences of the GSSR Press. Series Biology, volume 2, 4: 352-357. (in Russian).
[34] Körner, C., Nakhutsrishvili, G. 1987: Effect of grass-mowing and grazing on water exchange in high-mountain plants. Book: Ecology of Kazbegi high mountain meadows (Central Greater Caucasus). (Editor Rabotnov, T.) Metsniereba (Science), Tbilisi. 99-120.(in Russian).
[35] Körner Ch 2012: Biological diversity – the essence of life and ecosystem functioning. Nova Acta Leopoldina 116/394: 147-159.
[36] Kutubidze, M., 1985. The Guide to the Birds of Georgia // Published by Tbilisi State University: 648 pp. + b/w ill. (in Georgian).
[37] Maidment D., Djokic D., 2000, “Hydrologic and Hydraulic Modeling Support with Geographic Information Systems” //ESRI Press.
[38] Ndubisi, Foster, 2002, Ecological planning: a historical and comparative synthesis; ISBN 0-8018-6801-7
[39] Nakhutsrishvili, G. (2013) The Vegetation of Georgia (Caucasus). Heidelberg, New York, Dortrecht, London: Springer.
[40] Nakhutsrishvili, G., Abdaladze, O. and Akhalkatsi, M. (2006) Biotope Types of the Treeline in the Central Greater Caucasus. In Gafta, D, & Akeroyd, J. (eds.): Nature Conservation. Concepts and Practice., Berlin, Heidelberg, New York: Springer.
[41] Nakhutsrishvili G., Abdaladze O., Akhalkatsi M. (2004): Global warming and Treeline. – Proc. Acad. Sci. Biol. Ser. B.,
vol. 2, 3-4, pp. 87-90.
[42] Nakhutsrishvili G., Abdaladze O., Akhalkatsi M. (2004): Concerning the Tree line Vegetation of the kazbegi Region (the Central Caucasus). – Bull. Georg. Acad. sci. vol. 169, 1, pp. 122-125.
[43] Nakhutsrishvili, G. (2003) High-mountain Vegetation of the Caucasus Region. In Nagy, L., Grabherr, G., Körner, CH. & Thompson, D. B. A. (eds.) Alpine Biodiversity in Europe, Ecol. Stud. 167. Berlin-Heidelberg: Springer.
[44] Nakhutsrishvili, G. 1988: The ecological characteristic of high mountain meadows’ vegetation. (an example of Kazbegi example, Central Greater Caucasus). Book: High Mountain Ecology (Editor Nakhutsrishvili). Metsniereba (Science), Tbilisi. 175-200. (in Russian).
[45] Sakhokia M., E. Khutsishvili. 1975. Conspectus Florae Plantarum Vascularium Khevi, Distr. Kazbegi, RSS Georgicae. Tbilisi.
[46] Sérusiaux, E. (1989) Liste rouge des macrolichens dans la Communauté Européenne. Liège: Université de Liège.
[47] Shidlovskiy M. V., 2013. «Insectivore and Cheiroptera of Georgia» (Faunistic profile) and «Rodents of Georgia - Faunistic composition and eco-geographical distribution», Lasha Khvichia” press, 2013, 176 pp. (in Russian).
[48] Shidlovsky M., 1976. Guide to Rodents of Transcaucasia, Second Edition. Metsniereba, Tbilisi. p. 255. (In Russian).
[49] Sokolov V., Tembotov A., 1989. Vertebrates of Caucasus, Mammals, Insectivora. Moscow, Nauka. p. 545. (In Russian)
[50] Solomon., J., Shulkina, T. and Schatz, G. E. (eds.) (2014) Red List of the Endemic Plants of the Caucasus: Armenia, Azerbaijan, Georgia, Iran, Russia and Turkey. Monographs in Systematic Botany from the Missouri Botanical Garden (MSB) 125. Saint Louis: Missouri Botanical Garden Press.
[51] Stephenson S., “Abiotic, Biotic and Cultural Resource Survey for Land Planning along the Rideau Canal”, Queen’s University, School of Urban and Regional Planning, 2011.
[52] Tarkhnishvili, D., 2012, Evolutionary History, Habitats, Diversification, and Speciation in Caucasian Rock Lizards // Advances In Zoology Research, Volume 2 (Ed. Jenkins Op), Nova Science Publishers, Hauppauge (Ny) Pp. 79-120.
[53] Tarkhnishvili D., Kandaurov A., Bukhnikashvili A., 2002, "Declines of amphibians and reptiles in Georgia during the 20th century: virtual vs. actual problems" //Zeitschrift für Feldherpetologie, 2002, № 9: 89-107.
[54] Vereshchagin N., 1959. Mammals of Caucasus - History of Faunal Development. USSR Academy of Sciences. p. 703. (In Russian).
[55] Zazanashvili, N., Gagnidze, R., and Nakhutsrishvili, G. (2000). Main Types of Vegetation Zonation on the Mountains of the Caucasus. Acta Phytogeographica Suecica 85: 7-16.
[56] Zimina R. Zlotin R. (editor), 1990, Biota of the ecosystems of the Greater Caucasus, Academy of Sciences of the USSR, "Nauka" (Science), М., 200 с. (in Russian).