Published online September 10, 2013 (http://www.sciencepublishinggroup.com/j/ajep) doi: 10.11648/j.ajep.20130205.11
Problems of solid waste management in developing urban
cities: a case study of Freetown, Sierra Leone
Foday Pinka Sankoh
1, 2, *, Xiangbin Yan
11School of Management, Harbin Institute of Technology, China
2Department of Integrated Sciences, Portloko Teachers College, Portloko, Sierra Leone
Email address:
[email protected] (F. P. Sankoh)
To cite this article:
Foday Pinka Sankoh, Xiangbin Yan. Problems of Solid Waste Management in Developing Urban Cities: A Case Study of Freetown, Sierra Leone. American Journal of Environmental Protection. Vol. 2, No. 5, 2013, pp. 113-120. doi:10.11648/j.ajep.20130205.11
Abstract:
This study was designed to determine the existing problems of solid waste management in Freetown. The problems that were assessed were the factors impeding the effectiveness and efficient solid waste management and the wrong attitudes and perceptions of the people about sanitation issues which have contributed to solid waste management problems in Freetown. Structured questionnaires were administered with respect to socioeconomic and solid waste management data. Interviews and personal observations were also used to collect some of the data. Data analysis was carried out using the Statistical Packages for Social Sciences (SPSS) software. The results show that majority of the households did not educate their members on the need to clean their surroundings. Virtually, all the people depend on the Freetown Waste Management Company’s facilities for the disposal of their household refuse. The study concludes that solid waste management problems are partly the result of Freetown Waste Management Company’s inability to cope with the situation because of lack of equipment, personnel, and inadequate funding. Therefore, the study recommends that the waste management authority’s effort in the area of education should be intensified in order to sensitize the people on the need to keep the surroundings clean. The participation of the private sector, government, NGOs’ and the international community in offering adaptable solutions towards improving solid waste management situation in Freetown is also needed.Keywords:
Solid Waste Management, Problems, Freetown, Household1. Introduction
Regardless of the context, solid waste management is one of the biggest challenges of urban areas of all sizes, from mega-cities to small towns and large villages, which are home to the majority of human kind. It is almost always in the top five of the most challenging problems for city managers [1].The quality of waste management services is a good indicator of a city’s governance. The way in which waste is produced and discarded gives us a key insight into how people live. In fact if a city is dirty, the local administration may be considered ineffective or its residents may be accused of littering [1].Given the rapid rates of urbanization occurring around the world, the importance of an efficient and effective solid waste management system is more critical than ever before. Nowhere is this truer than in urban areas in the developing world, where unprecedented urban growth has resulted in greater amounts of municipal
2. Materials and Methods
2.1. Background to the Study
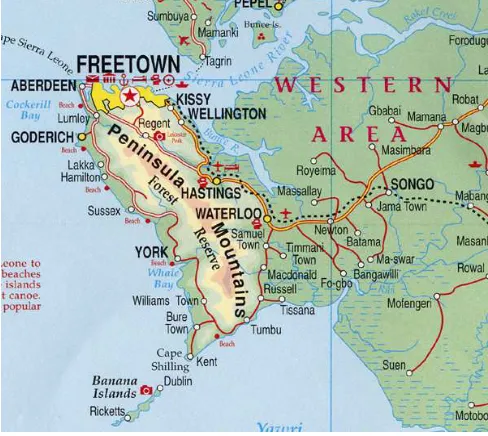
Figure 1 is a geographical map of Freetown the study area. Freetown was founded on the 11th March, 1792 and it is the capital city of Sierra Leone, a small country in West Africa. It is a major port city on the Atlantic Ocean located on 8.480 N and 13.230 W with a total area of 357 square kilometers in the western area of the country. The climate of Sierra Leone is tropical with the raining season lasting from May to December and the dry season from December to April, and rainfall along the coast can reach 495cm a year with Freetown having the highest amount of rainfall, greater than 3500 milliliters. It has a population of 772873[4]. The city is the economic, financial and cultural center of Sierra Leone where the economy revolves largely around its harbor- occupying a part of the estuary of the Sierra Leone River in one of the world’s largest natural harbor, Queen Elizabeth 11 Quay. This harbor is capable of receiving ocean going vessels and handles Sierra Leone’s main port. Industries, commercial activities, health and educational institutions have duly increased the population of Freetown with a corresponding increase in the quantity of solid waste. The problems of solid waste in Freetown can be traced far back as the 60s when the management has been under variable organizations; both private and public (Table 1). Unfortunately, each change further deteriorated the system, bringing it on the verge of collapse.
Table 1. “Forster care” Record of Solid Waste Management responsibility
Date Name of authority
Before 1961
1971 1980 1982
1987
1993
1995
2003
2005 2006 2008
Department of Health and Human Services(DoHSS) Freetown City Council(FCC) Ministry of Health(MoH)
Ministry of Health through Ajibu Jalloh Private Contractor
Environmental Health Division(EDH) Phase 1
Environmental Health Division(EDH) Phase 11
Environmental Health Division(EDH) Phase111
Ministry of Youth and Sports through the National Youth Multipurpose Cooperative Society(NYMCOS)
Freetown City Council(FCC) Ministry of Local Government
Freetown Waste Management Company(FWMC)
The problem of increased population was further compounded in the mid 1990s when Freetown served as a safe haven for thousands of people from the provinces during the war and suffered a corresponding increase in the rate of generation of waste with very little management facilities as skip trucks, containers were vandalized or completely destroyed. The Freetown Waste Management Company (FWMC), the current authority, is struggling to manage the wastes under tight budgets, limited trained but
inexperienced man power, and little or no legislative authority and experience in solid waste management. Given the lack of education and awareness, and coupled with the very weak penalties (if any) for non- compliance, the public at large is also generally non-cooperative [5]. Many previous studies have examined problems of solid waste in both developed and developing countries. These studies analyzed the problems of solid waste in different countries, sharing data and allowing for evaluation of the state-of-the-art in terms of waste generation, collection, transportation, disposal, recycling, attitudes and perceptions of the people towards sanitation issues, inadequate funding, insufficient tools and equipment [6-15].
According to Wilson, D. C. et al.,(2010)[16], one-third to one-half of solid waste generated within most cities in low and middle income countries, of which Sierra Leone is no exception are not collected. They usually end up as illegal dumps on streets, open spaces and waste lands.
Figure 1. Map of Freetown Source: maps. Google.com
management in developing cities as the availability of land for disposal is very limited [7], [15]. McDougall, F.R. et al [15] have also shown that the problem of solid waste management in urban cities can be attributed to poor financial status of the management authorities. Solid waste management involves a huge expenditure and thus receives scant attention in many parts of the world. Cities in both developed and developing countries generally do not spend more than 0.5% of their per capita national product (GNP) on urban waste services, which covers only about one-third of overall cost [19]. In Sierra Leone, FWMC was established by an act of parliament to serve as the authorized waste disposal unit in the municipality of Freetown. It was partly funded by World Bank and Freetown City Council (FCC). Due to the inadequacy of this funding, the FWMC is struggling to cope with the present situation as its workers are subjected to poor conditions of work-late or no payment of salaries, no protective gears and medical fee for the workers. Therefore, the objectives of this paper are to examine the problems of solid waste management in Freetown, Sierra Leone and provide an insight to citizens,
government officials, the private sector, and
Non-governmental Organizations who might want to resolve the solid waste management crisis in Freetown.
2.2. Research Design
This study uses a quantitative approach of data gathering [20] which involved an enquiry into the social problems of waste management in Freetown, measured with numbers and analyzed with statistical procedures.
Hypothesis testing statistics, Chi-square test was employed to establish the significant relationship between (a) identified factors impeding the effectiveness of FWMC and the efficiency of solid waste management system and (b) wrong attitudes and perceptions of the people about sanitation issues contribution to solid waste management problems in Freetown. The choice on the use of questionnaires as a key data gathering instrument in this study was the effectiveness of previous studies’ methods demonstrated on problems of solid waste management in [21-24].
The study employed four different questionnaire surveys for household residents, staff of FWMC, staff of Freetown City Council and staff of the Ministry of Health and Sanitation in collecting data on the problems and suggested solutions of solid waste management in Freetown. A pilot study consisting ten respondents was conducted before the main study in order to check the clarity of the questions, to eliminate difficulties or ambiguities, and to estimate the length of time a respondent would take to complete the questionnaires [25]. The results obtained will provide an opportunity for a revision of the questions where necessary before the main study was conducted.
2.3. Sample Size Determination
In this study questionnaires were administered to 901
respondents of the study area which included household residents out of 1203 households in the study area, staff FWMC, staff of Freetown City Council and staff of the Ministry of Health and Sanitation. Of the 901 questionnaires administered 631 were received given 70% response. 70% sample size was the representative population which was easy to manage and came up with good results. The method ensured that there was no biasness in the selection of the population who were part of the sample. This was the case because in order to determine the problems of waste management in Freetown, it is crucial to use stratified- simple random sampling as every member of the study area had an equal probability of being selected to be part of the study.
2.4. Questionnaire Administration
The study was carried out in three stages: stage one (1) involved a desk study in which documents and records relating to the problems of solid waste management were studied to obtain background information as well as data to enable the analysis of the problems of solid waste management in Freetown, Sierra Leone; stage two (2) involved a visit to the Waste Management authority, the Freetown City council and the Ministry of Health and Sanitation to interview few staff members at random. The questions were tailored to derive information on the problems of solid waste management in Freetown and ways to alleviate the problems; stage three (3) involved the administration of structured questionnaires which contained both close and open ended questions to 901 respondents in order to obtain solid information. The first part of the questionnaire sought to obtain data on socioeconomic characteristics such as age, gender, marital status, average family size, occupation, monthly income and education. The second part was to obtain information on the current problems of solid waste management in terms of collection, storage, transportation, attitudes and perceptions of people towards sanitation issues which include people’s opinion on responsibilities for ensuring clean surroundings, education of house holds to clean their surroundings, disposal of household waste and children’s involvement in solid waste management. The data gathered from various sources were processed and analyzed separately and integration occurred at the data interpretation stage. This strategy was selected as it allows the findings to be confirmed, cross-validated, and corroborated within a single study [26]. The data gathered from the questionnaire was analyzed by using the Statistical Product and Service Solutions (SPSS) soft ware.
3. Results and Discussion
3.1. The Relationship between Socioeconomic Characteristics and Problems of Solid Waste Management
household plays an important role in environmental problems associated with the generation of solid waste. These societal changes influence the characteristics of given households, including age and gender, marital status, occupation, family size and income level (due to societal status and wealth). Majority of the respondents fall within the economically active group (20-50 years) (Table 2). The scenario here is that they have the purchasing power to consume and hence generate wastes. With regards the marital status of the respondents, majority of them are married households (32%) although dominated singles by a narrow margin (Table 2). Married life affects family size which in turn influences consumption patterns and waste generation and management. Married people encourage meals that are African in nature and minimum packaged food with attendant waste like plastic materials. Single people on the other hand consume more of packaged foods which generate plastic materials as wastes. Also respondents indicated that 21.8% of them are in the formal sector employment while 78.2% are in the non-formal sector employment. A majority of the respondents are in the non-formal sector employment-a potential source of waste generation in the city. In addition, respondents indicated that they earn income from both formal and non-formal sectors of employment. The income level of an individual member of any community is a vital factor which determines his/her demands for goods and services.
Table 2. Description of socioeconomic characteristics of respondents
socioeconomic
characteristics Frequency Percentage
(a) Age years 20 < years 50 -20 years 50 Above Tot al status latir a M ) b ( Married Single Widower / Widow Separated Total (c)Occupation Formal employment Nonformal employment Total 162 301 168 631 202 158 120 151 631 138 493 631 25.7 47.7 26.6 100 32 25 19 24 100 21.8 78.2 100 (d)Income levels (In Leones) 200000 < 500000 -200000 900000 -500000 900000 > Total
(e) Educational levels Higher education Senior secondary school
Junior secondary school
Primary school None Total 172 184 142 133 631 378 158 57 32 6 631 27.3 29.1 22.5 21.1 100 60 25 9 5 1 100
In Table 2, majority of the respondents are high income earners. The higher the income, the waste generated which has an implication on waste management.
3.2. Attitudes and Perceptions of Respondents towards the Cleanliness of their Surroundings
Issues of attitudes and perceptions appear to affect both
inhabitants and authorities regarding solid waste
management in Freetown. In Table 3 the respondents indicated that issues such as people’s opinion on responsibilities for ensuring clean surroundings, education of household to clean their surroundings, disposal of household waste and children’s involvement in solid waste management contributed to solid waste management problems in Freetown. Further analysis of respondents data shown in figure 2 revealed that since a higher percentage of the respondents (75%) were thinking that the FWMC is solely responsible for ensuring clean surroundings, it is likely that the people may support clean up campaigns meant for making the surroundings clean. This confirms the studies of Sood [27] that with the establishment of the FWMC the public tend to have the view that the FWMC should be sole responsible for managing waste. In order to change this trend it was suggested that the people be educated to see the problem as a shared responsibility of both the individuals in Freetown and the FWMC.
Table 3. Attitudes and perceptions of the people towards solid waste management
Attitudes and perceptions
FWM C
FC
C HHR MoHS T %
education ) i (
of households to clean heir surrounding t s s ' people ) ii ( opinion on clean surroundings disposal ) iii ( of house hold waste s ' children ) iv involvement in -solid waste management Total 35 60 25 23 143 40 78 50 45 213 35 16 55 40 146 40 50 27 12 129 150 204 157 120 631 24 32 25 19 100
FWMC=Freetown Waste Management Company; FCC= Freetown City Council; HHR= Household residents; MoHS= Ministry of Health and Sanitation; T= Total; %= Percentage
must be responsible for cleaning their own surroundings gave their reasons as indicated in figure 3. Besides the reasons given by respondents that individuals should take responsibility for the cleanliness of their surroundings, there are other reasons. These reasons include the general impressionsof visitors to the city since it is the gate way to the country, destruction of the city’s scenic beauty, and the choking of drainages channels that will lead to flooding and environmental pollution.
0 10 20 30 40 50 60 70 80
FWMC Individuals Both FWMC and
Individuals
response
p
e
rc
e
n
ta
g
e
Figure 2. Views on responsibility for ensuring clean surroundings
Individuals should therefore help in the cleaning of their surroundings. The reasons given suggest low level of respondents’ knowledge concerning sanitation issues. More seminars and talk shows on sanitation could be organized as a remedy.
Figure 3. Reasons for individuals to help clean their own surroundings
It was also realized that there was some kind of relationship between the respondents’ level of education and their perceptions about cleaning their own surroundings. A higher percentage of those with relatively higher education thought that it was appropriate for individuals to clean their own surroundings (Table2). The study showed that 74% of the respondents do not educate their households on the need to clean the surroundings while about 26% do. The implications of having more people who do not care to educate their households on making the surroundings clean could mean that society will translate it into acceptable behavior in relation to solid waste management, and especially the children will not develop the right attitudes and perceptions for sanitation at an earl stage in life. This is likely to impact negatively on how the present and next generation would handle sanitation in general and solid waste in particular. This is because it was realized that 86% of the respondents involved children below the age ten in the disposal of their household waste. Such children are often asked by their parents and other family members to carry the
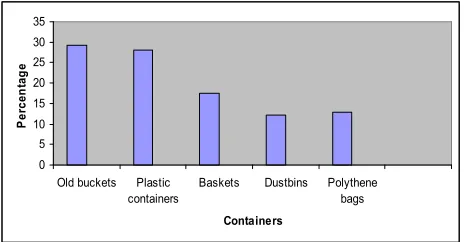
household waste to the sanitary site. Thus, according to these respondents carrying the household waste was not the duty of adults. About 14% of the respondents who did not involve such children in solid waste disposal explained that they did not have such children in their households to carry refuse. There is a greater likelihood of indiscriminate disposal of household waste in Freetown with children dominating as carriers of household waste to the designated sanitary sites. This may partly explained why refuse if found all over the city. This problem might be changed for the better if the children (under ten) who carry household waste are given special training about waste handling. The study indicated that respondents used containers like old buckets, plastic containers, baskets, dustbins and polythene bags to store solid waste. With the exception of dustbins, none of the containers had covers. More garbage was stored in old buckets (29.3%) and plastic containers (28.1%) (Figure 4). These waste handling methods are a likely contributory factor for poor sanitation in the respondents’ community because much of the solid waste is littered about before reaching the disposal sites. Much of the refuse is kept close to the kitchens and rooms, which may cause diseases like cholera and typhoid fever.
0 5 10 15 20 25 30 35
Old buckets Plastic containers
Baskets Dustbins Polythene
bags
Containers
P
e
rc
e
n
ta
g
e
Figure 4. Household solid waste storage containers
Table 4. Lessons taught to household members on sanitation
Lesson Frequency Percentage
1. Dirty surroundings cause diseases
2. Household members must not litter
3. People and family must not burn refuse in open pits
4. Both(1) and(2)
5. Both(1) and(3)
6. .Both(2) and(3)
Total
225
40
50
75
116
125
631
36
6
8
12
18
20
100
3.3. Problems of Freetown Waste Management Company (FWMC) in Solid Waste Management
Generally, all solid waste produced in Freetown are collected for final disposal at various designated sites by the FWMC. This is because Freetown is the capital city of Sierra Leone and it is a first class residential area with high income status, poor layout of streets and other infrastructure, and dense population. Therefore, the waste management method adopted must be related to the nature of the community served, its financial capacity and climatic conditions.
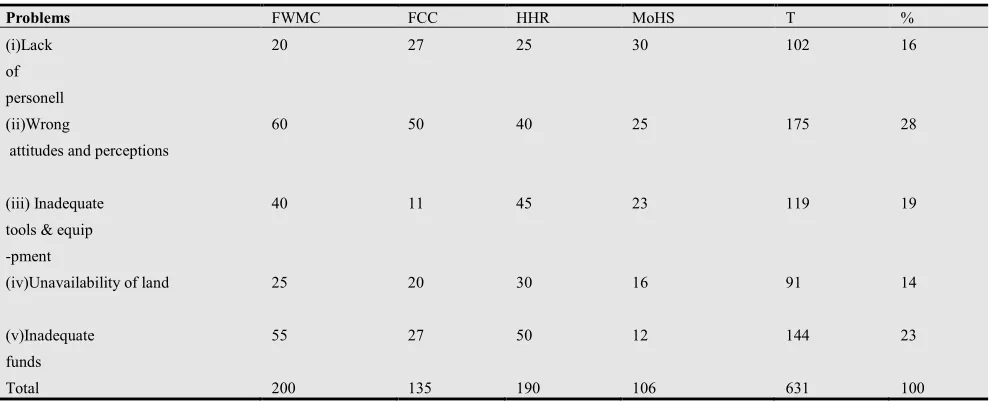
However, analysis of respondents’ data shown in Table 5 revealed that FWMC cannot effectively cope with the solid waste management problems in Freetown as the amount of solid waste produced far outweigh its capacity to dispose of it. This is because of its inadequate equipment (Figure 5), which is also a result of limited finances and lack of modern equipment and personnel. These problems coupled with the attitudinal and perceptual problems further increase the ineffectiveness of the solid waste management in the city.
Table 5. Problems of solid waste management in Freetown
Problems FWMC FCC HHR MoHS T %
Lack ) i (
of
personell
Wrong ) ii (
attitudes and perceptions
(iii) Inadequate
tools & equip
-pment
(iv)Unavailability of land
Inadequate )
v (
funds
Total
20
60
40
25
55
200
27
50
11
20
27
135
25
40
45
30
50
190
30
25
23
16
12
106
102
175
119
91
144
631
16
28
19
14
23
100
FWMC=Freetown waste management company; FCC= Freetown City Council; HHR= Household residents; MoHS= Ministry of Health and Sanitation; T= Total; P= Percentage
0 50 100 150 200 250
Sho vels
rake s
Pic k ax
es
Han d gl
oves
Whe elba
rrow s
Ski p tru
cks
Skip cont
aine rs
Tipp ers
Tric ycle
s
Veh icle
s
Description
P
e
rc
e
n
ta
g
e
Available
Optimum
Figure 5. Kind and adequacy of FWMC's equipment
0 50 100 150 200 250 300 350
Sca veng
ing( men
)
Swee pers
(wom en)
Ref use
labo urer
s
Cle anin
g of ficer
s
Cle arin
g gu ards
Labour description
P
e
rc
e
n
ta
g
e
Current number Optimum number
Figure 6. The labor force of FWMC
Because FWMC cannot adequately provide enough vehicles, containers and personnel, the proliferation of garbage dumpsites across the city continue. As one citizen remarked, “every morning when one wakes up, new dumpsites materialize in areas they are not supposed to be”. This problem has encouraged the use of various inappropriate methods for household waste disposal such as solid waste being left in open pits for burning. The help of
concerned citizens, government organizations and
Non-Governmental Organizations in terms of the provision of funds and equipment may be a remedy to this problem.
3.4. Statistical Analysis
The Chi-square was used to test the following hypotheses: (a) the significant relationship between wrong attitudes and perceptions of the people about sanitation issues and effective solid waste management (data from Table 3). (b) The significant relationship between waste management authority’s inability to cope with solid waste crisis (due to problems) and its effectiveness in the solid waste management (data from Table 5).
Table 6. A summary of the chi-square test statistics.
Hypothesis Df
χ2
Cal.
χ2
Tab P -value
) a (
) b (
9
12
59.36
46.46
27.88
32.91
0.001 < P
0.001 < P
Df= degrees of freedom; χ2 Cal. = chi-square calculated; χ2 Tab. = chi-square tabulated
Since the chi-square calculated is greater than the tabulated with 9 degrees of freedom at P < 0.001 was significant, therefore the hypothesis was accepted to be true. Hence wrong attitudes and perceptions of the people on sanitation issues contributed significantly to the problems of solid waste management. Also for hypothesis (b), since the chi-square calculated is greater than the tabulated with 12 degrees of freedom at P < 0.001 was statistically significant; therefore the hypothesis was accepted to be true. Hence waste management authority’s inability to cope with solid waste crisis is positively related to the problems of solid waste management.
4. Conclusions
The collected data on the problems of solid waste management in Freetown, Sierra Leone were presented and analyzed. The study shows that the people of the study area had poor attitudes and perception towards solid waste handling. They would store their household refuse in containers that have no coverings. The people depended virtually on the Freetown Waste Management Company’s facilities for their household refuse disposal. The waste management authority’s equipment and personnel for handling solid waste in the city were woefully inadequate. The FWMC workers lacked incentives that will motivate them to do perfect jobs. Therefore, the study recommends that the public should be educated by the waste management authority on solid waste and its related issues through the radio, television, newspapers, and even in schools on proper ways of handling solid waste and keeping the surrounding clean. People should develop proper attitudes and perceptions towards waste handling through formal and informal education. The participation of the government, the private sector, citizens, Non-Governmental Organizations and donor agencies to strengthen the financial base of the waste management authority. This will enable it to acquire equipment, effective and efficient personnel.
References
[1] Wilson, D.C., Rodic, L., Scheinberg, A., Velis, C.A. and Alabaster, G. Solid Waste Management in the world’s cities,
UN-HABITAT, Third edition. 2012. ISBN
978-92-1-132218-7 HS/105/10E/ Accessed at: http://www.waste.nl/product/solid-waste-management-in-the -world’s-cities 30/1/2013.
[2] Hoornweg, D and Bhada-Tata P. What A Waste: A Global Review of Solid Waste Management, Urban Development Series, Knowledge Papers, No. 15. 2012, the World Bank,
Washington DC. Accessed
at:http://go.worldbank.org/BCQEP0TMo0 15/2/2013 [3] Ogawa H. Sustainable Solid Waste Management in
Developing Countries, 7th ISWA International Congress and Exhibition, World Health Organization, Kuala Lumpur,
Malaysia. 2000. Accessed at:
http://www.soc.titech.ac.jp/uem/waste/swm-fogawal.htm 26/9/2012.
[4] Sierra Leone. Final Results: 2004 Population and Housing Census, Statistics, Sierra Leone. 2006. Accessed at: http://www.statistics.sl/ 17/5/2012.
[5] Gogra, A.B., Yao, J., Kabba, V.T.S., Sandy, E.H., Zaray, G., Gbanie, S.P., and Bandabla, T.S. A situational analysis of waste management in Freetown, Sierra Leone. Journal of American Science, 6(5): 124-135. 2010
[6] Qu, X., Li, Z., Xie, X., Sui, Y., Yang, L., and Chen, Y. Survey of composition and generation rate of household waste in Beijing, China. Waste Management, 29:2618-2624.2009. [7] Parrot, L., Sotamenou, J and B.K. Dia, B.K. Municipal solid
Yaoundé, Cameroon. Waste management, 29(2):986-995. 2009.
[8] Pires, A., Martinho, G and Chang, N.B. Solid waste management in European countries: A review of systems analysis techniques. Journal of Environmental Management, 92(4):1033-1050. 2011.
[9] Guerrero, L.A., Ger, G and William, H. Solid waste management challenges for cities in developing countries. Waste Management, ISSN: 0956-053X. 2012.
[10] Dijkema, G.P and Volleberg, H.R.J. Burn or bury? A social Cost comparison of final waste disposal methods. Ecological Economics, 50:233-247. 2004.
[11] Koufodimos, G and Samaras, Z. Waste management options in southern Europe using field and experimental data. Waste Management, 22:47- 59. 2002.
[12] Jha, A.K., Singh, S., Singh, G, and Gupta, P.K. Sustainable municipal solid waste management in low income group of cities: a review. Tropical Ecology, 52(1):123-131. 2011. [13] Chen, X., Geng, Y., and Fujita, T. An overview of municipal
solid waste management in China. Waste Management, 30(4):716-724. 2010.
[14] Getahun, T., Mengistie, E., Haddis, A……Van der Bruggen, B. Municipal solid waste generation in growing urban areas in Africa: current practices and relation to socioeconomic factors in Jimma, Ethiopia. Environmental Monitoring and Assessment, 1-9. 2012.
[15] McDougall, F.R, White, P., Frank, M, and Hindle, P. Integrated solid waste management. Wiley online Library. ISBN: 0470999675. 2001.
[16] Wilson, D.C., Scheinberg, A and Rodic, L. Solid Waste Management in the World’s cities. UN-HABITAT” Third Edition. 2010, ISBN: 978-92-1-132218-7, HS/105/10E/ Accessed
at:http://www.waste.nl/product/solid-waste-management-in-the-world’s-cities
[17] Wilson, D.C., Araba, A.O., Chinwah, K., and Cheeseman, C.R. Building recycling rates through the informal sector. Waste management, 29(2): 629-635. 2009.
[18] Marshall, R.E and Farahbakhsh, K. Systems approaches to integrated solid waste management in developing countries. Waste Management. ISBN: 0470999675. 2013
[19] Hoornweg, D and Xie, J. Municipal Solid Waste Management and Low-Carbon Cities in China. Sustainable Low-Carbon City Development in China, 325. 2012. [20] Lomax, R.G. Statistical Concepts: A second Course. 10.
ISBN: 0-8058-5850-4, Taylor. 2007.
[21] Thanh, N.P and Matsui, Y. Municipal Solid Waste Management in Vietnam: Status and the Strategic Actions. Int. J. Environ. Res, Vol.5 (2): 285- 296. ISSN: 1735-6865. 2011.
[22] Zaini, S. Municipal Solid Waste Management in Malaysia: Solution for Sustainable Waste Management. Applied Sciences in Environmental Sanitation, 6(1):29-38. 2011. [23] Chukwunonye, E and Roberts, C.L. Analysis of barriers and
success factors affecting the adoption of sustainable management of municipal solid waste in Nigeria. Environmental Management, 103(30): 9-14. 2011.
[24] Al-Khatib, I.A., Monou, M., Abu Zahra, A.S.F., Shaheen, H.Q and Kassinos, D. Solid waste characterization, quantification and management practices in developing countries. A case study: Nablus district–Palestine. Journal of Environmental Management, 91(5):1131-1138. 2010. [25] Ott, L and Longnecker, M. An Introduction to Statistical
methods and data analysis: Duxbury Press, 2010.
[26] Creswell, J.W. Qualitative inquiry and research design: Choosing among five approaches. SAGE Publications, Incorporated, 2012.