R E S E A R C H A R T I C L E
Open Access
Transdiagnostic associations across
communication, cognitive, and behavioural
problems in a developmentally at-risk
population: a network approach
Silvana Mareva
*, the CALM team and Joni Holmes
Abstract
Background:Communication, behavioural, and executive function problems often co-occur in childhood. Previous
attempts to identify the origins of these comorbidities have typically relied on comparisons of different deficit groups and/or latent variable models. Here we apply a network approach to a heterogeneous sample of struggling learners to conceptualise these comorbidities as a dynamic system of interacting difficulties.
Methods:714 children struggling with attention, learning, and/or memory were included. The sample consisted of
children with both diagnosed (41%) and undiagnosed difficulties. The conditional independence network of parent ratings of everyday behaviour, cognition, and communication was estimated.
Results:A clustering coefficient identified four interconnected areas of difficulty: (1) structural language and learning; (2) pragmatics and peer relationships; (3) behavioural and emotional problems; and (4) cognitive skills. Emotional and behavioural symptoms shared multiple direct connections with pragmatic abilities and cognitive problems, but not with structural language skills or learning problems. Poor structural language and cognitive skills were associated with learning problems. Centrality indices highlighted working memory and language coherence as symptoms bridging different problem areas.
Conclusion:The network model identified four areas of difficulty and potential bridging symptoms. Although the current analytic framework does not provide causal evidence, it is possible that bridging symptoms may be the origins of comorbidities observed on a dimensional level; problems in these areas may cascade and activate problems in other areas of the network. The potential value of applying a dynamic systems network approach to symptoms of developmental disorders is discussed.
Keywords:ADHD, Language, Executive function, Learning difficulties, Behaviour problems, Network analysis
Background
Behavioural difficulties, poor communication skills, and everyday cognitive problems are common in children, and they often co-occur [1–5]. Each set of symptoms is com-monly associated with a specific developmental disorder, and as a consequence is typically studied in groups of children in whom such problems are characteristic. For example, behavioural problems such as hyperactivity are typically studied in children with attention deficit
hyperactivity disorder (ADHD), while communication dif-ficulties such as poor speech are often studied in children with developmental language disorder (DLD). There are practical advantages to this categorical approach. It de-fines clear symptom-based criteria to inform practitioner decision-making about diagnoses and interventions. How-ever, it fails to accommodate high rates of comorbidity across developmental disorders [6–10] and substantial heterogeneity within disorders [7,11–13]. The aim of the current study was to move away from studying links be-tween problems of behaviour, communication, and cogni-tion in discrete groups. Instead, symptom associacogni-tions are
© The Author(s). 2019Open AccessThis article is distributed under the terms of the Creative Commons Attribution 4.0 International License (http://creativecommons.org/licenses/by/4.0/), which permits unrestricted use, distribution, and reproduction in any medium, provided you give appropriate credit to the original author(s) and the source, provide a link to the Creative Commons license, and indicate if changes were made. The Creative Commons Public Domain Dedication waiver (http://creativecommons.org/publicdomain/zero/1.0/) applies to the data made available in this article, unless otherwise stated. * Correspondence:[email protected]
explored in a large heterogeneous sample of children with clinical and subclinical levels of difficulties.
Over the past decade, there has been a broad shift away from diagnosis-specific deficits toward identifying dimen-sions that cut across disorders conventionally considered to be distinct [14, 15]. This approach has been applied most widely to adult psychiatric conditions [16–18], but there is widespread recognition of its value for characteris-ing developmental disorders in terms of underlycharacteris-ing di-mensions of symptoms [19–23]. One of the most common methods for understanding how symptoms are related uses latent variable models, a statistical method that groups variables based on shared variance to derive underlying dimensions of difficulties [24]. This technique has been used to identify dimensions of phonological and non-phonological skills in children with diagnosed DLD and dyslexia [25]; and separate latent constructs for in-attention and hyperactivity in children with ADHD [26].
Network analysis offers an alternative approach to un-derstanding symptom interrelations. Instead of identify-ing underlyidentify-ing dimensions, network models focus on symptom-level associations, allowing for the possibility that symptoms could interact to causally affect and acti-vate one another [27, 28]. This framework is suited to conceptualising and evaluating the potential origins of comorbidities. For example, pragmatic difficulties char-acteristic of ASD, and hyperactivity problems common in ADHD often co-occur [7,11,29,30]. From a network model perspective, this co-occurrence can be conceptua-lised as arising in a dynamic system in which symptoms traditionally linked with one developmental disorder might trigger and/or maintain symptoms commonly as-sociated with a different disorder.
In the current study network science is used to under-stand comorbidities between problems with communica-tion, executive functions, and behaviour. Symptoms of communication and behavioural problems co-occur in the general population and in children with developmental disorders such as ADHD [7, 11, 30, 31], ASD, DLD, and reading difficulties [20,31–33]. Individuals with commu-nication and/or behavioural problems, including those with diagnosed developmental disorders, often have add-itional deficits in executive functions (EFs) - the cognitive abilities regulating thoughts and behaviour [34]. EFs can be broadly construed as two distinct but related neurode-velopmental systems. Cool cognitive-based EFs encompass working memory, planning, and cognitive inhibition, and are associated with academic learning [32] and attention [33]; hot executive processes are associated with stronger affective valence and involve the regulation of emotional responses and social awareness [34].
It is not clear why communication, cognitive, and be-havioural problems co-occur in childhood. These areas of difficulties likely share common environmental and
genetic influences. Nonetheless, there are several possibil-ities about how they may interact dynamically. One is that deficits in cool EFs might underlie both behavioural and communication difficulties. Consistent with this, poor working memory has been shown to underpin problems in attention, behaviour, and structural language [33, 35], and also accounts for the relationship between hyperactiv-ity and pragmatic communication problems [36]. Alterna-tively, associations between cool EFs and pragmatics could be mediated by difficulties with hot EFs. Difficulties in in-hibitory control could lead to hyperactive-impulsive be-haviour and consequently poor social communication skills. Children who regularly display difficult behaviour may have limited opportunities to socialise, and thereby fail to develop good communication skills. In line with this, hyperactive-impulsive behaviours have been shown to account for the relationship between inhibition and the ability to apply pragmatic rules in everyday situations [37]. Another possibility is that language deficits may directly and/or indirectly impact the ability to regulate cognition, behaviour, and communication [38,39]. For example, dif-ficulties with language may lead to peer rejection and aca-demic difficulties, which in turn may trigger behavioural problems.
The current approach uses network modelling to esti-mate associations and conditional independence across symptoms. Clustering methods are then used to identify closely inter-connected symptoms that may, or may not, correspond to areas of difficulty commonly associated with categorical diagnoses such as ADHD or DLD. This novel approach allows us to identify where symptoms sit in the network (i.e., which symptoms sit together), and to quantify the importance of different symptoms within the network. This includes identifying bridging symptoms that have multiple strong links across problem domains/clus-ters. Symptoms linking problem domains may reflect causal processes and/or shared aetiological influences. The conceptual interpretation of bridging symptoms iden-tified in cross-sectional networks is not straightforward but one possibility is that such symptoms may spread acti-vation across the system and may be the origins of the co-morbidities observed on a dimensional level [40]. All analyses are cross-sectional, exploratory, and data-driven. However, on the basis of co-morbid symptom presenta-tions reported in the literature, it is predicted that multiple direct associations would emerge across pragmatic and behavioural difficulties (hot EFs), with additional connec-tions between everyday cognitive abilities (cool EFs) and structural language skills.
Methods Recruitment
(CALM). Children aged 5 to 18 years were referred to CALM by health and education practitioners for prob-lems in the areas of attention, learning, and/or memory. Children were accepted into the study irrespective of diagnostic status, providing they met the following inclu-sion criteria: (1) native English speaker, (2) no uncor-rected sensory impairments, and (3) no confirmed presence of genetic or neurological conditions. Full re-cruitment and testing procedures are described in the study protocol paper [41]. Children provided assent and parents/guardians provided informed written consent. Ethical approval was granted by the National Health Ser-vice (NHS) Health Research Authority NRES Committee East of England, REC approval reference 13/EE/0157.
Assessments
The current analysis is based on the parent ratings of be-haviour and communication described below. These checklists are routinely administered in health and edu-cational settings in the United Kingdom to capture the child’s natural behaviour and communication in day-to-day situations.
Brief rating inventory of executive function (BRIEF) The Behaviour Rating Inventory of Executive Function (BRIEF) [42] is a parent checklist of everyday behaviours relating to: inhibition, shifting, emotional control, initi-ation, working memory, planning/organisiniti-ation, organisa-tion of materials, and monitoring.
Conners-3
The Conners Parent Rating Short Form 3rd Edition [43] assesses ADHD-related difficulties across six subscales: inattention, hyperactivity/ impulsivity, learning prob-lems, executive functioning, aggression, and peer rela-tions. The executive functioning subscale was dropped as it was closely related to BRIEF scores (BRIEF Global Executive Score and Conners-3 EF – rs (687) = .67, p< .0001, two-tailed) and because the eight BRIEF sub-scales provide a more comprehensive assessment of EF.
Children’s communication checklist (CCC-2)
The Children’s Communication Checklist (CCC-2) [44] contains ten subscales assessing communication. Speech, syntax, semantics, and coherence measure structural com-munication skills. Inappropriate initiation, stereotyped language, use of context, and nonverbal communication address pragmatic communication. The social relations and interests scales assess communication problems com-monly observed in ASD.
Participants
Parent ratings were available for 720 children. Outlier treatment was conducted as follows: three subscale scores
were replaced with missing values due to falling ±3.5 standard deviations (SD) from the sample mean; six cases were detected as multivariate outliers based on Mahalano-bis’D2and omitted from the analyses. Characteristics of the final sample of 714 children, including diagnostic sta-tus and referral route are available in Table1.
Missing data and overly negative scores
The number of participants with complete data for each scale is presented in Table2. The network was estimated based on complete pairwise correlations to allow for the largest possible sample size (see Additional file1: Figure S1 and S2 for alternative estimations). The analyses were con-ducted with and without ratings flagged as overly negative or inconsistent by the indices provided in each scale (See Additional file 1). The inclusion of these ratings did not alter the overall conclusions. The results presented here are for the full sample.
Statistical analyses
Analyses were conducted in four steps: network estima-tion, network stability, community detecestima-tion, and network inference based on centrality indices and predictability. All
Table 1Demographics, diagnosis, and referral route
Mean (SD) Min-Max
Age (years) 9.4 (2.33) 5.17–18.58
Nmale % male
Gender 480 67%
Diagnosis Total %
None 427 59
ADHD/ADD 187 26
Learning deficit 67 9
ASD 59 8
Other 33 5
Comorbidity 65 9
Referrer Total %
SENCo 395 55.32
Specialist Teacher 16 2.24
Educational Psychologist 7 0.98
Speech & Language Therapist 32 4.48
Clinical Psychologist 30 4.20
Child Psychiatrist 9 1.26
Paediatrician 183 25.63
ADHD nurse practitioner 30 4.2
Family worker locality team 10 1.4
Private Tutor 2 0.28
analysis were performed in R [45] using the packages qgraph [46], bootnet [47], mgm [48], igraph [49], and net-worktools [50].
Network estimation
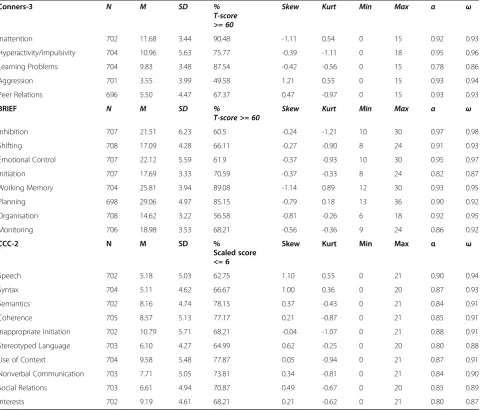
The regularised partial correlation network of the BRIEF, CCC-2, and Conner’s 3 subscales was estimated. Sub-scales had excellent to good internal consistency, sug-gesting that the items within each scale were capturing the same construct (Table2). Therefore, the analysis fo-cused on subscales’interrelations to avoid potential bias introduced by the inclusion of multiple items assessing the same construct (see [51]). The distribution of the ratings on multiple subscales deviated from normality (see Table 2for skew and kurtosis). For this reason, the
network was estimated with nonparanormal transform-ation [52]. This transformtransform-ation uses cumulative distribu-tions to transform the observed variable to the distribution of the latent normally distributed variable (for details see [52, 53]). All raw scores were trans-formed such that higher values represented more diffi-culties and were standardised to the sample mean to put them on the same scale. Age was included in the estima-tion but omitted from plots and the calculaestima-tion of the centrality indices. In the final network, each node repre-sented a subscale rating and each edge corresponded to the regularised partial correlation coefficient across the two subscales, controlling for the influence of age and all other ratings. The network was estimated using the graphical variant of the least absolute shrinkage and Table 2Descriptive statistics, reliability, and percentage of children rated as experiencing clinical levels of difficulties
Conners-3 N M SD %
T-score >= 60
Skew Kurt Min Max α ω
Inattention 702 11.68 3.44 90.48 -1.11 0.54 0 15 0.92 0.93
Hyperactivity/Impulsivity 704 10.96 5.63 75.77 -0.39 -1.11 0 18 0.95 0.96
Learning Problems 704 9.83 3.48 87.54 -0.42 -0.56 0 15 0.78 0.86
Aggression 701 3.55 3.99 49.58 1.21 0.55 0 15 0.93 0.94
Peer Relations 696 5.50 4.47 67.37 0.47 -0.97 0 15 0.93 0.93
BRIEF N M SD %
T-score >= 60 Skew Kurt Min Max α ω
Inhibition 707 21.51 6.23 60.5 -0.24 -1.21 10 30 0.97 0.98
Shifting 708 17.09 4.28 66.11 -0.27 -0.90 8 24 0.91 0.93
Emotional Control 707 22.12 5.59 61.9 -0.37 -0.93 10 30 0.95 0.97
Initiation 707 17.69 3.33 70.59 -0.37 -0.33 8 24 0.82 0.87
Working Memory 704 25.81 3.94 89.08 -1.14 0.89 12 30 0.93 0.95
Planning 698 29.06 4.97 85.15 -0.79 0.18 13 36 0.90 0.92
Organisation 708 14.62 3.22 56.58 -0.81 -0.26 6 18 0.92 0.95
Monitoring 706 18.98 3.53 68.21 -0.56 -0.36 9 24 0.86 0.92
CCC-2 N M SD %
Scaled score <= 6
Skew Kurt Min Max α ω
Speech 702 5.18 5.03 62.75 1.10 0.55 0 21 0.90 0.94
Syntax 704 5.11 4.62 66.67 1.00 0.36 0 20 0.87 0.93
Semantics 702 8.16 4.74 78.15 0.37 -0.43 0 21 0.84 0.91
Coherence 705 8.57 5.13 77.17 0.21 -0.87 0 21 0.85 0.91
Inappropriate Initiation 702 10.79 5.71 68.21 -0.04 -1.07 0 21 0.88 0.91
Stereotyped Language 703 6.10 4.27 64.99 0.62 -0.25 0 20 0.80 0.88
Use of Context 704 9.58 5.48 77.87 0.05 -0.94 0 21 0.87 0.91
Nonverbal Communication 703 7.71 5.05 73.81 0.34 -0.81 0 21 0.84 0.90
Social Relations 703 6.61 4.94 70.87 0.49 -0.67 0 20 0.85 0.89
Interests 702 9.19 4.61 68.21 0.21 -0.62 0 21 0.80 0.87
selection operator (glasso) [54] to avoid including spuri-ous edges. The best fitting model was selected based on the Extended Bayesian Information Criterion (EBIC) [55]. This method is reported to accurately retrieve the true network structure [56] and is described in detail elsewhere [47]. To ensure good specificity (including only edges that are truly present), the estimated ele-ments of the inverse variance-covariance matrix were first thresholded using a theoretical bound [57]. This procedure reflects a strong assumption of sparsity and could result in loss of sensitivity to detect small edges that are truly present. In the current sample, the mini-mum absolute edge weight in the non-thresholded net-work was 0.0007; and 0.067 in the thresholded netnet-work. The implications of this analytical decision were tested by comparing the thresholded, non-thresholded, and unregularised solutions, all of which retained acceptable similarity (see Additional file1for details).
Network stability
The robustness of the solution was scrutinised by calcu-lating bootstrapped non-parametric 95% confidence in-tervals for all edges weights, together with the percentage of bootstrapped networks (N= 2000), in which the edge was estimated as different from zero (% non-zero) [47]. Additionally, as a coarse means to assess the possibility that the network structure may vary for different diagnostic groups represented in the sample, separate networks were estimated for children with no diagnosis (N= 389, excluding those with suspected ADHD) and for those with ADHD/ADHD under investi-gation (N= 227) and compared to the network generated for the whole sample. The ADHD group was chosen as it was the largest diagnosed subgroup within the sample. Both networks retained acceptable similarity with the network estimated from the full sample (adjacency matrices correlation ADHD/ADHD under investigation: r= .86; no diagnosis: r= .92). However, these findings should be interpreted with caution as stability analysis suggested that these subsample networks were not esti-mated with sufficient accuracy due to small sample sizes (see Additional file1for details).
Community detection
Symptoms that cluster together in communities may be part of the same latent variable or dimension. The Walk-trap algorithm was applied to the network to estimate the presence of symptom clusters [58]. The algorithm recursively takes random walks between pairs of nodes to define communities as densely connected parts of the networks (where random walks get trapped). Walktrap is reported to retrieve the true generating structure across a range of conditions [58–60].
Symptom centrality and predictability
Centrality measures quantify the inter-connectedness of each node, revealing the relative importance of nodes within the network [47]. The centrality indices presented here were chosen based on correlation stability coeffi-cients (CS): indices were considered stable if at least 50% of children could be dropped while maintaining 95% prob-ability of a 0.7 correlation between the centrality indices based on the full sample and those derived from subsam-ples [53]. The case-dropping analysis (N bootstraps = 2000) suggested stable node strength (CS (cor = 0.7) = 0.69), expected influence (CS (cor = 0.7) = 0.75), and bridge strength CS (cor = 0.7) = 0.52). Strength represents the sum of all edge weights (regularised partial correla-tions) directly linked to a given node; expected influence is based on the same formula while taking negative rela-tionships into account [61]; and bridge strength represents the sum of edge weights of given node to all nodes of a different cluster. In other words, bridge strengths highlight symptoms with multiple strong conditional relationships with symptoms from other clusters. Due to the cross-sectional nature of the data, the conceptual interpretation of these metrics is unclear. One possibility is that symp-toms of high centrality may be the cause or the conse-quence of the symptoms they are related to. To ensure centrality indices are not biased by item properties such as differential variability of network nodes, the associations across node centrality measures and standard deviations was estimated. They were weak and non-significant (strength: rs= 0.23, p= 0.30; expected influence: rs= 0.22, p= 0.31; bridge strength:rs= 0.02,p= 0.92).
The predictability of individual symptoms was examined to quantify the shared variance between a given node and all of the symptoms connected to it (i.e. proportion of variance explained) [48]. The calculation of node predict-ability was based on listwise complete correlations (N= 668). The estimated predictability network was very simi-lar to the network based on pairwise complete correlations (adjacency matrix correlation:r= .93).
Results
Descriptive statistics
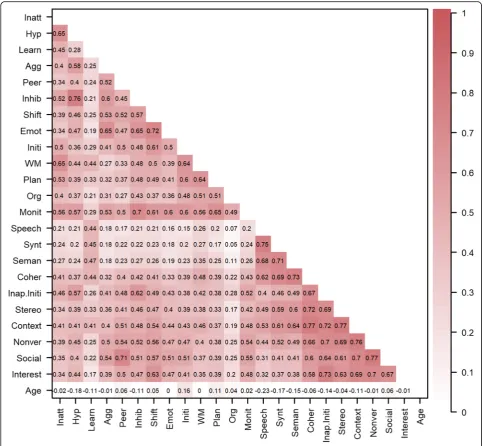
Means, SDs, and internal consistency indices (Cron-bach’s alpha and McDonald’s omega) on the basis of polychoric correlations for all untransformed measures are presented in Table2. Acceptable internal consistency was observed across all subscales. Pearson correlations across the measures are displayed in Fig.1.
Network estimation and stability
featured in the final network were included in the majority of the 2000 bootstrapped samples (Additional file 1: Figure S4). For edges discussed in the manuscript, the following information is included parentheses: edge weights, 95% bootstrapped confidence intervals for times the edge weight was not set to zero, and the percentage indicating how often the parameter was estimated as different from zero. For all other edges this information is available in (Additional file 1: Fig-ure S3-S5).
Community detection
The algorithm identified four clusters (modularity = .43) corresponding to: 1) pragmatic language and peer rela-tionships; 2) structural language and learning; 3) cogni-tive skills (cool EFs); and 4) emotional and behavioural problems (hot EFs). Notably, these clusters were interre-lated. Several direct paths were observed across prag-matic and behavioural difficulties (e.g. inappropriate initiation–hyperactivity (0.13, 95% CI [0.07–0.18], non-zero = 97%); inappropriate initiation – inhibition (0.19, Fig. 1Pearson correlations after nonparanormal transformation across all variables in the network. Darker colour reflects stronger associations. Conners-3: Inatt = Inattention; Hyp = Hyperactivity/Impulsivity; Learn = Learning Problems; Agg = Aggression; Peer = Peer Relations; BRIEF (Behaviour Rating Inventory of Executive Function): Inhib = Inhibition; Shift = Shifting; Emot = Emotional control; Initi = Initiation; WM = Working memory; Plan =
Planning/Organisation; Org = Organisation of Materials; Monit = Monitoring; CCC-2 (Children’s Communication Checklist): Synt = Syntax; Seman =
95% CI [0.12–0.26], non-zero = 100%). No direct rela-tionships were observed between cool EFs and structural language; these clusters were indirectly connected through learning.
Symptom centrality and predictability
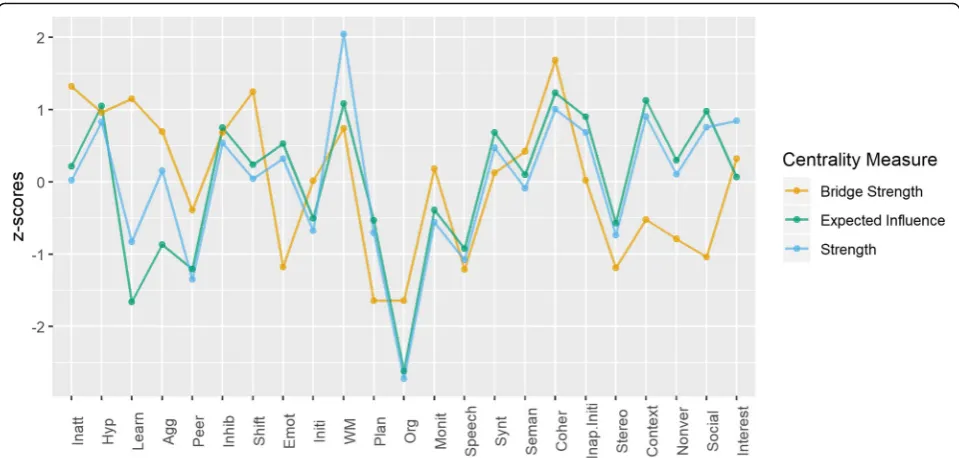
Strength, expected influence, and bridge strength central-ity are shown in Fig. 3. In the current network, working memory, coherence, use of context, and hyperactivity had the highest strength and expected influence. Coherence and shifting had the highest bridge strength (Fig. 3), reflecting multiple strong relationships with symptoms from other clusters.
Predictability analyses (Fig.2) suggested that the symp-toms explained acceptable amount of variance across the network (M= 0.66, SD= 0.10, Min= 0.36 (Organisation), Max= 0.78 (Inhibition)). A close relationship was ob-served between the network model and symptom predict-ability: if a symptom was connected to only a few other symptoms, the explained variance was lower; conversely, the more connections a symptom had, the higher the esti-mated predictability.
Discussion
Network analysis was used, for the first time, to explore the co-occurrence of symptoms commonly observed across developmental disorders such as ADHD, DLD, ASD, and reading difficulties. Inter-symptom associations across communication, behavioural, and cognitive difficul-ties were modelled in a large heterogeneous sample of children. Four empirically-derived clusters of symptoms emerged corresponding to: 1) structural language and learning; 2) pragmatic abilities and peer relations; 3) be-havioural and emotional difficulties (hot EFs); and 4) cog-nitive skills (cool EFs). Hot and cool EFs were directly related, as were structural and pragmatic language skills. Cool EFs were directly linked with learning but not with the formal use of language in communication.
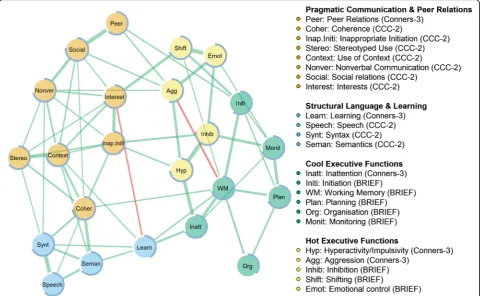
Problems with pragmatic communication and peer re-lationships were directly connected to emotional and be-havioural difficulties (hot EFs). In turn, bebe-havioural difficulties were directly related to cool EFs. This was manifested in the high bridge centrality rankings of shift-ing and hyperactivity, both of which were in the hot EFs cluster. Their centrality in the network reflected associa-tions with symptoms in the pragmatic communication Fig. 2The network of behavioural and communication problems in children struggling at school. The thickness of an edge corresponds to the magnitude of the partial correlation between two nodes after adjusting for all other nodes in the network. Green edges depict positive associations and red edges depict negative associations. The node colours correspond to the clusters identified by the Walktrap algorithm. The blue ring around each node corresponds to the proportion of variance explained. BRIEF = Behaviour Rating Inventory of Executive Function;
cluster (e.g. hyperactivity–inappropriate initiation (0.13, 95% CI [0.07–0.18], non-zero = 97%); shifting–interests (0.27, 95% CI [0.22–0.34], non-zero = 100%) and the cognitive skills cluster (e.g. hyperactivity – inattention (0.36, 95% CI [0.31–0.44], non-zero = 100%); shifting – working memory (0.09, 95% CI [0.07–0.16], non-zero = 69%). These findings are consistent with hypotheses sug-gesting that social communication difficulties can arise as a downstream consequence of hyperactive-impulsive behaviours that are themselves underpinned by poor cool EFs [35]. The network structure cannot provide evi-dence for the direction of these associations, but the ob-served paths may imply that cool EFs (e.g. inattention, working memory) may not directly influence peer rela-tions and pragmatic skills, but can lead to difficulties in these domains via the activation of behavioural problems (e.g. hyperactivity, shifting) [37,62].
Contrary to expectations, structural language skills and cool EFs were not directly linked. It has been previ-ously reported that cool EFs such as verbal short-term and working memory underpin language development [63]. However, no such links were found in the network. One possibility is that the development of structural communication skills is constrained by phonological processing, which was not included in the current study, and not by executive function [25, 64]. Links between both clusters and learning may reflect how cognitive def-icits (e.g. working memory, inattention) and structural
language skills (e.g. syntax, semantics) limit learning in different ways. Language impairments arising from phonological difficulties might be more closely related to literacy problems [25], with cool EF problems impacting on broader aspects of learning [32]. An alternative possi-bility is that cool EF deficits constrain learning, and this impairs the acquisition of structural language abilities [31]. It is further possible that the direct associations were not observed due to potential poor specificity of the regularisation methods used.
Multiple direct paths linked the structural and prag-matic communication clusters, but their associations with other symptoms in the network differed. This sup-ports the view that these dimensions of communication are linked but could have distinct origins [65]. As sug-gested in the network, impairments in pragmatic lan-guage may arise through both structural lanlan-guage problems [66] and social/behavioural difficulties [67]. Structural language abilities appear to be more closely tied to learning, and indirectly to cool EFs.
Centrality indices highlighted important roles for working memory, language coherence, and the appropri-ate use of context in communication. Working memory and language coherence had multiple connections both within and outside their own clusters. Symptoms with multiple connections across problem areas may poten-tially interact with other areas of difficulty and may be the origin/consequence of co-occurrences [40]. Working Fig. 3Centrality indices bridge strength, strength, and expected influence across all measures in the network. Conners-3: Inatt = Inattention; Hyp = Hyperactivity/Impulsivity; Learn = Learning Problems; Agg = Aggression; Peer = Peer Relations; BRIEF (Behaviour Rating Inventory of Executive Function): Inhib = Inhibition; Shift = Shifting; Emot = Emotional control; Initi = Initiation; WM = Working memory; Plan = Planning/
Organisation; Org = Organisation of Materials; Monit = Monitoring; CCC-2 (Children’s Communication Checklist): Synt = Syntax; Seman = Semantics;
memory bridged the cool EF and structural language clusters via learning (0.12, 95% CI [0.10–0.19], non-zero = 76%). The role of working memory in learning is well-established [68]. Working memory also linked the cool EF and pragmatic clusters via coherence (0.11, 95% CI [0.07–0.16], non-zero = 93%), and shared direct paths with hot EFs (shifting: 0.09, 95% CI [0.07–0.16], non-zero = 69%). Working memory did not rank highest on bridge strength, but its highest overall strength and ex-pected influence, together with its direct associations with all symptoms within the cool EFs cluster and direct links with symptoms from all other clusters, provide evi-dence about its potential role as an area of difficulty that may spread activation across the network. Although causal conclusions on the basis of correlational network models are not warranted, working memory is important for holding information in mind, focusing attention, and ignoring distractions. This may explain how impair-ments activate difficulties in other problem areas such as producing coherent speech/narratives and shifting on to novel activities. Considering working memory as a trans-diagnostic risk factor for developmental disorders fits with data from the mental health field [69].
Coherence in communication (pragmatic abilities and peer relations cluster) was associated with all three symptoms of structural communication (edge weights range: 0.08–0.28, non-zero range: 70–100%) and four symptoms in its own cluster (edge weights range: 0.07– 0.19, non-zero range: 72–100%). Poor language coher-ence may therefore activate, or be the consequcoher-ence of, multiple other communication problems. In contrast, the high centrality of the use of context when communi-cating reflected multiple links within the pragmatics and peer relations cluster (edge weights range: 0.09–0.23, non-zero range: 90–100%) and a single association with the structural cluster (semantics: 0.12, 95% CI [0.07– 0.17], non-zero = 97%). Symptoms with strong connec-tions in the same cluster may be core symptoms of this problem area [40]. Consistent with this, the appropriate use and interpretation of language in relation to context is central to the definition of pragmatics, and difficulties in this specific ability are reported to differentiate across children with primarily structural versus pragmatic diffi-culties [70].
Limitations & future directions
There are several limitations to this study. First, the symptom relationships identified are based on parent ratings that are designed to capture aspects of function-ing distinct from those measured in lab-based assess-ments of cognition [71]. Parent ratings provide ecologically valid assessments of children’s day-to-day functioning across different situations [71], but are known to be subject to reporter bias. To test whether
bias affected the results, the current analyses were con-ducted both including and excluding reports flagged as overly negative or inconsistent. The overall pattern of re-sults did not differ between analyses, indicating that such reporter bias is unlikely to be the cause of the over-all network. In addition, the identification of clusters of symptoms that align with theoretical constructs provides further validation that the ratings were meaningful as they effectively distinguished between different aspects of functioning. It will be interesting to explore whether a similar network structure emerges with objective assess-ments of language, behaviour, and cognition.
The communities of symptoms identified depend on the chosen community detection algorithm and the stability of the input network. The algorithm applied here is re-ported to identify network communities with an accept-able level of accuracy, and the input network was staccept-able in terms of the strength and number of connections across symptoms. Furthermore, the problem areas present in the network map on to broad latent constructs identified in previous studies of these comorbidities [3], suggesting some level of agreement across methods.
The heterogeneous nature of the sample was suited for investigating the possibility of transdiagnostic symptom-level associations across comorbid difficulties. Nonetheless, it is also possible that disorder-specific as-sociations may have been masked by combing multiple diagnostic groups. The current study was too small in size to formally test this possibility, but coarse checks based on comparing a network for the largest diagnostic group in the sample (those with ADHD) to a network based on the full sample showed acceptable correspond-ence. An important direction for future research will be to compare networks both within and across diagnoses.
functioning. The incorporation of neurological, genetic, and environmental factors into network models is an-other important step that could provide important in-sights about the origins of comorbidities and their potential dynamic interactions.
Conclusion
The co-occurrence of pragmatic communication and be-havioural problems was observed in a large heteroge-neous sample of children with a broad range of difficulties. This suggests these comorbidities extend be-yond specific diagnostic groups (e.g. ADHD, ASD). On a practical level, these findings highlight the importance of considering potential language and communication problems among children presenting with difficult be-haviour, and vice versa.
Pragmatic communication skills might be indirectly in-fluenced by cognitive skills through mediating role of be-havioural regulation. In line with this, working memory and was identified as a bridging symptom, suggesting it may spread difficulties across different domains of func-tioning. Working memory, inattention, and structural language difficulties, were associated with learning, in line with many previous reports.
The data presented here provide one of the first large-scale applications of network modelling to symptoms as-sociated with a range of developmental disorders. Akin to developments in psychiatry, this investigation suggests that there might be utility in shifting away from concep-tualising developmental disorders as nosological entities. Transdiagnostic approaches can enable the discovery of shared liabilities and are suited for investigating the pos-sibility that different developmental difficulties may cause one another: each problem may be the starting point for the activation of other symptoms. Using net-work modelling to conceptualise developmental comor-bidities as arising in dynamic causal systems can provide insights into the nature of these comorbidities and may help researchers and clinicians to formulate specific hy-potheses about potential causal mechanisms and inter-vention strategies.
Supplementary information
Supplementary informationaccompanies this paper athttps://doi.org/10. 1186/s12887-019-1818-7.
Additional file 1: Figure S1.Correlation across the adjacency matrices derived from networks estimated with norm-referenced (nrm.), raw, and sample-centred standardised scores (std.) with (trns.) /without (non-trns.) nonparanormal transformation based on listwise (list)/pairwise (pair) correlations. The final two matrices are derived from a networks estimated without thresholding (no-thr.) and without regularisation (unrg), respectively. The network presented in the manuscript is based on sample-centred scores, applying nonparanormal transformation and thresholding, and using pairwise correlations (std.trns.pair).Figure S2. Centrality measures strength and expected influence across the subscales
of Conners-3, BRIEF (Behaviour Rating Inventory of Executive Function), and CCC-2 (Children’s Communication Checklist-2) estimated from unregularised, regularised thresholded, and regularised non-thresholded
networks.Figure S3.The estimated cross-symptom edge weights are
represented by the red dots and the means of the bootstrapped edge weights are represented by the black dots. The corresponding bootstrap
confidence intervals indicate the edge weight accuracy.Figure S4.The
upper triangle represents estimated edge weights, where darker shades correspond to stronger edge weights. The values in the lower triangle represent how often an edge was estimated to be non-zero in the 2000
bootstraps.Figure S5.The estimated cross-symptom edge weights are
represented by the red dots and the means of the bootstrapped edge weights are represented by the black dots. The width of the lines corre-sponds to 95% confidence intervals only for the times the parameter was not set to zero. The transparency of the intervals shows how often an edge was included. Lighter lines indicate that the edge was frequently
set to zero.Figure S6.The estimated cross-symptom edge weights are
represented by the red dots and the means of the bootstrapped edge weights are represented by the black dots. The corresponding bootstrap confidence intervals indicate the edge weight accuracy.
Abbreviations
ADHD:Attention deficit hyperactivity disorder; ASD: Autism Spectrum Disorder; BRIEF: Behaviour Rating Inventory of Executive Function;
CCC-2: Children’s Communication Checklist; DLD: Developmental Language
Disorder; EF: Executive Function
Acknowledgements
The Centre for Attention Learning and Memory (CALM) research clinic is based at and supported by funding from the MRC Cognition and Brain Sciences Unit (CBSU), University of Cambridge. The lead investigators are Joni Holmes, Susan Gathercole, Duncan Astle, Tom Manly, Kate Baker, and Rogier Kievit. Data collection is assisted by a team of researchers and PhD students at the CBSU that includes Joe Bathelt, Giacomo Bignardi, Sarah Bishop, Erica Bottacin, Lara Bridge, Annie Bryant, Sally Butterfield, Elizabeth Byrne, Gemma Crickmore, Fánchea Daly, Tina Emery, Laura Forde, Delia Fuhrmann, Andrew Gadie, Sara Gharooni, Jacalyn Guy, Erin Hawkins, Agniezska Jaroslawska, Amy Johnson, Elise Ng-Cordell, Sinéad O’Brien, Cliodhna O’Leary, Joseph Rennie, Ivan Simpson-Kent, Roma Siugzdaite, Tess Smith, Stepheni Uh, Francesca Woolgar, and Mengya Zhang. The authors wish to thank the many professionals working in children’s services in the South-East and East of England for their support, and to the children and their families for giving up their time to visit the clinic.
Authors’contributions
JH and SM conceptualised the study. The CALM team collected and processed the data. SM analysed the data. JH and SM interpreted the results and drafted the manuscript. All authors read and approved the final manuscript.
Funding
This research was funded by intramural funding awarded to the Cognition and Brain Sciences Unit by the Medical Research Council, UK. The funding body approved the setup of the CALM research clinic. The funders had no role in the study design, analysis and interpretation of data, or in writing the manuscript.
Availability of data and materials
The dataset generated and analysed during the current study has not been made publicly available yet as the study is still ongoing. The data will be made publically available via managed open access once the study is complete. Analysis scripts are available from the corresponding author upon request.
Ethics approval and consent to participate
Consent for publication
Not applicable. Identifiable data from individual participants is not available. All participants have consented to the publication of anonymised data.
Competing interests
The authors declare that they have no competing interests.
Received: 11 June 2019 Accepted: 31 October 2019
References
1. Ketelaars MP, Cuperus J, Jansonius K, Verhoeven L. Pragmatic language impairment and associated behavioural problems. Int J Lang Commun Disord. 2010;45:204–14.
2. Loe IM, Feldman HM. Academic and educational outcomes of children with
ADHD. J Pediatr Psychol. 2007;32:643–54.
3. Hawkins E, Gathercole S, Astle D, Holmes J. Language problems and ADHD
symptoms: how specific are the links? Brain Sci. 2016;6:15–7.
4. Pimperton H, Nation K. Poor Comprehenders in the classroom: teacher
ratings of behavior in children with poor Reading comprehension and its relationship with individual differences in working memory. J Learn Disabil. 2014;47:199–207.
5. Lui M, Tannock R. Working memory and inattentive behaviour in a
community sample of children. Behav Brain Funct. 2007;3:12. 6. Faraone SV, Biederman J, Weber W, Russell RL. Psychiatric,
neuropsychological, and psychosocial features of DSM-IV subtypes of attention-deficit/hyperactivity disorder: results from a clinically referred sample. J Am Acad Child Adolesc Psychiatry. 1998;37:185–93.
7. Willcutt EG, Pennington BF. Comorbidity of Reading disability and attention-deficit/ hyperactivity disorder. J Learn Disabil. 2000;33:179–91.
8. Kessler RC, Ph D, Adler L, Barkley R, Biederman J, Conners CK, et al. The prevalence and correlates of adult ADHD in the United States : results from the National Comorbidity Survey Replication. Am J Psychiatry. 2006;163:716–23. 9. Coghill D, Sonuga-Barke EJSS. Annual research review: categories versus
dimensions in the classification and conceptualisation of child and adolescent mental disorders - implications of recent empirical study. J Child Psychol Psychiatry. 2012;53:469–89.
10. Kotov R, Waszczuk MA, Krueger RF, Forbes MK, Watson D, Clark LA, et al. The hierarchical taxonomy of psychopathology (HiTOP): a dimensional alternative to traditional nosologies. J Abnorm Psychol. 2017;126:454–77. 11. Rommelse NNJJ, Geurts HM, Franke B, Buitelaar JK, Hartman CA. A review
on cognitive and brain endophenotypes that may be common in autism spectrum disorder and attention-deficit/hyperactivity disorder and facilitate the search for pleiotropic genes. Neurosci Biobehav Rev. 2011;35:1363–96. 12. Duinmeijer I, De Jong J, Scheper A. Narrative abilities, memory and
attention in children with a specific language impairment. Int J Lang Commun Disord. 2012;47:542–55.
13. Germanò E, Gagliano A, Curatolo P. Comorbidity of ADHD and dyslexia. Dev Neuropsychol. 2010;35:475–93.
14. Cuthbert BN, Insel TR. Toward the future of psychiatric diagnosis: the seven pillars of RDoC. BMC Med. 2013;11:126.
15. Owen MJ. New approaches to psychiatric diagnostic classification. Neuron. 2014;84:564–71.
16. R-Mercier A, Masson M, Bussières EL, Cellard C. Common transdiagnostic cognitive deficits among people with psychiatric disorders exposed to childhood maltreatment: a meta-analysis. Cogn Neuropsychiatry. 2018;23: 180–97.
17. Reininghaus U, Böhnke JR, Chavez-Baldini UY, Gibbons R, Ivleva E, Clementz BA, et al. Transdiagnostic dimensions of psychosis in the bipolar-schizophrenia network on intermediate phenotypes (B-SNIP). World Psychiatry. 2019;18:67–76.
18. Titov N, Dear BF, Schwencke G, Andrews G, Johnston L, Craske MG, et al. Transdiagnostic internet treatment for anxiety and depression: a randomised controlled trial. Behav Res Ther. 2011;49:441–52. 19. Casey BJ, Oliveri ME, Insel T. A neurodevelopmental perspective on the
research domain criteria (RDoC) framework. Biol Psychiatry. 2014;76:350–3. 20. Snowling MJ, Hulme C. Annual research review: the nature and classification
of reading disorders - a commentary on proposals for DSM-5. J Child Psychol Psychiatry Allied Discip. 2012;53:593–607.
21. Sonuga-Barke EJS, Coghill D. The foundations of next generation attention-deficit/hyperactivity disorder neuropsychology: building on progress during the last 30 years. J Child Psychol Psychiatry Allied Discip. 2014;55:e1–5. 22. Sonuga-Barke EJS, Cortese S, Fairchild G, Stringaris A. Annual research
review: Transdiagnostic neuroscience of child and adolescent mental disorders - differentiating decision making in attention-deficit/hyperactivity disorder, conduct disorder, depression, and anxiety. J Child Psychol Psychiatry Allied Discip. 2016;57:321–49.
23. Zhao Y, Castellanos FX. Annual research review: discovery science strategies in studies of the pathophysiology of child and adolescent psychiatric disorders - promises and limitations. J Child Psychol Psychiatry Allied Discip. 2016;57:421–39.
24. Kotov R, Krueger RF, Watson D, Achenbach TM, Althoff RR, Michael Bagby R, et al. The hierarchical taxonomy of psychopathology (HiTOP): a dimensional alternative to traditional Nosologies. Association. 2017;126:454–77. 25. Ramus F, Marshall CR, Rosen S, van der Lely HKJJ. Phonological deficits in
specific language impairment and developmental dyslexia: towards a multidimensional model. Brain. 2013;136:630–45.
26. Martel MM, Von Eye A, Nigg JT. Revisiting the latent structure of ADHD: is there a‘g’factor? J Child Psychol Psychiatry Allied Discip. 2010;51:905–14.
27. Cramer AOJ, Waldorp LJ, van der Maas HLJ, Borsboom D. Comorbidity: a
network perspective. Behav Brain Sci. 2010;33:137–50.
28. Kendler KS, Zachar P, Craver C. What kinds of things are psychiatric disorders? Psychol Med. 2011;41:1143–50.
29. Leonard MA, Milich R, Lorch EP. The role of pragmatic language use in mediating the relation between hyperactivity and inattention and social skills problems. J Speech Lang Hear Res. 2011;54:567–79.
30. Henry LA, Messer DJ, Nash G. Executive functioning in children with specific language impairment. J Child Psychol Psychiatry. 2012;53:37–45.
31. Korrel H, Mueller KL, Silk T, Anderson V, Sciberras E. Research review: language problems in children with attention-deficit hyperactivity disorder - a systematic meta-analytic review. J Child Psychol Psychiatry. 2017;58:640–54.
32. Yeniad N, Malda M, Mesman J, van IJzendoorn MH, Pieper S. Shifting ability predicts math and reading performance in children: a meta-analytical study. Learn Individ Differ. 2013;23:1–9.
33. Holmes J, Hilton KA, Place M, Alloway TP, Elliott JG, Gathercole SE. Children with low working memory and children with ADHD: same or different? Front Hum Neurosci. 2014;8:976.
34. Castellanos FX, Sonuga-Barke EJSS, Milham MP, Tannock R. Characterizing cognition in ADHD: beyond executive dysfunction. Trends Cogn Sci. 2006; 10:117–24.
35. Green BC, Johnson KA, Bretherton L. Pragmatic language difficulties in children with hyperactivity and attention problems : an integrated review. Int J Lang Commun Disord. 2014;49:15–29.
36. Nilsen ES, Varghese A, Xu Z, Fecica A. Children with stronger executive functioning and fewer ADHD traits produce more effective referential statements. Cogn Dev. 2015;36:68–82.
37. Rints A, Mcauley T, Nilsen ES. Social communication is predicted by inhibitory ability and ADHD traits in preschool-aged children. J Atten Disord. 2014;19:901–11.
38. Petersen IT, Bates JE, Dodge KA, Lansford JE, Pettit GS. Describing and predicting developmental profiles of externalizing problems from childhood to adulthood. Dev Psychopathol. 2015;27:791–818.
39. Botting N, Jones A, Marshall C, Denmark T, Atkinson J, Morgan G. Nonverbal executive function is mediated by language: a study of deaf and hearing children. Child Dev. 2017;88:1689–700.
40. Blanken TF, Deserno MK, Dalege J, Borsboom D, Blanken P, Kerkhof GA, et al. The role of stabilizing and communicating symptoms given overlapping communities in psychopathology networks. Sci Rep. 2018;8: 5854.
41. Holmes J, Bryant A, Gathercole SE. Protocol for a transdiagnostic study of children with problems of attention, learning and memory (CALM). BMC Pediatr. 2019;19:10.
42. Gioia GA, Isquith PK, Guy SC, Kenworthy L. Behavior rating inventory of executive function: BRIEF. Odessa: Psychological Assessment Resources; 2000.
43. Conners CK. Conners 3rd edition (Conners 3). Third Edit. Ontario: Multi-Health Systems Toronto; 2008.
45. R Core Team. R: A language and environment for statistical computing. 2017;https://www.R-project.org/.
46. Epskamp S, Cramer AOJ, Waldorp LJ, Schmittmann VD, Borsboom D. qgraph
: Network Visualizations of Relationships in Psychometric Data. J Stat Softw. 2012;48.https://doi.org/10.18637/jss.v048.i04.
47. Epskamp S, Borsboom D, Fried EI. Estimating psychological networks and their accuracy: a tutorial paper. Behav Res Methods. 2018;50:195–212.
48. Haslbeck JMB, Waldorp LJ. MGM: Estimating Time-Varying Mixed Graphical
Models in High-Dimensional Data. JSS J. Stat. Softw. 2015.http://arxiv.org/ abs/1510.06871.
49. Csardi G, Nepusz T. The igraph software package for complex network research. InterJournal Complex Sy. 2006;1695:1–9.
50. Jones PJ. networktools: Tools for Identifying Important Nodes in Networks version 1.2.0 from CRAN. 2018.https://rdrr.io/cran/networktools/. 51. Fried EI, Cramer AOJ. Moving forward: challenges and directions for
psychopathological network theory and methodology. Perspect Psychol Sci. 2017;12:999–1020.
52. Liu H, Lafferty J, Wasserman L. The nonparanormal: Semiparametric estimation of high dimensional undirected graphs. J Mach Learn Res. 2009;10:2295–328. 53. Epskamp S, Fried EI. A tutorial on regularized partial correlation networks.
Psychol Methods. 2018;23:617–34.
54. Friedman J, Hastie T, Tibshirani R. Sparse inverse covariance estimation with the graphical lasso. Biostatistics. 2008;9:432–41.
55. Chen J, Chen Z. Biometrika trust extended Bayesian information criteria for model selection with large model spaces. Source Biometrika Biometrika Trust. 2008;95:759–71.
56. Foygel R, Drton M. Extended Bayesian Information Criteria for Gaussian Graphical Models. Adv Neural Inf Process Syst. 2010;23:604–612. 57. Jankova J, van de Geer S. Inference in high-dimensional graphical models.
In: Handbook of graphical models (ed). Boca Raton: Handbook of graphical models; 2018.
58. Pons P, Latapy M. Computing communities in large networks using random
walks. J Graph Algorithms Appl. 2006;10:191–218.
59. Gates KM, Henry T, Steinley D, Fair DA. A Monte Carlo evaluation of weighted community detection algorithms. Front Neuroinform. 2016;10:45. 60. Golino HF, Epskamp S. Exploratory graph analysis: a new approach for
estimating the number of dimensions in psychological research. PLoS One. 2017;12:e0174035.
61. Robinaugh DJ, Millner AJ, McNally RJ. Identifying highly influential nodes in the complicated grief network. J Abnorm Psychol. 2016;125:747–57. 62. Holmes CJ, Kim-Spoon J, Deater-Deckard K. Linking executive function and
peer problems from early childhood through middle adolescence. J Abnorm Child Psychol. 2016;44:31–42.
63. Archibald LMD, Gathercole SE. Short-term and working memory in specific language impairment. Int J Lang Commun Disord. 2006;41:675–93. 64. Melby-Lervåg M, Lyster S-AH, Hulme C. Phonological skills and their role in
learning to read: a meta-analytic review. Psychol Bull. 2012;138:322–52. 65. Bishop DV. Pragmatic language impairment: A correlate of SLI, a distinct
subgroup, or part of the autistic continuum. In: Seech and language impairments in children. Hove,UK: Psychology press; 2014. p. 99–112. 66. Redmond SM, Rice ML. The Socioemotional Behaviors of Children With SLI: Social
Adaptation or Social Deviance? J Speech, Lang Hear Res JSLHR. 1998;41:1092. 67. Staikova E, Gomes H, Tartter V, McCabe A, Halperin JM. Pragmatic deficits
and social impairment in children with ADHD. J Child Psychol Psychiatry. 2013;54:1275–83.
68. Gathercole SE, Pickering SJ, Knight C, Stegmann Z. Working memory skills and educational attainment: evidence from national curriculum assessments at 7 and 14 years of age. Appl Cogn Psychol. 2004;18:1–16.
69. Huang-Pollock C, Shapiro Z, Galloway-Long H, Weigard A. Is poor working memory a Transdiagnostic risk factor for psychopathology? J Abnorm Child Psychol. 2017;45:1477–90.
70. Bishop D, Baird G. Parent and teacher report of pragmatic aspects of communication: use of the Children’s communication checklist in a clinical setting. Dev Med Child Neurol. 2001;43:809.
71. Toplak ME, West RF, Stanovich KE. Practitioner review: do performance-based measures and ratings of executive function assess the same construct? J Child Psychol Psychiatry Allied Discip. 2013;54:131–43.
Publisher’s Note