Geocoding and Stereoscopy
Synthetic Aperture Radar Images
A T hesis s u b m itte d for th e degree of D o c t o r o f P h i l o s o p h y in th e U niversity of L ondon by
C h r i s t i n e C l a r k U niversity College London
ProQuest Number: 10797778
All rights reserved
INFORMATION TO ALL USERS
The qu ality of this repro d u ctio n is d e p e n d e n t upon the q u ality of the copy subm itted.
In the unlikely e v e n t that the a u th o r did not send a c o m p le te m anuscript and there are missing pages, these will be note d . Also, if m aterial had to be rem oved,
a n o te will in d ica te the deletion.
uest
ProQuest 10797778
Published by ProQuest LLC(2018). C op yrig ht of the Dissertation is held by the Author.
All rights reserved.
This work is protected against unauthorized copying under Title 17, United States C o d e M icroform Edition © ProQuest LLC.
ProQuest LLC.
789 East Eisenhower Parkway P.O. Box 1346
A b stra c t
T his thesis is concerned w ith th e geocoding of S ynthetic A p e rtu re R adar (SAR) im ages and th e use of stereo SA R im ages. T he work was carried o u t as p a r t of the p rep a ra tio n for th e launch of th e ERS-1 satellite, due in July 1991, which will carry a SA R sensor.
T here are two basic approaches to geocoding: im age-to-object and object-to-im age. B o th of these m ethods have been analysed and assessed on experim ental d a ta , nam ely SIR-B im agery of M ount S hasta. Each ty p e of geocoding requires the solution of non linear equations. It has been shown th a t if the p aram eters which control th e geocoding process are given to a good degree of accuracy, each m ethod can give good results. T he effect of inaccuracies in the estim ation of these param eters has also been analysed. It was found th a t there was a predom inantly linear response to p a ra m ete r error in b o th types of geocoding.
E x perim ental investigations into the effects of the resam pling, inherent in operatio n al geocoding, showed th a t the sta tistic a l properties of the resulting im age may be severely cor ru p te d w ith pixel values of less th a n zero being obtained. T his discovery has subsequently been given theoretical su p p o rt.
Height can be determ ined from stereo pairs of im ages and digital elevation m odels can th u s be produced, aiding b o th geocoding and topographic m apping. E xisting approaches to S A R /S A R stereo all ap p ear to be based on photogram m etric m ethods. An altern ativ e, an alytic approach, believed to be novel, is described and applied to th e sam e M ount S h asta im agery. Using this m ethod, w ith accurately-know n controlling p aram eters, correspondence w ith ground d a ta is excellent. However, an analysis of th e sensitivity of th e approach to inaccuracies in th e controlling p a ra m ete rs shows th a t th e m ethod is extrem ely sensitive to error.
T he possibility of com bining SA R and o p tic a l/in frare d im agery for stereom etric
C ontents
1 I n tr o d u c tio n 19
1.1 G e o c o d in g ... 21
1.2 S te r e o s c o p y ... 22
1.3 A vailable Im age D a t a ... 23
1.4 W ork of this T h e s is ... 24
1.5 Scope of this T h e s i s ... ‘... 27
2 P r in c ip le s o f S A R I m a g in g a n d P r o c e s s in g 28 2.1 I n tr o d u c tio n ... 28
2.2 Basic P r in c ip le s ... 29
2.2.1 SA R Basic Block D ia g ra m ... 32
2.2.2 R esolution of C onventional R a d a r ... 34
2.2.3 S to p -S ta rt A p p ro x im a tio n ... 39
2.2.4 P R F L i m i t s ... 39
2.2.5 Focussed and Unfocussed S A R ... 41
2.3 P ro p e rtie s of SA R d a t a ... 41
2.3.1 A n te n n a Sidelobes and In te g rate d Range A m biguity N o is e ... 41
2.3.2 R ange M i g r a t i o n ... 43
2.3.3 A ttitu d e E r r o r s ... 45
2.3.4 E a rth R o ta tio n E ffe c ts ... 46
2.3.5 O rb it E c c e n t r i c i t y ... 47
2.3.6 A tm ospheric E f f e c t s ... 47
2.3.7 C lu tterlo ck in g /D o p p ler T r a c k i n g ... 47
2.4 Noise C o n s id e ra tio n s ... 47
8 C O N T E N T S
2.4.1 S p e c k l e ... 48
2.4.2 T he R adar E q u a t i o n ... 48
2.5 SA R P ro c e s s in g ... 52
2.5.1 Pulse C o m p re s s io n ... 54
2.5.2 M atched Filtering ... 56
2.5.3 Doppler B lo c k in g ... 58
2.6 SAR P ro c e s s o rs ... 59
2.7 S u m m a r y ... 62
3 S A R G e o c o d in g T ech n iq u es 64 3.1 I n tr o d u c tio n ... 64
3.2 SA R Im age C o n s i d e r a t io n s ... 65
3.3 G eocoding A lg o r ith m s ... 66
3.3.1 Polynom ial M e t h o d s ... 66
3.3.2 P aram etric M e t h o d s ... 67
3.3.3 SAR Processor-B ased M e t h o d s ... 71
3.3.4 D isc u ssio n ... 73
3.4 G eocoding Using SAR Processor-B ased M e t h o d s . . . 74
3.4.1 Im age-to-O bject G e o c o d in g ... 75
3.4.2 Ite ratio n S ta rt Position: Im age-to-O bject G eocoding using NEXTPOINT 79 3.4.3 O bject-to-Im age G e o c o d in g ... 82
3.4.4 Ite ratio n S ta rt Position: O bject-to-Im age G e o c o d in g ... 85
3.4.5 Iterativ e P r o c e d u r e ... 86
3.5 E rro r C o n s id e ra tio n s ... 87
3.5.1 V ariation of T arget Velocity w ith H e ig h t... 89
3.6 T h e E R S-1 M is s io n ... 91
3.7 ER S-1 E rro r B u d g e t ... 94
3.8 R esam pling and R adiom etric C o n sid e ra tio n s... 97
3.9 C o m p u tatio n a l A s p e c t s ...101
3.10 S u m m a r y ...102
C O N T E N T S 9
4.2 R a d a r Height D eterm ination: P h o to g ra m m e tric A p p r o a c h ... 108
4.3 R a d a r H eight D eterm ination: A nalytic A p p r o a c h ... 113
4.4 S A R /O p tic a l H eight D eterm in atio n : P h o to g ra m m e tric A p p r o a c h ... 115
4.5 S A R /O p tic a l H eight D eterm ination: G eom etric A p p r o a c h ...116
5 O r b it, T im e a n d R e f e r e n c e S y s t e m C o n sid e r a tio n s 120 5.1 I n tr o d u c tio n ... 120
5.2 T im e and Reference S y s t e m s ... 120
5.3 O r b i t s ... 124
5.3.1 C alculation of O rb ita l P a r a m e t e r s ... 125
5.3.2 C alculation of O rb ita l P o s i t i o n ... 126
5.4 S u m m a r y ...128
6 A s s e s s m e n t o f S I R -B M o u n t S h a s ta I m a g e s 129 6.1 I n tr o d u c tio n ... 129
6.2 P relim inary A ssessm ent of Im age D a t a ... 129
6.3 D etailed A n a ly s is ... 141
6.4 S um m ary ...157
7 G e o c o d in g U s in g S I R -B M o u n t S h a s ta I m a g e r y 158 7.1 I n tr o d u c tio n ...158
7.2 Im age-to-O bject G e o c o d i n g ... 159
7.2.1 Im ag e-to -O b ject G eocoding: E x a c t D a ta A n a l y s i s ...159
7.2.2 Im ag e-to -O b ject G eocoding: D oppler E rro r A n a l y s is ...167
7.2.3 Im ag e-to -O b ject G eocoding: N ear-R ange E rro r A n a ly s is ...167
7.2.4 Im ag e-to -O b ject G eocoding: A verage D a ta A n a l y s i s ...174
7.3 O b ject-to-Im age G e o c o d i n g ... 175
7.3.1 O b ject-to-Im age G eocoding: E x a c t D a ta A n a l y s i s ... 175
7.3.2 O b ject-to-Im age G eocoding: D oppler E rro r A n a l y s is ...177
7.3.3 O bject-to -Im ag e G eocoding: N ear-R ange E rro r A n a ly s is ...183
7.3.4 O bject-to -Im ag e G eocoding: A verage D a ta A n a l y s i s ...187
7.4 S u m m ary of G eocoding R e s u l t s ... 187
10 C O N T E N T S
7.4.2 O bject-to-Im age G e o c o d in g ...188
7.5 C om parison w ith E rror B u dget . ' ... 189
8 S A R S te r e o U s in g S IR -B M o u n t S h a s ta Im a g e r y 191 8.1 I n tr o d u c tio n ... 191
8.2 SIR-B Stereo: E x a c t D a ta A n a ly s is ... 191
8.3 SIR-B Stereo: D oppler E rro r A n a l y s i s ... 192
8.4 SIR-B Stereo: N ear-R ange E rro r A n a l y s i s ... 200
8.5 SIR-B Stereo: Average D a ta A n a l y s i s ... 203
8 .6 S u m m a r y ... 207
8.7 C om parison w ith L eberl’s R e s u lts ... 208
List of Figures
2.1 G eom etry of SAR Im a g in g ... 29
2/2 C o o rd in ate system for SAR im age form ation ... 30
2.3 C o n stru ctio n of a SAR. im age of a point ta rg e t by phase c o r r e c tio n ... 31
2.4 Simplified SA R block d ia g r a m ... 33
2.5 G eom etry of a synthetic a p e rtu re array ... 37
2.6 D oppler history of a. point targ e t ... 38
2.7 A n ten n a rad iatio n at t r a n s m i s s i o n ... 42
2.8 Range walk and c u r v a t u r e ... 45
2.9 C urves of co n stan t Doppler for an orbital S A R ... 46
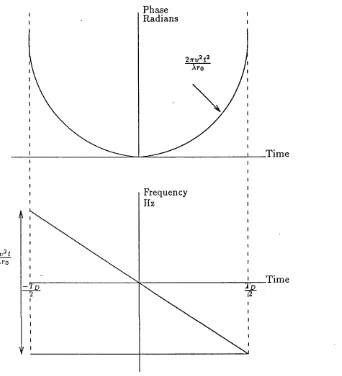
2.10 P hase and frequency excursions of a single p o in t on the g r o u n d ... 53
2.11 T ra n sm itted waveform of an LFM p u l s e ... 55
2.12 Received waveform of th e FM pulse and sub seq u en t pulse com pression . . . 56
2.13 Simplified SA R Processing P rocedure ... 61
2.14 A Frequency-D om ain P r o c e s s o r ... 62
3.1 G eom etric D istortions Due to T errain Elevation Effects ... 65
3.2 Flow chart of R a d a r Im age G eocoding M e t h o d s ... 68
3.3 S e n so r/G ro u n d G e o m e t r y ... 75
3.4 Im age-to-O bject G eocoding — Schem atic V i e w ... 77
3.5 Ite ra tio n S ta rt Position using NEXTPOINT... 81
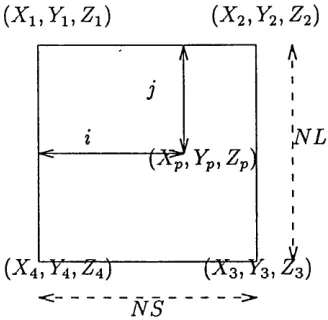
3.6 In te rp o la tio n of i and j from a given p o s i t i o n ... 85
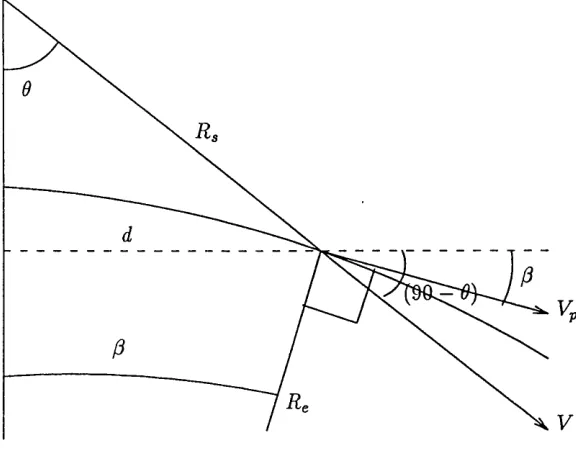
3.7 G eom etry of Satellite and G r o u n d ... 89
3.8 Sine Function ... 98
3.9 Illu stra tio n of Im age R o t a ti o n ...100
L IS T OF FIGURES
4.1 C om parison of O ptical and R a d a r Stereo G e o m e tr ie s ... 104
4.2 Basic Stereo R adar C o n f ig u r a tio n s ... 105
4.3 O th e r S tereo R ad ar C o n fig u ra tio n s ... 105
4.4 R a d a r Relief D isplacem ent G e o m e tr y ...109
4.5 R a d a r P a rallax G e o m e t r y ... 110
4.6 Illu stra tio n of S A R /O p tic a l C onfiguration for H eight D eterm ination . . . . 115
4.7 In tersectio n of Line w ith Sphere ... 117
5.1 O rb ita l Elem ents and Reference S y s te m s ... 121
6.1 Im age E x te n ts R elative to M ount S h a sta P e a k ... 130
6.2 Im age 1 — M ount S h a s t a ...131
6.3 Im age 3 — M ount S h a s t a ...132
6.4 Im age 7 — M ount S h a s t a ...133
6.5 H eader File for Im age 1 ... 134
6.6 H eader File for Im age 2 ... 135
6.7 H eader File for Im age 3 ... 136
6.8 H eader File for Im age 7 ... 137
6.9 Given L a titu d e and L ongitude E x te n ts for th e Four Im ages of M ount S h asta 138 6.10 Illu stra tio n s of th e Sw ath E x te n ts N oted in th e H eaders of the Four M ount S h a s ta Im a g e s ...139
6.11 V ariation of Doppler w ith A zim uth for Im age 1 ... 151
6.12 V ariation of Doppler w ith A zim uth for Im age 7 ... 151
6.13 V ariation of Satellite ^ -P osition w ith T im e for Im age 1 153 6.14 V ariation of Satellite y-P osition w ith T im e for Im age 1 154 6.15 V ariation of Satellite z-P osition w ith T im e for Im age 1 154 6.16 V ariation of Satellite ^ -P osition w ith T im e for Im age 7 155 6.17 V ariation of Satellite y-P osition w ith T im e for Im age 7 155 6.18 V ariation of Satellite z-P osition w ith T im e for Im age 7 156 7.1 D ependence of ^-C o m p o n en t of R esult on E rro r in D oppler for Im age 1 . . 163
7 .2 D ependence of y-C om ponent of R esult on E rro r in D oppler for Im age 1 . . 166
L I S T OF FIGURES 13
7.4 D ependence of RMS R esult on E rro r in D oppler for Im age 1 ...167 7.5 D ependence of a;-Com ponent of R esult on E rror in D oppler for Im age 7 . . 168 7.6 D ependence of ?/-Com ponent of R esult on E rro r in D oppler for Im age 7 . . 168 7.7 D ependence of 2-C om ponent of R esult on E rror in D oppler for Im age 7 . . 169 7.8 D ependence of RMS R esult on E rro r in D oppler for Im age 7 ...169 7.9 D ependence of .T-Component of R esult on E rror in N ear-R ange for Im age 1 170 7.10 D ependence of ?/-Com ponent of R esult on E rro r in N ear-R ange for Im age 1 170 7.11 D ependence of 2-C om ponent of R esult on E rror in N ear-R ange for Im age 1 171 7.12 D ependence of RMS R esult on E rro r in N ear-R ange for Im age 1 171 7.13 D ependence of .r-C om ponent of R esult on E rror in N ear-R ange for Im age 7 172 7.14 D ependence of y-C om ponent of R esult on E rror in N ear-R ange for Im age 7 172 7.15 D ependence of 2-C om ponent of R esult on E rro r in N ear-R ange for Im age 7 173 7.16 D ependence of RMS R esult on E rro r in N ear-R ange for Im age 7 ... 173 7.17 D ependence of z-C om ponent of R esult on E rro r in D oppler for Im age 1 . . . 180 7.18 D ependence of 7-C om ponent of R esult on E rro r in D oppler for Im age 1 . . 180 7.19 D ependence of RM S R esult on E rro r in D oppler for Im age 1... 181 7.20 D ependence of z-C om ponent of R esult on E rror in D oppler for Im age 7 . . . 181 7.21 D ependence of 7-C om ponent of R esult on E rror in D oppler for Im age 7 . . 182 7.22 D ependence of RMS R esult on E rro r in D oppler for Im age 7 ... 182 7.23 D ependence of z-C om ponent of R esult on E rro r in N ear-R ange for Im age 1 183 7.24 D ependence of 7-C om ponent of Result on E rror in N ear-R ange for Im age 1 184 7.25 D ependence of RMS R esult on E rro r in N ear-R ange for Im age 1 184 7.26 D ependence of z-C om ponent of R esult on E rro r in N ear-R ange for Im age 7 185 7.27 D ependence of 7-C om ponent of R esult on E rro r in N ear-R ange for Im age 7 185 7.28 D ependence of RMS R esult on E rro r in N ear-R ange for Image 7 ... 186
8.1 D ependence of .^-Com ponent of R esult on E rro r in D oppler for Im age 1 . . 194 8.2 D ependence of ^/-Com ponent of R esult on E rro r in D oppler for Im age 1 . . 194 8.3 . D ependence of 2-C om ponent of R esult on E rror in D oppler for Im age 1 . . 195 8.4 D ependence of RM.S R esult on E rro r in D oppler for Im age 1... 195 8.5 D ependence of ^ -C om ponent of R esult on E rror in D oppler for Im age 7 . . 196
L IS T OF FIGURES
8 .7 Dependence of 2-C om ponent of R esult on E rro r in Doppler for Im age 7 . . 197
List of Tables
3.1 P red icted and R e stitu te d O rb it A c c u r a c y ... 94
3.2 ERS-1 Im age L ocation E rro r B u d g e t ... 94
3.3 Raw D a ta E rror — R ange E r r o r s ... 94
3.4 Raw D a ta E rror — A zim uth T im e E r r o r s ... 95
3.5 ER S-1 Geocoding E rrors due to O rb it Position E r r o r s ... 95
3.6 ERS-1 G eocoding E rrors due to O rb it Velocity E rror ... 95
3.7 G eocoding E rror due to T errain H eight E rror of 25 m ... 95
3.8 T opographic Height E rror — Ellipsoid C orrected P ro d u c t E rror ... 95
3.9 T o tal Geocoding E rror: P red icted O r b i t ... 96
3.10 T o tal Geocoding E rror: R e stitu te d O rb it ... 96
3.11 T o tal Geocoding E rror: P relim inary O rb it ... 96
3.12 T o tal Geocoding E rror: Precise O rb it ... 96
6.1 G round C ontrol P o i n t s ... 142
6.2 Im age Position of G round C ontrol P o i n t s ... 143
6.3 Tim es of Im aging G round C ontrol P o i n t s ... 144
6.4 Im age 1: C alculated S lant R ange (Km) from G C P s ...145
6.5 Im age 1: C alculated Look-Angle (degrees) from G C P s ... 145
6 .6 Im age 3: C alculated S lant R ange (Km) from G C P s ...145
6.7 Im age 3: C alculated Look-Angle (degrees) from G C P s ... 146
6 .8 Im age 7: C alculated S lan t R ange (Km) from G C P s ... 146
6.9 Im age 7: C alculated Look-Angle (degrees) from G C P s ... 146
6.10 O rb ita l P a ram e te rs for Im ages 1, 3 and 7 ... 147
6.11 Image 1: N ear Slant Range and Range Pixel Spacing ... 147
L IS T OF TABLES
6.13 Im age 7: N ear Slant Range and Range Pixel Spacing ... 147
6.14 Slant R ange Pixel Spacing ... 149
6.15 Im age 1: A zim uth Pixel S p a c i n g ... 149
6.16 Im age 3: A zim uth Pixel S p a c i n g ...149
6.17 Im age 7: A zim uth Pixel S p a c i n g ...150
6.18 D oppler Frequencies ( H z ) ... 152
6.19 Im age 1: S atellite Position ... 156
6.20 Im age 7: Satellite P osition ... 156
7.1 Im age 1 Im age-to-O bject Geocoding: E x act In p u t ...160
7.2 Im age 7 Im age-to-O bject Geocoding: E x act In p u t ...161
7.3 E rro r in Satellite P osition as Assessed from Line F i t ... 161
7.4 E rro r in Satellite Velocity as Assessed from Line F i t ... 162
7.5 Im age 1 G eocoding Im age-to-O bject: E x act D a ta for various S ta rt-P o in ts . 164 7.6 Im age 7 G eocoding Im age-to-O bject: E xact D a ta for various S ta rt-P o in ts . 165 7.7 Im age 1 Im age-to-O bject Geocoding: Average I n p u t ... 174
7.8 Im age 7 Im age-to-O bject Geocoding: Average I n p u t ... 175
7.9 Im age 1 O bject-to-Im age Geocoding: E x act In p u t ... 176
7.10 Im age 7 O bject-to-Im age Geocoding: E x act In p u t ... 177
7.11 Im age 1 G eocoding O bject-to-Im age: E x act Data, for various S ta rt-P o in ts . 178 7.12 Im age 7 G eocoding O bject-to-Im age: E x act D a ta for various S ta rt-P o in ts . 179 7.13 Im age 1 O bject-to-Im age Geocoding: Average I n p u t ... 186
7.14 Im age 7 O bject-to-Im age Geocoding: Average I n p u t ... 187
8.1 Stereo SA R M easurem ents: E x a c t In p u t ... 192
8.2 Stereo SA R M easurem ents: E x a c t In p u t, V arious S ta rt-P o in ts ... 193
8.3 Stereo SA R M easurem ents: D oppler V ariation for b o th Im ages — O pposite D irections, G C P 12 200 8.4 Stereo SA R M easurem ents: N ear-range V ariation for b o th Images, G C P 8 205 8.5 S tereo SA R M easurem ents: A verage In p u t ... 207
8 .6 D em onstration of R ange Pixel Spacing D ependency for G eocoding and Stereo using Im age 1 G C P 6 ... 208
A cknowledgem ents
I would like to th an k Professor I. J. Dowman for his supervision and help th ro u g h o u t th e course of this work. I would also like to th an k D r. A. F. C lark for his help, especially as a sounding board. My th an k s also go to him for introducing m e to Awk and for his lATgX expertise. I am grateful for his c o n stan t belief in m y ability.
T h a n k s are also due to Joan a Fernandes for her help regarding orbits, Francelina N eto for her stereo advise and for acting as my stereo eyes (I c a n n o t see stereo), a n d Jam es P earson for his com puter system s help. I should also like to th a n k Dr. A. Sowter, form erly of th e G EC-M arconi Research C entre, for his help a t th e s ta r t of this work.
I would like to th an k th e Science and Engineering Research Council for their financial su p p o rt in th e form of a CA SE stu d e n tsh ip and to m y in d u strial sponsors, th e G E C -M arconi R esearch C entre.
T his docum ent was typeset using Prof. D onald E. K n u th ’s T^X system and Leslie L a m p o rt’s DTgX m acro package, w ith th e te x t se t in th e ‘C o m puter M odern’ series of fonts, also developed by D onald. E. K nuth. T he g raphs were produced using GNUPLOT, w ritte n by Colin Kelley and T h o m as W illiams.
C h apter 1
In tro d u c tio n
T h e concept of Synthetic A p e rtu re R ad ar (SAR) a p p ears to have originated in th e work of C arl W iley of the G oodyear A ircraft C orporation in th e early 1950s. W iley observed th a t th e along-tra.ck co-ordinate of a reflecting o b ject (being linearly transversed by th e ra d a r beam ) has a one-to-one correspondence w ith th e instantaneous Doppler shift of th e signal reflected to the rad a r by the object. He concluded th a t a frequency analysis of th e reflected signals should resu lt in finer along-track resolution th a n the along-track w idth of th e physical beam would indicate.
SA R has subsequently developed into a m atu re technology and provides a particularly useful im aging tool. T h e SA R sensor provides inform ation a b o u t a surface by m easuring th e reflected energy in th e microwave region of th e electrom agnetic sp ectru m , thereby extending th e capability of m easuring surface properties. In addition, as it uses its own energy to illum inate the scene and o p erates a t a relatively large wavelength, it can o p e ra te a t all tim es, i.e. day or night, and th ro u g h cloud cover. T hus, it has th e unique capability required for continuously m onitoring dynam ic surface phenom ena.
One m ajo r difficulty, recognised q u ite early in th e developm ent of SAR, was in th e im p lem entation of a physical d a ta processor th a t could accept w ide-band signals from a sto rag e device and carry o u t the necessary D oppler-frequency analysis a t each resolvable sla n t range. Hence, a large num ber of a rith m etic o p erations are required in order to generate an im age. T h e first airborne SA R system s used optical processors, tho u g h th e m ajo rity of SA R processors are now digital in n a tu re . However, th e developm ent of digital processors for spaceborne SAR system s rem ains a very active research field.
20 C H A P T E R 1. IN T R O D U C T IO N
SA R im aging of the E a r th ’s surface was proven to be practical by th e Seasat global ocean-m onitoring satellite launched by NASA in Ju n e 1978. A lthough this satellite re m ained o p era tio n a l only until O ctober 1978, a considerable q u a n tity of SA R im agery was recorded. T h e S easat m ission d em o n strated th e usefulness of SA R d a ta from satellites and aircraft for m onitoring the E a r th ’s surface, b o th over land and sea.
Since 1978, th e sh u ttle im aging rad ars, SIR-A and SIR-B, have provided m ore d a ta , th ough SIR-A im agery was optically recorded. T he next few years should see a rapid expansion of in te rest in th e field of microwave rem ote sensing, as SAR im ages from the E u ropean E R S -1, the C anadian RA DA RSA T, the Japanese JE R S-1, and th e US SIR-C becom e routinely available.
In te rre stria l rem ote sensing, th e use of SAR has several advantages over in stru m en ts op eratin g a t optical w avelengths. These include:
• P e n e tra te s clouds, giving n ig h t/d a y and all-w eather capabilities. • T he resolution is independent of th e distance to the object.
• Provides its own illum ination and thus has control over th e illum ination angle. • Allows im aging a t very shallow angles, giving dram atically different perspective th a n
com m on vertical photographs.
• E m ploys w avelengths different from visible and infra-red, and thus provides different in fo rm atio n (e.g., surface roughness, dielectric properties, and m oisture).
• Has p o te n tia l to p e n e tra te vegetation, snow, etc.. • C an utilise p o larisation effects.
• C an o p e ra te sim ultaneously a t several w avelengths, giving a m u lti-sp ectral capability. • C an im age ocean waves.
• C an p ro d u ce overlapping im ages su itab le for stereoscopic viewing.
• S u p p o rts shape-from -shading analysis, interferom etric operation for 3-D m apping, and analysis of incidence angle sig n atu res of objects.
1.1. G E O C O D IN G 21
1.1
Geocoding
Geocoded Imagery is a term which describes any rem otely sensed im agery th a t has been tran sfo rm ed onto a carto g rap h ic projection (e.g., U niversal Transverse M ercator, UTM ) a nd is independent of b o th th e sensor and th e m otion of th e satellite p latfo rm from which th e original raw im agery was collected. It does n o t im ply t h a t terrain effects have been tak e n into account. In general, th e process involves th e following operations:
• correction of geom etric effects;
• reg istratio n to geographic co-ordinate system s;
• resam pling to m ap scale and form at w ithout d eg rad atio n of radiom etric quality.
F urth erm o re, ‘G eocoded Im a g e ry ’ usually indicates th a t th e im age is referenced to a car to g rap h ic co-ordinate system , while th e term Precision Geocoded Imagery d en otes th a t the im age has been further corrected for geom etric d isto rtio n s b o th due to variations in terrain relief and due to the im age form ation process. However, th e reader should be aware th a t this term inology is not universally adopted, and confusion occasionally arises. T he work in this thesis is prim arily concerned w ith precision geocoding.
G eocoded im agery should n o t, however, be confused w ith georeferenced im agery. Geo- referencing is the process of geom etrically correcting an im age, using ground inform ation, to any m ap projection, while retaining m ission-dependent characteristics such as image fram ing, o rientation and (som etim es) pixel size. M ost c u rren t ground sta tio n processing system s produce m ission-dependent, georeferenced im age products.
T h e m ain advantages of geocoded im agery are:
• d a ta from several different satellites/sen so rs covering th e sam e a re a m ay be combined;
• im agery m ay be com bined w ith geographically-referenced non-im age d a ta ;
• ad jacen t fram es of im age d a ta m ay be joined and analysed as one fram e.
22 C H A P T E R 1. IN T R O D U C T IO N
T h e developm ent of digital d atab ases and G eographic Inform ation System s (GIS) will facilitate th e ex tractio n of new th em atic inform ation from digital im age d a ta , by enabling th e com parison of physical p aram eters m easured by one sensor w ith those m easured by an o th er. T he geom etric relationship betw een these sp a tia l d a ta m ust therefore be established. Hence, all d a ta s e ts m ust be presented in a comm on cartographic reference system .
G eocoding of o p tic a l/in frare d im agery is well know n and is im plem ented in m any sys tem s. However, SA R im ages introduce geom etric anom alies which have no c o u n te rp a rt in o p tic a l/in fra re d imagery. Since a num ber of rem ote sensing satellites to be launched in th e 1990s will carry a SAR, digital im age processing and algorithm s which facilitate the re stitu tio n of th e inherent geom etric d istortions of SA R im agery are urgently required.
[B uchroithner, 1987] rep o rted th a t, for geological lineam ent analysis, b o th geocoded and unrectified im agery should be used. C om plim entary evaluation of b o th is recom m ended in order to acquire the fullest inform ation on linear features from rad a r imagery. It is also re p o rte d th a t, in high relief, even geologists experienced in the evaluation of o p tic a l/in frare d im agery have serious difficulties in carrying o ut field checks using non-geocoded SA R im agery. T herefore, for effective and tim e efficient field work, geocoded im agery needs to be available.
However, SA R im agery is affected by a num ber of radiom etric and geom etric d istortions which, in m any applications, com plicate or even prevent effective utilisation of the imagery. Hence, g re a t care m ust be taken in evaluating b o th geocoded and unrectified SA R im agery alike.
1.2
Stereoscopy
1.3. A V A IL A B L E IM A G E DATA 23
believed to be novel, which is m ore ap p ro p riate for ERS-1 im agery (due to th e availability of precise ephem eris d a ta ) is presented in th is thesis.
1.3
Available Image D a ta
D espite in terest in SA R geocoding and stereoscopy a t a n um ber of research estab lish m en ts th ro u g h o u t th e world, suitable d a ta are difficult to o b tain . T h is m akes it difficult to assess techniques on a variety of d a ta se ts. T h e work described in th is thesis was carried o u t in p rep aratio n for ER S-1 im age d a ta . A t th e s ta r t of this work, in A pril 1988, E R S-1 was due to be launched in late 1989 or early 1990, and hence it was expected t h a t som e ER S-1
d a ta would be available to th e a u th o r. However, a t th e tim e of w riting, ER S-1 has still to be launched (it is currently expected to be in o rb it in July 1991). T his h as m e a n t th a t a ltern ativ e sources of im agery have had to be used.
T h e work described in this thesis was carried o u t using SIR-B im agery of M o u n t S hasta, C alifornia, USA, four im ages of which were available. SIR-B im agery of E g y p t a n d M ada gascar were also available, b u t these were of com paratively fla t terrain and hence were n o t su itab le for this type of work, i.e. geocoding and height assessm ent of a flat te rra in would n o t d em o n strate the algorithm s sufficiently.
A stereo pair of VARAN-S d a ta of th e Aix en Provence area of France was also avail able. However, it had been shown previously [Quegan et al., 1991] th a t these d a ta were radiom etrically co rru p t, causing th e im ages to be bland and w ith little visible d etail. Also no header data, accom panied the images, rendering th em useless for this work.
A S P O T image of Aix en Provence was available and th e G erm an DLR offered to send a S easat SAR im age of this area, thus giving a S P O T /S e a s a t com bination. T h e request for th e Seasat SA R d a ta was sent in late 1989. To d a te , th re e im ages have b een received, b u t none of them have been of th e requested area. (D LR h ad s ta te d th a t, if a user defined a centre la titu d e and longitude of an are a known to be covered by Seasat, th e n th e im age could be easily found and sent on to th e user. It a p p ears th a t th e h eader d a ta for th e required orbit have been co rru p ted and so th e im age has still n o t been lo ca ted . So m uch for ease of d a ta access!)
24 C H A P T E R 1. IN T R O D U C T IO N
tu n ate ly , th e header d a ta of one of th e SA R im ages h ad been lost a t source. T h e Seasat im age which h a d th e header had the least overlap w ith th e S P O T scene; th e overlap area w as of a high ridge, river valley, and lake. T h e S easat SA R im age h ad been acquired in A u g u st 1978, an d the S P O T scene in Ju n e 1987; hence, due to th e tim e and season differ ences, no g round control points could be reliably o btained from the river or lake. T here w ere a couple of roads on this overlap region, b u t these h ad no ch aracteristic points such as ro ad crossings or sharp bends. M atching points on th e ridge was also difficult due to SA R foreshortening effects, differing resolutions, and look-angle. No ground control points could be established with any degree of confidence on bo th of the images and th e m aps.
M ost recently, NASA have released SAR im agery of Venus from th e M agellan mission on CD -R O M media.. A lthough of the wrong planet, these d a ta should be usable for both geocoding and stereoscopy. However, the long lead tim e in obtaining th e im agery and the lack of ground d a ta to verify the results m eans th a t the use of such d a ta is n ot feasible for th is work.
T h e M ount S h a sta SIR-B im agery used in this stu d y was courtesy of Dr. J-P . Muller. T hese d a ta had been supplied to him by B ritish P etroleum , originally com ing from the Je t P ropulsion L aboratory, USA. No docum ents were supplied describing th e im ages or the header d a ta . T h e a u th o r endeavoured to obtain such inform ation b u t was told th a t it was n o t available. T here are various forms of im age header depending on from where it was supplied. Hence th e au th o r had no header d a ta description.
1.4
Work of this Thesis
O ne of th e objectives a t the o utset of this stu d y was to define, dem o n strate, and perform erro r analyses of object-to-im age and im age-to-object geocoding. T he o th er objective was to d e m o n stra te how SAR. im agery could be used in stereoscopy and investigate how the resulting proced u re responds to errors in the in p u t d a ta . T he stu d y was carried o u t as p a rt of th e p rep a ra tio n s for the reception of ERS-1 SA R imagery.
T h e a u th o r held a CA SE aw ard stu d e n tsh ip , th e in d u stria l sponsor being th e GEC- M arconi R esearch C entre situ a te d in G re a t Baddow , Chelm sford, Essex.
1.4. W O R K OF THIS THESIS 25
deal of tim e stu d y in g SAR im age form ation. C h a p te r 2 details th e m ain topics of in terest. Efforts to obtain suitable SA R im age d a ta were co nstantly being m ade and several sources of im age d a ta , u n fortunately m ostly u n su itab le, were investigated.
T h e different m ethods of geocoding th a t were currently being used, or were proposed for th e future, were investigated and a decision was m ade as to th e m eth o d m ost su ited to this work. A description of geocoding m ethods is given in C h a p te r 3. T h e m eth o d chosen for this work was the SA R processor based m ethod, which em ploys th e SA R range and Doppler equations as well as a description of th e E a rth surface. T h e re are two ways of perform ing geocoding, nam ely im age-to-object and object-to-im age. A lgorithm s for b o th these m eth o d s were established and are given in detail in C h a p te r 3. A discrepancy was found betw een the im age-to-object geocoding algorithm defined by th e a u th o r and t h a t of th e G erm an DLR — see Section 3.4.1. T h e a u th o r’s definition is correct, as was subsequently confirmed bv DLR following num erous com m unications. T he m e th o d of SA R processor geocoding requires th e solution of two or th ree non-linear equations (depending on th e type of geocoding, i.e. im age-to-object or object-to-im age). A n a p p ro p riate , ite rativ e m eth o d of solving these equations was found and m ethods of obtaining a suitable s ta rt- p o in t for th e ite ratio n were established.
W hole im age geocoding necessitates resam pling. T h e a u th o r tu rn e d her a tte n tio n to th is topic briefly in collaboration w ith the G E C -M arconi Research C entre. It was established t h a t resam pling a single-look image can alter th e im age sta tistic s — which could have serious consequences on further use of th a t im age. T h is work is detailed in Section 3.8 and also in a published pap er reproduced as A ppendix A.
M ethods of obtaining position and height inform ation from stereo SA R im agery were investigated. Previous studies have been ham pered by the lack of su itab le stereo SA R im agery. All th e results published so far ap p ear to have been obtained using m ethods based on photogram m etric approaches. Since ER S-1 will give ac cu ra te ephem eris d a ta , th e a u th o r established an analytic approach which uses th e SAR range and D oppler equations and hence relies on the sensor position being known accurately. T his ap p roach is detailed in C h a p te r 4 along w ith an exam ple of a photogram m etric approach.
26 C H A P T E R 1. IN T R O D U C T IO N
geom etric approach which is based on intersecting a line, representing th e optical look-angle, and a sphere representing th e SAR e m itte d pulse. T h is geom etric approach is detailed in C h a p te r 4 along w ith an exam ple of a photogram m etric approach. U nfortunately, due to lack of su itab le im age d a ta (see Section 1.3), it was n o t possible to d em o n strate S A R /o p tic al stereo.
T he only su itab le im age d a ta available for use were th e SIR-B d a ta described in Sec tion 1.3. T he a u th o r sp e n t a considerable am ount of tim e trying to check th e validity of th e im age and header d a ta . M any of th e header d a ta were shown to be incorrect. T he a u th o r had to establish which of the images were usable and evaluate th e required in p u t p a ram eters for th e geocoding and stereo work. T his necessitated m odelling th e sensor orbit so th a t th e sensor position could be found a t any tim e. This proved to be a surprisingly com plicated task , as it requires knowledge of three different reference system s, which are in tu rn rela te d to different tim e system s, as well as knowledge of th e m ethod of orb ital p a ra m ete r assessm ent. T he SIR-B header d a ta supplied one position and velocity vector for an unspecified tim e. In C h ap ter 5, details are given as to how th e orb ital d a ta were established using only these two vector positions, while C h a p te r 6 describes how the SIR-B d a ta were validated. It was established th a t two of the SIR-B im ages of th e M ount S h a sta could be used for point, n ot whole im age, analysis.
A co m p u ter program GEOCODE was w ritten in FO R TR A N on a VAX W orkstation. T his program will perform b oth im age-to-object and object-to-im age geocoding. T he resu lts of geocoding th e SIR-B im agery and the investigations as to how geocoding responds to errors in troduced in to th e m ain in p u t param eters, nam ely near-range and D oppler, are rep o rted in C h a p te r 7. T h e effects of using different sta rt-p o in ts for the ite rativ e m ethod of solving th e non-linear equations was also addressed here. T his type of analysis into th e sensitivity to error of b o th im age-to-object and object-to-im age geocoding does n o t appear to have been rep o rted in the litera tu re .
1.5. S C O P E OF TH IS THESIS 27
T h e objectives a t the s ta r t of this stu d y have been m et, though, due to th e lack of su ita b le im age d a ta , these have n o t been d e m o n stra ted as fully as had been hoped a t th e o u tse t.
1.5
Scope of this Thesis
T his thesis is divided into nine ch ap ters. In order to be able to analyse a SA R im age it is essential th a t th e SAR. processing m ethod is un d ersto o d . In C h a p te r 2, th e principles of SA R o p e ra tio n , properties, and processing are given. C h a p te r 3 outlines m ethods of geocoding and then gives a detailed description of th e geocoding technique chosen for use in th is study. E rro r considerations are discussed here, along w ith th e im p o rta n t subject of resam pling and radiom etric d egradation. A section of this C h a p te r describes th e ERS-1 m ission and includes the results of an error b u dget stu d y perform ed for it.
In C h a p te r 4, stereoscopy involving SA R im agery is considered. B oth S A R /S A R and S A R /o p tic a l com binations are outlined in term s of b o th photogram m etric and analytic m eth o d s. O rb it, tim e, and reference system s are described in C h a p te r 5; these considera tions are essential in this stu d y (but rarely discussed in the litera tu re ) so th a t th e sensor position can be predicted accurately a t any tim e. In this study, SIR-B d a ta were used (see Section 1.3). No precise ephem cris d a ta were available and hence h ad to be calculated from th e procedures detailed in C h a p te r 5.
C h apter 2
P rinciples of SA R Im aging an d
Processing
2.1
Introduction
T h e SA R im age form ation process is very com plicated, to tally unlike th a t encountered in any conventional optical instrum ent. In order to gain an appreciation of the m eaning of a SA R im age, an u n d e rsta n d in g of this image form ation process is essential. T he purpose of th is C h a p te r is to give a brief description of the operation of a SA R and the m eth o d by which th e e m itte d signal is converted into an image.
T his C h a p te r is n ot intended to be a definitive te x t on SAR. Hence, in m ost of the C h a p te r, certain sim plifying assum ptions have been m ade. In p a rticu la r, it is assum ed th a t th e E a rth being illum inated by th e SA R is flat. T his ‘flat E a r th ’ approxim ation is also assum ed in m any of th e sta n d a rd tex ts on th e su b ject, e.g. [Hovanessian, 1980], [Elaclii, 1988]. However, it should be noted th a t, unless specifically sta te d , a flat E a rth has not been assum ed in any of th e subsequent work described in th is thesis.
T he C h a p te r is divided into six sections. T he second outlines th e fundam ental princi ples on which th e in stru m e n t is based. T he next section discusses th e properties of SAR d a ta , including th e effects of o rb it and atm osphere. Sources of noise in SA R im agery are th en considered. Section 2.5 addresses th e im p o rta n t topic of SA R processing — an u n der sta n d in g of th is is essential for successful analysis of SA R im agery. Finally, types of SA R processor are briefly outlined.
2.2. B A S I C P R I N C I P L E S 29
W D-> v
<-Ra
Figure 2.1: G eom etry of SA R Im aging, (a) G eom etry corresponding to a side looking im aging ra d a r, (b) G eom etry in the range plane (perpendicular to th e satellite track ), (c) G eom etry in th e azim uth plane. Following [Elaclii, 1988]
2.2
Basic Principles
I t is assum ed t h a t the reader is fam iliar w ith th e general concepts of frequency and the D oppler efFect [W helan and H odgson, 1971] and of sam pling theory [Bracewell, 1978]. In th e sy n th e tic a p e rtu re technique, the D oppler in form ation in th e retu rn ed echo is combined w ith th e tim e-delay inform ation to generate a high-resolution im age of th e surface being illum inated by th e ra d a r.
30 C H A P T E R 2. PR IN C IP L E S OF S A R IMAGING A N D PROCESSING
Flight P ath
Sensor
r
-~\
-Lines of equi-Doppler Ground Track
Lines o f equi-range Ground Swath
Figure 2.2: C o o rd in ate system for SA R im age form ation. A set of circles and hyperbolae define th e equi-range and equi-D oppler lines respectively. Following [Elaclii, 1988].
r a d a r as th e apex. T he intersection of these cones w ith the ground generates a family of hyperbolae, as indicated in Figure 2.2. O b jects on a specific hyperbola provide equi- D oppler re tu rn s. Hence, each point on th e surface can be uniquely identified by a specific tim e delay and specific D oppler.
2.2. B A S IC PR IN C IPLES 31
Point Target
Echo Store
P h a se Shifters
Coherent Addition
Figure *2.3: C on stru ctio n of a SA R im age of a p o in t ta rg e t by phase correction.
for coherence is th e basic difference betw een a SAR sy stem and a rea l-a p e rtu re side-looking ra d a r.
T h e brightness of a specific im age pixel is p ro p o rtio n a l to th e echo energy contained in th e tim e-delay and th e D oppler re tu rn corresponding to th e point on th e surface being im aged. T h e resolution of the SA R im ager th u s depends on th e accuracy of m easurem ent of th e differential tim e-delay and differential D oppler (phase) betw een two neighbouring p o in ts on th e surface.
32 C H A P T E R 2. PR IN C IP L E S OF S A R IM AG ING A N D PROCESSING
done either optically or digitally. In this thesis, only digital processing is considered. O ne unique featu re of SA R is th a t its resolution is independent of th e platfo rm altitude. T his results from the fact th a t the im age is form ed by using th e D oppler history and th e differential tim e delays, none of which is a function of the range from th e rad ar to th e surface. T his unique capability allows th e acquisition of high-resolution im ages from satellites a t high altitu d es, providing th e received echo is above th e noise level.
2 .2 .1 S A R B a s i c B l o c k D i a g r a m
A sim ple block diagram of the essential features of a SA R system is shown in Figure 2.4. T he tra n s m itte r provides high power am plification of th e pulse produced in th e pulse m odulator. T he generated pulse travels along a transm ission line, th ro u g h a two-way sw itch called a duplexer and is rad ia te d o u t through th e an ten n a. For system s th a t em ploy a single a n te n n a for b o th transm ission and reception, th e duplexer has to p ro te c t th e receiver from tra n s m itte r leakage. T h e receiver detects and amplifies th e reflected signal. T his signal is th e n m ixed w ith the reference frequency provided by the stable local oscillator down to some interm ed iate frequency (IF). T he stab le local oscillator is employed to ensure th a t each tra n s m itte d pulse originating in the pulse m o d u lato r has exactly th e sam e phase. T he signal is th en fu rth e r amplified a t th e interm ed iate frequency stage. It is th e n fu rth e r mixed down to zero carrier frequency w ith the o u tp u t of an IF oscillator, which is phase-locked to th e controlling stable local oscillator.
A t th e sam e tim e, th e signal is converted to in-phase (I) and q u a d ra tu re (Q) form at (i.e., in-phase and 90° o u t of phase). For exam ple, if th e received signal is
S = AQ.os(ut + <f>)
this is th e in-phase p a rt of the signal. T h e q u a d ra tu re p a rt of th e signal is obtained by applying a phase shift of 7r/2, i.e.
S i = A cos (a;£'+ <f>)\ Sq = A sin (u t + <j>).
2.2. B A S IC PR IN C IPLES 33
Duplexer
Antenn
Mixer
IF A m p lifie r RF Amplifier
Stable Local
Oscillator
Detection I and Q
Mixers
Recording System Phase Locked
IF Oscillator
Signal (SAR) Processing
T r a n s m i tte r
Pulse Modulation
34 C H A P T E R 2. P R IN C IPL ES OF S A R IM AG ING AN D PROCESSING
S i + iSq = A exp i ( u t -f
<f>)-T h ere th en follows th e m ost com plicated p a rt of th e SAR, th e signal processing, which produces an im age for each range and azim uth position. T he (coherent) signal processing in th e SA R system is usually followed by square-law (power) detection and display of the resulting intensity im age. SA R processing will be discussed la te r in this C h a p te r.
2 .2 .2 R e s o l u t i o n o f C o n v e n t i o n a l R a d a r
A conventional side-looking ra d a r achieves sla.nt-ra.nge resolution through th e use of pulsing and tim e delay sorting. If th e ra d a r tra n sm its a very sh o rt pulse, reflected by a ta rg e t a t sla n t range jR, th en the ro u n d -trip p ro pagation tim e between th e rad a r and th e targ e t is given by:
2 R
A T = — (2.1)
c
w here c is th e p ro p agation speed of the rad a r wave.
T he reflections from targ e ts a t different ranges will, naturally, arrive a t th e receiver w ith different tim e delays. If th e tra n s m itte r pulse is very short, say of d u ra tio n r , th en th e re tu rn s from th e targ ets a t sufficiently different ranges will be non-overlapping in tim e. Specifically, th e required sep aratio n is given by
Rs > y . (2.2)
Taking th is as a m easure of th e sla.nt-range resolution, Rr , th en
Rr » y (2.3)
a n d th e corresponding ground-range resolution is
CT
2.2. B A S IC PR IN C IPLES 35
w here 0 is th e look angle.
In a sim ple pulsed ra d a r, th e generation of a pulse of d u ratio n r requires a tra n s m itte r b a n d w id th of th e order of
B„ « I . ( 2 .5 )
P reservation of the range resolution c r / 2 requires t h a t th e receiver also has a b an d w id th of
B p& 1 / t . T he key to achieving fine range resolution is th e use of w ide-band ra d a r tra n s
m itte rs and receivers, requiring th e use of pulse com pression as described in Section 2.5.1. T h e b a n d w id th sets the fundam ental co n strain t on range resolution:
R r K S w p - (2-6)
For exam ple, a ra d a r w ith a b an d w id th of 1 GHz provides a theoretical range resolution of ^ 15 cm.
T h e along-track or azim uthal cross-section of th e a n te n n a p a tte rn has a half-power angular w idth of p radians. T he corresponding along-track beam w idth a t range R is
L « PR. (2.7)
If th e d istance L is accepted as a m easure of the along-track resolution R a of this rad a r, th en th e only way to achieve fine resolution a t long range is to m ake P very narrow . However, an a n te n n a a p e rtu re w ith along-track dim ension D, o p e ra tin g a t its diffraction lim it a t w avelength A, yields a half-power angular beam w idth of [Elachi, 1988]
(2-8)
which im plies th a t
A 7?
K » - f - ( 2 . 9 )
36 C H A P T E R 2. P R IN C IPL ES OF S A R IM AG ING AN D PROCESSING
leads to w eath er lim itatio n s due to atm ospheric absorption; and finally, co n stru ctio n of a diffraction-lim ited large a n te n n a can be costly as well as difficult. For exam ple, a ra d a r w ith D « 103A realises, a t a sla n t range of R = 10 Km , an along-track resolution of R a ~ 10m.
Hence, th e p o ten tia l to achieve fine range resolution appears to be restricted to relatively po o r resolution a t long operation ranges. T h e sy n th etic a p e rtu re technique can improve a zim uthal resolution to th e point w here R a is com parable to R r.
T he concept of th e synthetic a p e rtu re technique can be explained in two ways, each of which leads to th e sam e result: a sy n th e tic a rra y approach or a D oppler synthesis approach. Let us consider each in tu rn .
S y n th e tic A r r a y A p p r o a c h
Let us assum e a rad a r sensor has an antenna, length D and is moving a t a velocity v. T he a n te n n a m ain beam fo o tp rin t on the surface is equal to
i = eah = ^ . (2.io )
As th e sensor moves, successive echoes are recorded a t points X i , X2, . . . along th e flight line (see Figure 2.5). In addition, th e ta rg e t is assum ed to be sta tic (or its behaviour known) as each point is recorded.
T he echoes are recorded coherently as a function of tim e and th en com bined in a processor to synthesize a. linear array. T he m axim um array length th a t can be achieved is L (see Figure 2.5). T he synthesized array will have a beam w idth of
6, = 2 l ’ (2‘n )
which is h a lf t h a t for a physical a n te n n a of the sam e length. T his is because th e a n te n n a p a tte rn of a conventional ra d a r antenna, is determ ined from th e phase shifts due to th e one way p a th difference betw een the a n te n n a and the ground. In SAR, however, th e sy n th etic a n te n n a is determ ined by th e phase shift caused by th e two-way round trip betw een a n te n n a and th e ground. Hence, th e sy n th etic a p e rtu re elem ents are effectively twice as far a p a rt as in th e physical a p e rtu re case, so the effective a n te n n a length is twice L.
2.2. B A S IC PR IN C IPLES 37
h
F igure 2.5: G eom etry of a synthetic a p e rtu re array. P oint P is visible from locations X i to Xn. T h e length of the synthetic a p e rtu re is equal to th e real a n te n n a fo o tp rin t L. Following [Elachi, 1988]
e s = L (2.i2 )
and the resulting array fo o tp rin t on the ground is
R a = h6s = j . (2.13)
T h is corresponds to the finest resolution th a t can be achieved using th e synthetic array. T his equation gives th e im p o rta n t result th a t th e u ltim a te azim uth resolution of a SA R is independent of th e distance betw een th e sensor and the area being im aged. In addition, finer resolution can be achieved w ith a smaller a n te n n a .
D o p p le r S y n th e s is A p p r o a c h
38 C H A P T E R 2. PR IN C IP L E S OF S A R IMAGING AN D PROCESSING
Id
P
F igure 2.6: D oppler history of a. point targ et. Following [Elachi, 1988]
2v , 9a V@g v . i ,i
} D = T s.n y ~ — = q (2-14) and / 0 is th e tra n s m itte d signal frequency.
If a neighbouring ta rg e t P 7 is positioned a t a distance X a along th e azim uth dim ension from P , th e D oppler history from P 7 will be identical to th a t from P b u t w ith a tim e displacem ent of t = X a/ v . T h e sh o rte st tim e displacem ent th a t can be m easured after processing a signal of sp e ctral b a n d w id th B p = 2 / # is
I I D
t r n ~ B ^ - 2 f Z ~ T v - (2' 15) T h e finest possible resolution is then given by
X a = R a = v t m = y , (2.16)
2.2. B A S IC PRINCIPLES 39
2 .2 .3 S t o p - S t a r t A p p r o x i m a t i o n
It should be n o ted th a t in all (to th e a u th o r ’s knowledge) SA R processing, it is assum ed t h a t th e ra d a r platform is considered as being sta tio n a ry while a pulse is being tra n s m itte d and received, th en moving along and stopping again for th e nex t pulse transm ission and reception. T his is know as the stop-start approximation; it can be shown [Barber, 1985] to be valid to a high degree of precision for o rb ita l SARs.
2 .2 .4 P R F L i m i t s
A m biguity will result if the P R F is so high t h a t th e re tu rn signals from two successive tra n s m itte d pulses arrive sim ultaneously a t the receiver. T his is called range ambiguity. Conversely, if th e P R F is so low th a t th e retu rn is n o t sam pled a t th e N yquist ra te , there will be a D oppler or azimuth ambiguity.
T he u p p e r lim it of the P R F is fixed by th e range beam w idth, 9r, of th e SA R a n te n n a (see Figure 2.1). In order to avoid having th e far edge echo from the c u rren t pulse arrive a t th e receiver a t the same tim e as the near edge echo from th e following pulse, we require th a t
^ 2 A ,
T > — (2.17)
i.e.,
_ 2h ta n 9 . .
T > ---- 9 r 2.18
c cos 9 '
2Ah s in # . .
(2.19) c W cos2 9
or
P R F < (2.20)
2 X h s m 9
40 C H A P T E R 2. PRINCIPLES OF S A R IMAGING AN D PROCESSING
th e pulse length is much sm aller th an T . C urvature of the E a r th ’s surface is neglected. A lower lim it on th e P R F is im posed by the requirem ent th a t th e P R F m ust equal or exceed th e m axim um Doppler shift of th e return signals. T argets a t th e centre of the broad side beam will re tu rn signals w ith zero D oppler shift. T argets ahead of broadside centre are characterised by a positive D oppler and those behind by negative Doppler frequencies. If the re tu rn of th e targ e t is shifted in frequency by an am ount equal to th e P R F , th e receiver will be unable to distinguish the pulsed retu rn signal from th a t of a ta rg e t on broadside centre. T h u s th e P R F has to be sufficiently high to exceed th e m axim um Doppler shift of targ e ts located a t beam edge. T he D oppler shift f n due to a radial velocity vr is given by
2vrf 0 2v sin ipf0 2vip
f D = — = ---~ — (2.21)
where f Q is th e ra d a r frequency and vr = u s i n ^ ~ vip. T he angle to th e first null of the tra n sm itte d beam is ij) = A /D , where D is the a n te n n a length. T hus
Id = ^ (2.22)
and
P R F ,PR Flow = JD = n -2 v <2 -23)
Com bining eq uations 2/23 and 2/20, we obtain
c W cos2 9 2v
■0 y, ■ , > P RF > — 2.24
2A/ ism0 D
which m ay be w ritte n in th e form
I Y D > (2.25)
c c o s ' d
2.3. P R O P E R T IE S OF S A R DATA 41
2 .2 .5 F o c u s s e d a n d U n f o c u s s e d S A R
For a SA R to achieve its full capability, each received echo should be phase-shifted to take in to account th e fact th a t the distance betw een th e sensor a n d ta rg e t varies across th e sy n th e tic ap e rtu re . T he phase shift needed to be added to th e echo received a t th e i—— p o sition along th e sy n th etic a p e rtu re order to focus on a p o in t is
4>if = y (* - r , - ) , (2-26) w here h is the distance of zero Doppler shift, i.e. th e closest range, and r t- is th e range.
A sy n th e tic a p e rtu re can be co nstructed over such a sh o rt len g th th a t no phase correc tion is necessary — this is called an unfocussed sy n th e tic a p e rtu re . T he signal processing in th is case is greatly simplified, since a d ju stm e n t o f the re tu rn e d pulses is n o t necessary. C onventionally, no phase correction is perform ed if th e phase changes by less th a n ir/2. It can be shown [Elachi, 1988] th a t th e b est azim uthal resolution available in an unfocussed SA R system is given by
Ra « 1(AA) K (2.27)
In th is case, th e resolution does depend on the ran g e to th e ta rg e t. T he unfocussed aper tu re is only used in practice for applications where very high resolution in azim uth is not necessary or for sh o rt w avelength/range system s.
2.3
Properties of S A R data
In th is section, som e prop erties of SA R which have to be accounted for in th e sensor or processor are outlined.
2 .3 .1 A n t e n n a S i d e l o b e s a n d I n t e g r a t e d R a n g e A m b i g u i t y N o i s e
42 C H A P T E R 2. PR IN C IPLES OF S A R IMAGING AND PR O CE SSIN G
Antenna
\
i \
i \
Power Incident • at the Surface ■
I
L
Sidelobe T T Sidelobe
-Null Null
Main Beam
Figure 2.7: A n te n n a rad iatio n a t transm ission and the corresponding surface illum ination. Following [Elachi, 1988]
energy incident only from specific directions.
A n te n n a sidelobes (see Figure 2.7) result in th e transm ission of some energy into, and th e reception of energy from, undesirable directions — i.e., from areas other th a n the sw ath being im aged. T hus, they can be tho u g h t of as a source of ‘noise’, since th e echo of th e N —— pulse from the m ain lobe could experience interference from the ‘fro n t’ sidelobe of th e ( N + 1) -Ah pulse and th e ‘back’ sidelobe of th e (Ar — 1) -Ah pulse. A n te n n a sidelobe noise is com m only called range ambiguity noise.
2.3. P R O P E R T IE S OF S A R D ATA 43
reflector or radio tower) will show up as a num ber of bright points a t regularly-spaced intervals. T h e b rig h te st point is th e ‘tr u e ’ point ta rg e t location, o th er p o ints decreasing in in ten sity on eith er side. T hese p o in ts are also known as ghosts.
To m inim ise th is range am biguity noise, th e a n te n n a response can be w eighted to reduce th e level of th e sidelobes. A lternatively, a P R F could be used such t h a t th e strongest re tu rn com ing th ro u g h th e sidelobes is n o t coincident in tim e w ith th e m ain lobe echo, and therefore can be elim inated by tim e g atin g (see, for exam ple, [Elachi, 1988]). In general, th e stro n g est range am biguity noise comes th ro u g h those sidelobes closest to th e nadir, as th e n ad ir reflectivity is norm ally very high.
2 .3 .2 R a n g e M i g r a t i o n
D uring in te g ratio n along th e sy n th etic a p e rtu re length, th e ta rg e t range changes by m ore th a n th e range resolution. D uring this period, th e ran g e betw een th e sensor a n d th e ta rg e t is
r(t) = y j r 02 + v 2t2, (2.28)
w here 7'q is th e nearest range, v is the sensor velocity and t is th e tim e. (T he effect of E a rth cu rv a tu re has again been neglected.) Usually, vt <C r 0; then,
KO = r o + 7^ “ (2.29)
a nd th e re tu rn echo has a phase shift (f>(t) equal to
2 r(t) 47r ro 2irv2t 2
* ( t ) = 2 = V + (2-30)
If rm is th e m axim um range a t th e edge of th e sy n th e tic a p e rtu re , then:
= V r 02 + « r0 + (2.31)
44 C H A P T E R 2. P R IN C IP L E S OF S A R IM AG ING A N D PROCESSIN G
i'c = rm - r 0 = V I ~ -~- (2-32)
8 r 0 Now
rr r oA r0\
vTd = -d =
so th a t
rn A2 3 2 Ra2 ' Relative to th e slant range resolution R,.,
(2.33)
■ET = — —-jr— • (2.34)
R r 32 R„2R r
For exam ple, in the S easat SAR system , = R a = 7 m, A = 0.25 m and r0 = 850 Km. T he range curvature, rc/ R r , is 4.8; this m eans th a t a point moves through 4.8 resolution elem ents du rin g th e form ation of the sy n th etic a p e rtu re .
Range walk is th e difference in range to a p o in t ta rg e t from th e position a t which it enters th e b eam to th a t a t which it leaves the beam . R ange walk is due to o rb it eccentricity, a ttitu d e errors, squint, E a rth ro ta tio n and linear velocity of the ta rg e t. T h e E a r th ro ta tion term depends on latitu d e , since the E a r th ’s velocity is obviously different a t different latitu d e s. M oreover, th e angle between th e sw ath velocity vector and th e E a r th ’s surface velocity varies, being equal to the orbit inclination angle a t th e e q u ato r (if th e squint is zero) and zero a t the poles. Range walk is hence a function of la titu d e and is n o t c o n stan t in the along-track direction, although it m ay be considered as c o n sta n t in a sufficiently sm all interval. R ange walk can be one or two orders of m ag n itu d e larger th a n th e range resolution. For Seasat, range walk is norm ally q u o ted as 33 range sam ples. R ange curva tu re and range walk to g eth er are known as range migration (see F igure 2.8), an effect th a t m u st be tak en into account during processing.
2.3. P R O P E R T IE S OF S A R DATA 45
± Ill
2
- T D ~T~
Range Walk
-e-Range Curvature
Range
Figure 2.8: R ange walk and curvature.
2 .3 .3 A t t i t u d e E r r o r s
A SA R p latform m ay yaw, pitch a n d /o r roll away from its nom inal a ttitu d e , thereby in troducing an error into the a n te n n a beam pointing.
A sm all roll (ro tatio n ab o u t the axis of travel) pointing erro r does not affect th e location; of th e im aged sw ath. However, th e a n te n n a gain p a tte rn w eights th e echo shape; thus, roll will cause th e w eighting p a tte rn to be m is-m atched and hence introduce an error. If th e roll can be d ete c te d , a correction m ay be applied; this is b e st perform ed in th e processor.
A yaw error (rotation a b o u t the vertical axis) is m ore significant. It will displace th e a n te n n a fo o tp rin t away from the zero D oppler. T h e D oppler sp ectru m of the retu rn ed echo will be displaced by a frequency 6 f y . T h is can be corrected for in th e sensor, by m ixing a signal of frequency 8 f y w ith th e received echo, or in th e processor. As 8 f y is a function of look angle, th e correction is different for different p a rts of th e sw ath, m aking it easier to im plem ent in th e processor. A fter th e im age has been generated, th e im age pixel should be re-located to correct for th e sp atial displacem ent. T his is done in th e post-processor.


![Figure 4.1: Comparison of Optical and Radar Stereo Geometries. Following [LaPrade, 1963]](https://thumb-us.123doks.com/thumbv2/123dok_us/9162995.1454593/104.612.56.451.117.611/figure-comparison-optical-radar-stereo-geometries-following-laprade.webp)
