University of Pennsylvania
ScholarlyCommons
Publicly Accessible Penn Dissertations
Spring 5-17-2010
Hydrogen Release From Ammonia Borane
Daniel W. Himmelberger
University of Pennsylvania, [email protected]
Follow this and additional works at:http://repository.upenn.edu/edissertations
Part of theInorganic Chemistry Commons,Oil, Gas, and Energy Commons, and the Sustainability Commons
This paper is posted at ScholarlyCommons.http://repository.upenn.edu/edissertations/158
For more information, please [email protected].
Recommended Citation
Hydrogen Release From Ammonia Borane
Abstract
Development of a safe and efficient storage medium for hydrogen is integral to its use as an alternative energy source. The overall goal of the studies described in this dissertation was to investigate the use of a chemical hydride, ammonia borane (AB (19.6 wt% H2)), as a potentially efficient material for hydrogen storage. The specific goals of this study were both to develop new efficient methods for increasing the rate and extent of H2-release from AB and to elucidate the important mechanistic pathways and intermediates in these reactions. Significant achievements that resulted from this work are that AB H2-release is activated in the presence of either ionic liquids or bases. For example, an AB H2-release reaction carried out at 110 °C in 50 wt% ionic liquid liberated over 2 equivalents H2 in 15 minutes. Reducing ionic liquid loading to 20 wt% at 110 oC yielded a higher materials weight percent (11.4 mat wt%), while still having fast release rates: 2 equivalents in ~2.5 hours. The addition of the strong nitrogen base 1,8-bis(dimethylamino)naphthalene, Proton Sponge™, to ionic liquid solutions of AB increased the AB H2release rate at 85 °C, with over 2 equivalents of H2 achieved within 3 h. Additional Proton Sponge increased the rate of release; however, the mat wt% of H2 decreased since the Proton Sponge added significant weight to the system. Solid state and solution 11B NMR and DSC studies of reactions in progress allowed the identification of initial and final products in the H2-release reactions and helped elucidate the overall reaction pathway. The initial formation of diammoniate of diborane, the key intermediate in dehydropolymerization of ammonia borane, was promoted by the addition of ionic liquids. Subsequent H2-release resulted in the formation of
polyaminoborane then polyborazylene. Proton Sponge increased the release rate of the second equivalent of H2 by a newly proposed anionic polymerization mechanism. The final product was identified by solid-state 11B NMR and proved to be a sp2-framework of polyborazylene which formed regardless of base additive or amount/type of ionic liquid.
Degree Type
Dissertation
Degree Name
Doctor of Philosophy (PhD)
Graduate Group
Chemistry
First Advisor
Dr. Larry G. Sneddon
Keywords
ammonia borane, hydrogen, energy, fuel cell
Subject Categories
HYDROGEN RELEASE FROM AMMONIA BORANE
Daniel W. Himmelberger A DISSERTATION
in Chemistry
Presented to the Faculties of the University of Pennsylvania in
Partial Fulfillment of the Requirements for the Degree of Doctor of Philosophy
2010
Supervisor of Dissertation _____________________
Professor Larry G. Sneddon, Blanchard Professor of Chemistry
Graduate Group Chairperson _____________________
Professor Gary A. Molander, Hirschmann-Makineni Professor of Chemistry
Dissertation Committee
Professor Christopher B. Murray, Richard Perry University Professor of Chemistry Professor So-Jung Park, Assistant Professor of Chemistry
ABSTRACT
HYDROGEN RELEASE FROM AMMONIA BORANE
Daniel W. Himmelberger
Supervisor: Professor Larry G. Sneddon
Development of a safe and efficient storage medium for hydrogen is integral to its use as an alternative energy source. The overall goal of the studies described in this dissertation was to investigate the use of a chemical hydride, ammonia borane (AB (19.6 wt% H2)), as a potentially efficient material for hydrogen storage. The specific goals of
this study were both to develop new efficient methods for increasing the rate and extent of H2-release from AB and to elucidate the important mechanistic pathways and
intermediates in these reactions. Significant achievements that resulted from this work are that AB H2-release is activated in the presence of either ionic liquids or bases. For
example, an AB H2-release reaction carried out at 110 oC in 50 wt% ionic liquid liberated
over 2 equivalents H2 in 15 minutes. Reducing ionic liquid loading to 20 wt% at 110 oC
yielded a higher materials weight percent (11.4 mat-wt%), while still having fast release rates: 2 equivalents in ~2.5 hours. The addition of the strong nitrogen base 1,8-bis(dimethylamino)naphthalene, Proton Sponge™, to ionic liquid solutions of AB increased the AB H2-release rate at 85 °C, with over 2 equivalents of H2 achieved within
and solution 11B NMR and DSC studies of reactions in progress allowed the identification of initial and final products in the H2-release reactions and helped elucidate
the overall reaction pathway. The initial formation of diammoniate of diborane, the key intermediate in dehydropolymerization of ammonia borane, was promoted by the addition of ionic liquids. Subsequent H2-release resulted in the formation of
polyaminoborane then polyborazylene. Proton Sponge increased the release rate of the second equivalent of H2 by a newly proposed anionic polymerization mechanism. The
Table of Contents
Title Page i
Abstract ii
Table of Contents iv
List of Tables ix
List of Figures xi
List of Equations xvi
Chapter 1. The Hydrogen Economy: Benefits, Problems, and Possible Solutions
Summary 1
1.1 We Use More than We Make! 2
1.2 Push for a Hydrogen Economy 4
1.2.1 Why Do We Need a Hydrogen Economy? 4
1.2.2 What are the Barriers to a Hydrogen Economy? 5
1.2.2.1 Hydrogen Production 6
1.2.2.2 Hydrogen Delivery 6
1.2.2.3 Hydrogen Storage 7
1.2.3 The Chemical Hydrogen Storage Center of Excellence 9
1.3 What is Ammonia Borane? 11
1.3.1.2 The Better Hydrogen Release Method: Thermolysis. 18
1.3.2 Ammonia Borane Solid-State H2-Release 19
1.3.3 Activated AB H2-Release from AB 23
1.3.3.1 Mesoporous Scaffolds Aid in Solid-State H2-Release 23
1.3.3.2 Acid Catalyzed Hydrogen Release Reactions 24 1.3.3.3 Using Transition-Metal Catalysis to Enhance
Release Rate and Extent.
26
1.3.3.3.1 Heterogeneous Transition-Metal Catalysts 26 1.3.3.3.2 Homogeneous Transition-Metal Catalysts 28 1.3.3.3.2.1 Iridium Pincer Catalyst 28 1.3.3.3.2.2 Nickel Carbene Catalyst 31 1.3.3.3.2.3 Titanocene Catalyst 35 1.3.3.3.2.4 Transition-Metal Catalysis in
Hydrolysis/Methanolysis
37
1.3.4 Large Scale Preparations of Ammonia Borane. 38
1.3.5 Recycling the AB Fuel Source. 39
1.3.6 Hybrid Materials Try to Bridge the Gap Between AB and
Metal Hydrides.
40
1.4 Conclusions 42
Chapter 2. Ammonia Borane Hydrogen Release in Ionic Liquids
Summary 51
2.1 Introduction 52
2.2 Experimental Section 53
2.2.1 Materials 53
2.2.2 Physical Measurements 53
2.2.2.1 H2-Release Measured On a Toepler Pump 53
2.2.2.2 H2-Release Measured On an Automated Gas Burette 54
2.2.2.3 Procedures for 11B NMR Studies of Reaction Products
76
2.3 Results and Discussion 77
2.3.1 Why Use Ionic Liquids? 77
2.3.2 Procedures for AB H2-release reactions 80
2.3.3 Solid-State vs. Ionic Liquid H2-Release 81
2.3.4 11B NMR Characterization of Reaction Products and Pathways
93
2.3.4.1 11B NMR of Pyridine Extracts from Reaction Products
93
2.3.4.2 Solid-State 11B NMR Studies 96
2.3.4.3 In Situ 11B NMR Studies in Ionic Liquids 96 2.3.6 Why do Ionic Liquids Accelerate AB H2-release? What is the
Role of DADB?
2.3.7 H2-Release Reactions in Tetraglyme 108
2.4 Conclusions 111
2.5 References 112
Chapter 3. Base Promoted Ammonia Borane Hydrogen Release
Summary 116
3.1 Introduction 117
3.2 Experimental Section 119
3.2.1 Materials 119
3.2.2 Physical Measurements 119
3.2.3 Procedures for AB H2-Release Reactions 121
3.2.4 Computational Methods 122
3.3 Results and Discussion 126
3.3.1 H2-Release from AB/PS Solid-State Reactions 126
3.3.2 H2-Release from AB/PS Solution Reactions 132
3.3.2.1 Initial Reactions Measured with the Toepler Pump 132 3.3.2.2 H2-Release Reactions Measured with the Automated
Gas Burette 136
3.3.3 11B NMR Studies of Reaction Pathways and Intermediates 141
3.3.3.1 Solid-State 11B NMR Studies 141
3.3.3.2 In Situ 11B NMR Studies of Reaction Progress in Ionic Liquids
3.3.4 Proton Sponge Reduces Foaming During AB Thermolysis 146 3.3.5 H2-Release in Other Ionic Liquids and Tetraglyme 147
3.3.6 Why Does Proton Sponge Induce H2-Release from AB? 151
3.4 Conclusions 158
List of Tables
Chapter 2
Table 2.1 AB H2-Release Data Collected on the Automated Gas Burette from the
H2-Release Reaction of a Solid-State AB Sample at 85 oC
57
Table 2.2 Times to Selected Equivalent Points of H2-Release (Gas Burette) of
Ionic Liquid and Solid-State Reactions at 85 oC
83
Table 2.3 Times to Selected Equivalent Points of H2-Release (Gas Burette) of
50-wt% AB (150 mg) in BmimCl (150 mg) at Different Temperatures
85
Table 2.4 Times to Selected Equivalent Points of H2-Release (Gas Burette) of AB
(150 mg) in 20.2-wt% BmimCl (38 mg) at Different Temperatures
87
Table 2.5 H2-Release Data (Toepler pump) for AB/Ionic-Liquid (50-wt%)
Reactions at 85 °C
88
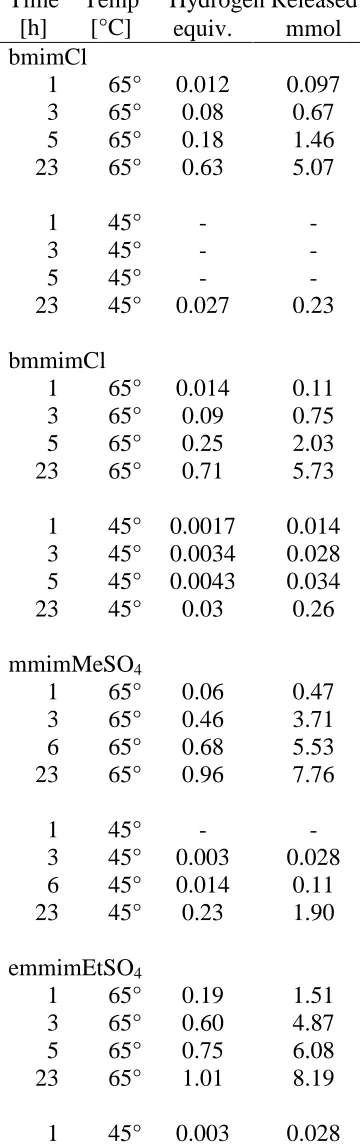
Table 2.6 H2-Release Data (Toepler pump) for AB/Ionic-Liquid (50-wt%)
Reactions at 65 and 45 °C
91
Table 2.7 Times to Selected Equivalent Points of H2-Release (Gas Burette) of
bmimOTf (450 mg) and 10-wt% (50 mg) each of: (A) DADB and (B) AB at 85 oC 105
Table 2.8 Times to Selected Equivalent Points of H2-Release (Gas Burette) of
50-wt% AB (150 mg) in Tetraglyme (150 mg) at Different Temperatures
109
Chapter 3
Table 3.1 Cartesian Coordinates for [H3BNH2]– 123
Table 3.2 Cartesian Coordinates for Straight Chain
[H3BNH2BH2NH2BH2NH2BH2NH2]–
Table 3.3 Cartesian Coordinates for Branched Chain
[HB(NH2BH3)2NH2BH2NH2]–
124
Table 3.4 Cartesian Coordinates for Branched Chain
[H3BNH2BH2(BH2NH3)NHBH2NH2]–
125
Table 3.5 Cartesian Coordinates for [H3BNH2BH2NH2BEt3]– 125
Table 3.6 H2-Release Data (Toepler pump) for AB/PS Solid-State Reactions at 85
°C
129
Table 3.7 H2-Release Data (gas burette) for AB/PS Solid-State Reactions at 85 °C 129
Table 3.8 H2-Release Data (Toepler pump) for AB/BmimCl/PS Reactions at 85 °C 133
Table 3.9 H2-Release Data (gas burette) for AB/bmimCl/PS Reactions 137
Table 3.10 H2-Release (Toepler pump) Data for Partially Dehydrogenated AB 140
Table 3.11 H2-Release Data (Toepler pump) for AB/Ionic-Liquid/PS Reactions at
85 oC
148
Table 3.12 H2-Release Data (gas burette) for AB/Tetraglyme/PS Reactions at 85 o
C
List of Figures
Chapter 1
Figure 1.1 Energy demand by sector and supply by source for 2008. 3 Figure 1.2 Simple schematic diagram of a PEM fuel cell. 4 Figure 1.3 Total system targets from DOE Center of Excellence. 9 Figure 1.4 Select amine boranes discussed in the following Chapters. 11 Figure 1.5 Low temperature (orthorhombic) crystal structure of AB. Nitrogen,
boron, and hydrogen atoms are depicted in blue, purple, and gray, respectively.
12
Figure 1.6 Schematic energy profile of the conversion of 2 AB to DADB. 15 Figure 1.7 Schematic energy profile of the dehydrogenation of DADB. 17 Figure 1.8 Comparison of thermogravimetric and volumetric data at 5 K/min of
AB thermolysis.
20
Figure 1.9 Solid-State hydrogen release data for AB at 85 and 95 oC. 20 Figure 1.10 11B NMR (128.4 MHz) spectra recorded at 20 oC. Pyridine extract of a solid-state AB reaction at 85 oC after 19 h with 0.83 equivalents of H2-released.
22
Figure 1.11 DFT/GIAO calculated 11B NMR shifts for possible dehydropolymerization products.
23
Figure 1.12 Baker’s nickel carbene catalyst with 11B NMR showing final products.
32
Figure 1.13 Schematic energy profile of the nickel carbene catalyst using the
carbene as a proton abstractor.
33
Chapter 2
Figure 2.1 Toepler pump system used for H2-release measurements. 54
Figure 2.2 Automated gas burette used for H2-release measurements. 55
Figure 2.3 Structures of ionic liquids used in these studies. 80 Figure 2.4 H2-release measurements (gas burette) at 85 oC of: (A) 50-wt% AB
(150 mg) in bmimCl (150 mg,) and (B) solid-state AB (150 mg).
82
Figure 2.5 H2-release measurements (gas burette) of 50-wt% AB (150 mg) in
bmimCl (150 mg) at various temperatures.
85
Figure 2.6 H2-release measurements (gas burette) of AB (150 mg) in 20.2-wt%
bmimCl (38 mg) at various temperatures.
86
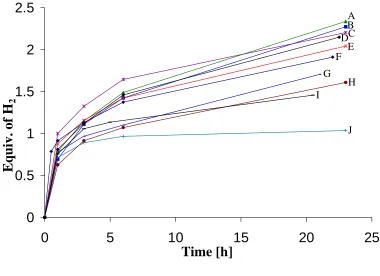
Figure 2.7 H2-release measurements (Toepler pump) of the reaction of 50-wt%
AB (250 mg) at 85 oC in 250 mg of with various ionic liquids.
88
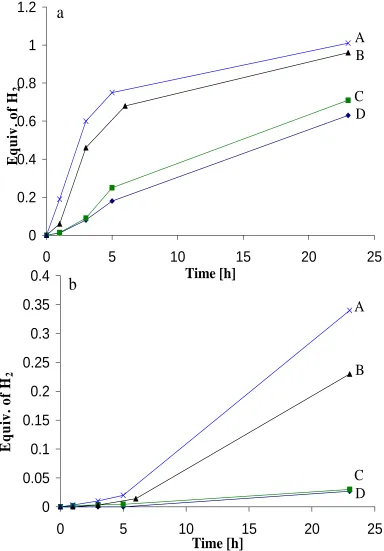
Figure 2.8 H2-release measurements (Toepler pump) of the reaction of 50-wt%
AB (250 mg) in 250 mg of various ionic liquids at (a) 65 oC and (b) 45 oC.
90
Figure 2.9 Above: Solution 11B NMR (128.4 MHz) spectra of the residues (extracted in pyridine) of the 85 oC reaction of solid-state and ionic liquids with AB.
94
Figure 2.10 Solid-state 11B NMR (240 MHz) spectra recorded at 25 oC of the reaction of 50-wt% AB (150 mg) in bmimCl (150 mg) at 110 °C.
95
Figure 2.11 Solution 11B NMR (128.4 MHz) spectra recorded at 25 oC of the reaction of 10-wt% AB (50 mg) in bmimOTf (450 mg) at 85 °C.
Figure 2.12 1,3-dimethylimidazolium hexafluorophosphate with 0.5 mol benzene
included as a clathrate.
99
Figure 2.13 Solution 11B NMR (128.4 MHz) of the reaction of 10-wt% AB (50 mg) in bmimOTf (450 mg) at 85 °C for 6 h at various temperatures
101
Figure 2.14 Solution 11B NMR (128.4 MHz) spectra recorded at 25 oC of 10-wt% borazine (50 mg) in bmimI (450 mg) after at various times.
102
Figure 2.15 H2-release measurements (gas burette) of bmimOTf (450 mg) and
10-wt% (50 mg) of DADB and AB.
105
Figure 2.16 Solution 11B NMR (128.4 MHz) spectra recorded at 25 oC of the reaction of 10-wt% DADB (50 mg) in bmimOTf (450 mg) at 85 °C.
106
Figure 2.17 Possible pathway for ionic-liquid promoted H2-release from AB. 107
Figure 2.18 H2-release measurements (gas burette) of 50-wt% AB (150 mg) in
tetraglyme (150 mg) at various temperatures.
109
Figure 2.19 Solution 11B{1H} NMR (128 MHz) spectra recorded at 80 oC of the reaction of 10-wt% AB (50 mg) in tetraglyme (450 mg) at 85 °C.
110
Chapter 3
Figure 3.1 H2-release measurements for solid state AB reactions with Proton
Sponge at 85 °C using the Toepler pump and gas burette.
128
Figure 3.2 11B{1H} NMR (128.4 MHz) spectra recorded at 25 oC of the glyme extract of the reaction of solid-state AB with and without Proton Sponge.
Figure 3.3 Solid-state 11B NMR (240 MHz) spectra recorded at 25 oC of the reaction of solid-state AB reactions with and without Proton Sponge after 1 equivalent was released.
131
Figure 3.4 H2-release measurements (Toepler pump) of the reaction of AB in
bmimCl with Proton Sponge at 85 °C.
132
Figure 3.5 Differential Scanning Calorimetry analyses of the reactions of AB in
bmimCl with Proton Sponge at various temperatures.
135
Figure 3.6 H2-release measurements (gas burette) of the reaction of AB in bmimCl
with Proton Sponge at various temperatures.
138
Figure 3.7 H2-release measurements (gas burette) of partially dehydrogenated AB
where 1 H2-equivalent was initially released at 85 oC, then bmimCl and
bmimCl/Proton Sponge were added to separate samples and heating resumed at 85
o
C.
139
Figure 3.8 Solid-state 11B NMR (240 MHz) spectra recorded at 25 oC of the reaction of AB and Proton Sponge in bmimCl at 85 °C.
142
Figure 3.9 DFT optimized geometries (B3LYP/6-31G(d)) and GIAO calculated
(B3LYP/6-311G(d)) 11B NMR chemical shifts.
143
Figure 3.10 Solid-state 11B NMR (240 MHz) spectrum recorded at 25 oC of the reaction of AB and Proton Sponge in bmimCl at 85 °C for 23 h.
144
Figure 3.11 Solution 11B NMR (128 MHz) spectra recorded at 25 oC of the reaction of AB in mmimMeSO4 at 85 °C with and without Proton Sponge.
Figure 3.12 Foaming resulting from the reaction of 250 mg AB in 250 mg
bmimCl after 1 h at 100 oC with and without Proton Sponge.
146
Figure 3.13 H2-release measurements (Toepler pump) of the reaction of AB in
ionic liquids or tetraglyme with Proton Sponge at 85 °C.
147
Figure 3.14 Solution 11B{1H} NMR (128 MHz) spectra recorded at 80 oC of the reaction of AB and Proton Sponge in tetraglyme at 85 °C.
150
Figure 3.15 Selected bond distances (Å) and angles (o) for [Et3BNH2BH3]−
K+•18-crown-6.
153
Figure 3.16 Possible anionic polymerization pathway for PS-promoted H2-release
from AB.
155
Figure 3.17 DFT (B3LYP/6-31G(d)) optimized geometry and GIAO
(B3LYP/6-311G(d)) calculated 11B NMR shifts for [Et3BNH2BH2NH2BH3]−.
List of Equations
Chapter 1
1.1 Fuel cell half reactions 5
1.2 Methane reforming for H2 production 6
1.3 Ammonia borane hydrolysis 18
1.4 Ammonia triborane hydrolysis 18
1.5 Ammonia borane thermolysis 19
1.6 Acid catalyzed AB H2-release mechanism 25
1.7 Colloidal rhodium catalyzed AB H2-release mechanism 27
1.8 Generic homogeneous catalyzed AB H2-release mechanism 29
1.9 Iridium pincer catalyzed AB H2-release using 16 e- mechanism 30
1.10 Difference between iridium and other homogenous catalyst mechanisms 31 1.11 Nickel carbene catalyzed AB H2-release mechanism 35
1.12 Calculated titanocene catalyzed AB H2-release mechanism 36
1.13 Experiemntally predicted Titanocene catalyzed AB H2-release mechanism 37
1.14 Ammonia borane production from NaBH4 and (NH4)2SO4 38
1.15 Ammonium borohydride production from NaBH4 and NH4Cl 38
1.16 Decomposition ammonium borohydride to form ammonia borane 38
1.17 Spent fuel regeneration scheme 39
Chapter 2
2.1 Ammonia borane thermolysis 52
diborane
2.3 Thermolytic H2-release from diammoniate of diborane 103
Chapter 3
3.1 Ammonia borane dehydrogenated with lithium amide 117
3.2 Ammonia borane dehydrogenated with lithium hydride 117 3.3 Lithium amidoborane undergoing dehydropolymerization with ammonia
borane
118
3.4 Lithium amidoborane decomposition into aminoborane 118
3.5 Formation of side-product lithium borohydride 118
3.6 Proton Sponge protonation 151
3.7 Ammonia borane studies with lithium and potassium triethylborohydride 152 3.8 Ammonia borane chain growth studies with lithium and potassium
triethylborohydride
Chapter 1
The Hydrogen Economy: Benefits, Problems, and Possible Solutions
Summary
The overall goal of the studies described in this dissertation was to investigate the use of a chemical hydride, ammonia borane (AB), as a potentially efficient material for hydrogen storage. The specific goals of this study were both to develop new efficient methods for increasing the rate and extent of H2-release from AB and to elucidate the
important mechanistic pathways and intermediates in these reactions. Chapter 1 discusses the need for a chemical hydrogen storage system, and more generally, the need for a paradigm shift from hydrocarbons to a hydrogen economy. Chapter 2 demonstrates that AB/ionic liquid based H2-release systems show increased activity for
H2-release compared to neat AB. Furthermore, it is also shown that these reactions can
1.1 We Use More than We Make!
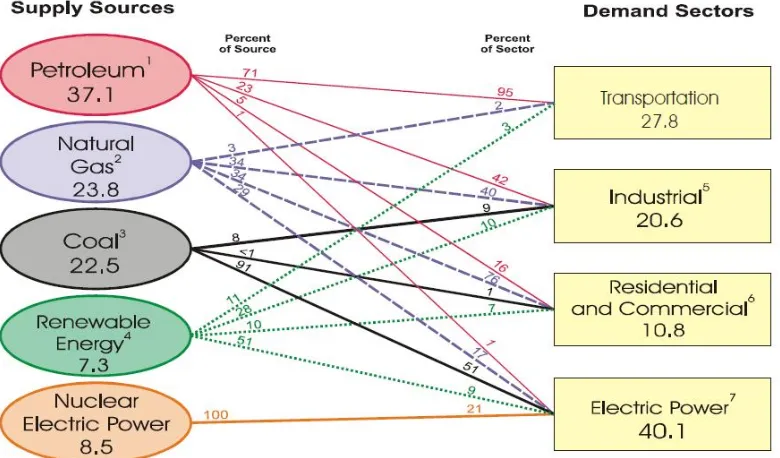
As discussed in the 2008 Annual Energy Review generated by the Department of Energy,1 worldwide consumption of energy continues to rise while global production of energy struggles to keep pace. In the United States, most of the energy consumed is used in the form of electric power. However, the second largest consumption sector is transportation at 27.8% in 2008. Energy sources used for transportation include, petroleum, natural gas, and biofuels, but 95% of the consumed energy is from petroleum. Domestic production has not been able to keep up with demand for decades; production of crude oil has slowly declined since its peak in 1970. Therefore, importation of petroleum has increased to keep pace with consumption demands. The United States currently imports (12.9 million barrels per day) twice the petroleum it produces (6.7 million barrels per day).
Looking at the breakdown of petroleum consumption in the United States, most is used in the transportation sector (71%, Figure 1.1), and of that most petroleum is used for light vehicles (i.e. cars and light trucks).1 Oil reserves will inevitably run out and fuel prices will continue to rise. To match current and future energy needs, a new energy carrier is needed. Additional reasons for phasing out the use of petroleum as a transportation energy carrier are the negative effects of global warming caused by the CO2 produced by petroleum combustion and the danger to United States national security
1.2 Push for a Hydrogen Economy
1.2.1 Why Do We Need a Hydrogen Economy?
In 2003, President George W. Bush announced the hydrogen fuel initiative that had as its goals the development of new technology for the production, storage, and distribution of hydrogen. The ultimate goal was to make fuel cell powered cars competitive by 2020. In order to accomplish this goal, the hydrogen economy must be as good, if not better, than the current hydrocarbon based energy economy. Hydrogen as an energy carrier has many benefits, the biggest being as a fuel source for fuel cells.
A Proton Exchange Membrane (PEM) fuel cell (Figure 1.2) operates by oxidizing molecular hydrogen and allowing the protons to migrate through the membrane while the electrons are shuttled out to do work by the catalytic electrodes. The protons recombine on the other side of the membrane with reduced molecular oxygen, typically from the air, to form water,3 as shown in the half reactions in Equation 1.1.
Fuel cells have two to three times the efficiency of internal combustion engines and can be designed to power a broad spectrum of sizes of applications from a watch to a building. Additionally, the only product from fuel cells when using hydrogen as a fuel is water.
1.2.2 What are the Barriers to a Hydrogen Economy?
1.2.2.1 Hydrogen Production
Most hydrogen (95%) is currently produced from natural gas reforming via high temperature steam. The generic reaction is given in Equation 1.2 where steam at temperatures from 700 oC to 1000 oC is used to split the methane into carbon monoxide and hydrogen.4
If hydrogen is produced from hydrocarbons or other fossil fuels like coal, then we are still: relying on foreign sources, quickly depleting hydrocarbon fuel sources, and producing large amounts of carbon monoxide. Other production methods are necessary in order to create an environmentally friendly, secure hydrogen energy supply. Biomass or water electrolysis using electricity from nuclear or renewable sources, such as wind and photovoltaics, must be employed to efficiently produce the hydrogen to make the hydrogen economy viable. While these sources are still being developed, a great deal of progress has recently been made especially in the area of water splitting. The Nocera lab has been a leader in developing self-regenerative water-splitting catalysts.5 These types of new technologies are necessary to make the implementation of a hydrogen economy possible.
1.2.2.2 Hydrogen Delivery
and therefore transportation of gas or solid fuels would be necessary. The type of delivery system is heavily dependent on the storage method used.
1.2.2.3 Hydrogen Storage
The Department of Energy (DOE) originally setup a series of metrics2 that hydrogen would have to meet or exceed for it to become economically viable as a gasoline equivalent. These goals included the need for the fuel cell vehicle to have greater than a 300 mile range, with the fuel delivered at an equivalent cost to gasoline, as well as durability of the fuel cell and the over all system. Important requirements for hydrogen-based systems are that they operate over the wide variety of environments in which gasoline operates. Fuel cell systems must work in -20 oC temperatures and survive -40 oC, while not breaking down at temperatures that exceed 50 oC.
systems. The higher the pressure being stored, the more dangerous tank imperfections are. Likewise the durability of the tanks in vehicular collisions is a real danger.
A second method for storing hydrogen is in the liquid phase which gives much lower pressures for storage, as well as a higher energy density. To compare compressed gas versus liquid hydrogen; a 10,000 psi tank of compressed hydrogen has a hydrogen density of ~56 kg/m3, whereas the same volume tank of liquid hydrogen would only be ~670 psi with a density of ~68 kg/m3. However, this technology is impractical due to the higher energy costs necessary to liquefy hydrogen and the cryogenic tanks necessary to maintain it as a liquid. For these reasons, the energy input is greater than the efficiency gained by a higher energy density.
The third storage method is to utilize materials and compounds, that is, chemical hydrides, for storage. Chemical hydrides can have a higher energy density for H2 storage
1.2.3 The Chemical Hydrogen Storage Center of Excellence
In order to comprehensibly investigate the three materials-based storage methods, the DOE setup Centers’ of Excellence to work on each of these materials. As summarized in Figure 1.3, the DOE set specific goals, the main one being total system weight percent of 9.0 % by 2015.2 To clarify, the total system weight percent is the weight of hydrogen produced, divided by the weight of the fuel system including tanks, heaters, tubing, release compound and solvents. On the other hand, materials weight percent, is just the weight of hydrogen released divided by the weight of the compound
system (including possible solvent and catalyst) doing the release. To achieve a target total system weight percent, the material weight percent must be much higher so that additional weight for tanks, etc. can be factored in. Other goals such as volumetric density, flow rate, and initial rate also have metrics set by the DOE. All of theses goals were set based on the needs of fuel cells powering a vehicle for a 300 mile range and that the H2-storage container should not be significantly larger that the existing gasoline tank.
Target
2015
old
System Gravimetric Density
[wt.%] (kWh/kg)
[9]
(3.0)
System Volumetric Density
[g/L] (kWh/L)
[81]
(2.7)
System fill time for 5-kg fill
[min] (kgH
2/min)
[2.5]
(2.0)
System cost [$/kgH
2]
($/kWh
net)
[67]
(2)
1.3 What is Ammonia Borane?
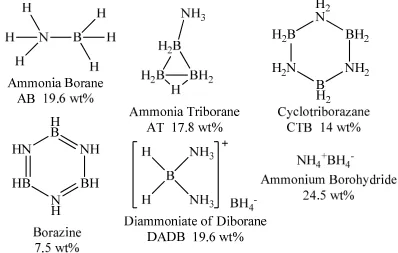
After the initial 2003 Hydrogen initiative was announced, amine boranes were identified as an excellent hydrogen storage material candidate. Amine boranes’ high hydrogen densities, for example 24.5 materials weight percent (mat. wt.%) for ammonium borohydride, 19.6 mat. wt% for AB, and 17.8 mat. wt.% for ammonia triborane, were the primary attribute that made these materials attractive. The structures and abbreviations of the compounds are shown in Figure 1.4. The other attractive property of amine boranes comes from the different electronegativities of B(2.04) and N(3.04) that result in protonic N-H and hydridic B-H hydrogens. Thus, the elimination of H2 by the reaction of B-H- and N-H+ is favorable.
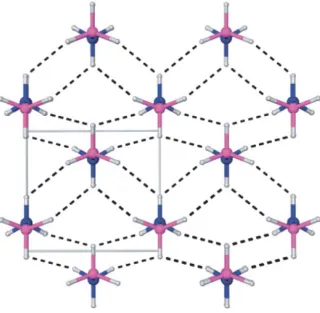
Figure 1.5 Low temperature (orthorhombic) crystal structure of AB. Nitrogen, boron, and hydrogen atoms are depicted in blue, purple, and gray, respectively.30
X-ray powder diffraction of AB.32 The correct structures of AB and DADB were elucidated in a series of papers by Parry and Shore in 1958.33 Work continued in these groups through the 1960s further defining the properties.
Ammonia borane is a colorless solid that melts at 110 oC – 114 oC, but is stable at room temperature. There are several methods of producing AB that will be discussed in section 1.3.4. It is soluble in a variety of polar solvents, including ammonia (260 g/ 100 g solvent), water (33.6 g/ 100 g solvent), and tetrahydrofuran (25 g/ 100 g solvent). Both X-ray and neutron diffraction studies have been used to determine the solid-state structure of AB. AB has a staggered conformation with a B-N bond distance of 1.564(6) Å. The gas phase calculations determined the B-N bond distance to be 1.6722(5) Å. Solid-state AB shows close BH---HN distances of 2.02 Å on adjacent molecules which is inside the Van der Waals distance of 2.4 Å indicating strong dihydrogen bonds (Figure 1.5). Due to the dihydrogen bonding, a stabilization energy of 90.4 kJ/mol is added
making AB a solid.34 This gives AB a much higher volumetric density than ethane, its isoelectronic carbon analogue.
The diammoniate of diborane (DADB, [BH2(NH3)2]+BH4-) is the ionic dimer of
AB where the cation is comprised of a NBN motif with the terminal ammonia groups forming dative bonds with the BH2+ unit while the anion is a borohydride group. DADB
does not have a melting point, but decomposes at 80 oC to give similar decomposition products, in general, as AB. DADB is insoluble in ethers and hydrolyzes readily in water and will slowly split off hydrogen at room temperature. Shultz, Parry, and Shore were the first to correctly identify33 the structure of DADB as [H3NBH2NH3]+[BH4]- and not
The first reactions were with sodium which, when reacted with DADB, formed sodium borohydride and not the complex salt Na[H3BNH2BH3].
Another interesting property of DADB is the stabilizing effect of the cation on the borohydride anion. Lithium borohydride salts reacts vigorously with water, whereas the DADB reaction is not nearly as violent. Reaction of DADB with lithium halide salts increased the proton sensitivity on the borohydride as evidenced by increased H2-release.33 The standard DADB preparation is to bubble diborane through liquid
ammonia held at -78 oC. DADB can also be made in organic solvents; however, the yields are reduced. Regardless of the solvent used, the reaction is highly temperature sensitive and if the solvent is warmer, the product ratio shifts towards the side product, AB.37 If pure DADB is placed in complex ethers such as glyme, it will slowly convert to AB almost cleanly.38 The IR spectrum of DADB has also been tentatively assigned.39
AB dehydrogenation is exothermic. The Dixon group and collaborators have calculated detailed reaction pathways starting from 2 AB molecules through the formation of DADB and subsequent hydrogen loss from DADB.40 They also used coupled cluster (CCSD(T)) level calculations to show that breaking the B-N bond is the easiest AB decomposition method. This had serious implications for a reaction mechanism where the easiest bond breakage formed free ammonia and borane moieties.41
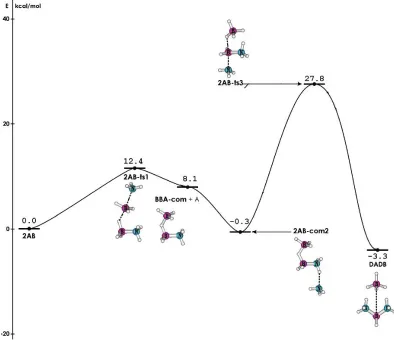
Figure 1.6 shows an energy profile calculated by the Dixon group. Starting with
ammonia associates with the protonic N-H of the other AB the energy drops 0.3 kcal/mol below the starting point. The second transition state involves abstraction of the hydride by the free borane and association of the free ammonia with the now positively charged borane. This transition state lays 27.8 kcal/mol above the starting point. The ionic dimer of AB, DADB, forms from this transition state and is 3.3 kcal/mol more stable than the two starting AB molecules.
To then release hydrogen from DADB, the Dixon group calculated the energy profile, Figure 1.7, where the boron and hydride from the borohydride associates with the protonic N-H with concomitant H2-release and formation of the B-N bond. They then
calculated that the most favorable conformation is cis so that the boron and nitrogen can associate. Further monomer addition and dehydrogenation yield products such as CTB (∆Hfo = -120.5 kcal/mol (solid)) and borazine (∆Hfo = -122.6 kcal/mol (liquid)).42 The
∆H of the reaction of three AB going to form CTB with the release of three H2 was
calculated to be -55.9 kcal/mol at 298 K. The subsequent release of another three H2 to
form borazine was calculated to be -18.9 kcal/mol at 298 K.42 Nguyen also calculated a reaction plot using free borane as a catalyst where the products were H2, borane (which
continued catalyzing the reaction), and aminoborane. Aminoborane is a highly reactive species that was implicated by others in the overall AB reaction scheme.41 These proposed mechanisms explain the reason a significant amount of ammonia is released during solid-state AB reactions.
The abstraction of a proton from AB to form the H3BNH2- anion was calculated to
Figure 1.7 Schematic energy profile of the dehydrogenation of DADB.40
1.3.1 How to Release Hydrogen from Ammonia Borane?
There are two main methods to release hydrogen from a chemical hydride; hydrolytically and thermolytically. The requirements for hydrogen release for utilization in vehicles powered by fuel cells are fast, controlled, and complete release. The hydrogen needs to be fast enough to power fuel cells in times of acceleration when more energy is needed. The H2-release also needs to be both controllable so that it can be
1.3.1.1 Utilizing Hydrolysis to Release Hydrogen.
The area that received the most attention early was AB hydrolysis. General reactions for amine borane hydrolysis are given in Equations 1.3 and 1.4.
Ammonia borane will undergo hydrolysis only very slowly at room temperature in basic water, but the rate is accelerated by lowering the pH or increasing the temperature. Most of the research in this area has focused on the search for transition-metal catalysts to increase the rate of AB-hydrolysis. Utilization of catalysis
44-64
can lower the H2-release temperature to room temperature. Metal catalyzed hydrolysis
can give ultra-fast hydrogen release, often in seconds, with very controllable rates. This method also drives the dehydrogenation of AB to near completion, with ~3 equivalents released. Nonetheless, the use of hydrolysis as a method for hydrogen delivery in a fuel cell powered car is impractical for several reasons. AB is only moderately soluble in water and consumes 2 waters per AB so that despite a theoretical materials weight percent of 9 %, only ~5 % materials weight percent is possible. Regeneration of the spent fuel is another reason hydrolytic hydrogen release is not going to be used in vehicle fuel cells due to the difficulty of reducing B-O bonds. More about fuel regeneration will be discussed later. While this technology has great promise in certain areas such as emergency power backup, it is too inefficient to work in the transportation sector.
1.3.1.2 The Better Hydrogen Release Method: Thermolysis.
much higher material weight percent, as shown in the general reaction for AB thermolysis given in Equation 1.5.
1.3.2 Ammonia Borane Solid-State H2-Release
Wolf65,66 first showed that there are two exothermic H2-release events associated
with the decomposition of AB. The first event starts at ~70 oC when heating at 1 K/min but ~100 oC at 5 K/min. The endotherm directly before the first exotherm centered at ~100 oC is attributed to the melting of AB. The second event is much broader and starts at ~130 oC before the first event is finished. Comparing volumetric H2-release and
thermogravimetric analysis (Figure 1.8), the two release events become clear as does a disparity. The thermogravimetric curves indicate more mass loss than the volumetric curve. This is attributed to other volatile gases being formed besides H2 and the gap
increases as the heating rate increases.65 According to Autrey, raising the temperature of reaction can release potentially all three equivalents from AB taking >500 oC.67 Most research in AB hydrogen release has focused on increasing the extent of release as well as the rate.
While thermolysis is a simple system and hence has many benefits for engineering an end use system, there are a host of difficulties associated with solid-state reactions. There are four major problems with solid-state H2-release reactions illustrated
Figure 1.8 Comparison of thermogravimetric and volumetric data at 5 K/min of AB
thermolysis.65
The first is an induction period where, it has been proposed,68 the AB is slowly converting to the DADB, the active intermediate and ionic dimmer of AB discussed in depth in Chapter 2, with H2-release not beginning until after 3 hours at 85 oC. The
conversion of AB to DADB releases no hydrogen. The second major issue is the slow rate of H2-release. Once dehydrogenation starts, it takes hours to get to one equivalent.
The third is, as discussed above, AB can release 3-H2 when heated above 500 oC, but this
would require heaters to raise the temperature thus adding weight and complexity to the system as well as requiring energy to power the heaters. A proton exchange membrane fuel cell’s waste heat is ~85 oC, so to avoid the need for heaters, the most efficient systems for AB H2-release should be designed to operate near 85 oC. However, at 85 oC,
less than one third (one equivalent) of the hydrogen is released from solid-state AB. These three problems seriously limit the practical uses of solid-state AB reactions for transportation since fast rates as well as high wt% H2-materials are needed. The fourth
major issue is the products that form during the dehydrogenation reaction are diverse which can cause problems in regenerating the spent fuel.
In order to better understand the reaction pathways the products of these reactions were studied. The large product distribution coupled to the insolubility of some of the products made analysis difficult. Initially, pyridine extracts of reactions in progress were analyzed using 11B NMR. A typical 11B NMR spectrum for one of these extracts after the release of 1 equivalent is shown in Figure 1.10. At least 5 different resonances can be observed. Geanangel was the first to do comprehensive studies of the thermal decomposition of AB and proposed the formation of polyaminoboranes (NH2BH2)x as the
Figure 1.11 indicate that the 11B shifts at -12 and -23 ppm correlate with the BH2 and
BH3 of the linear polymer. The signal at -5 ppm is in good agreement with the calculated
shift of the BH unit of a branched chain polyaminoborane (Figure 1.11). The 12 and -36 ppm signals correlate with the cation and anion of DADB respectively.33,71 Lastly, the small signal at 30 ppm is characteristic of unsaturated B-N bonds and could be either unsaturated polyaminoborane (Figure 1.11) or borazine.72-74 Poorly defined products made it difficult to determine the best catalyst to use to improve the rate and extent of H2-release. The diverse product distribution has other ramifications, namely with the
regeneration of spent fuel research, that will be discussed later in section 1.3.6.
Figure 1.11 DFT/GIAO calculated 11B NMR shifts for possible dehydropolymerization products.
1.3.3 Activated AB H2-Release from AB
1.3.3.1 Mesoporous Scaffolds Aid in Solid-State H2-Release
Mesoporous scaffolds have been shown to activate AB H2-release and have
achieved faster release rates, lower H2-release temperatures, and better product control.
There are four main types of scaffolds: carbon cryogels,19,22,25-27 mesoporous silica,20,21,24,28 zeolites,29 and metal-organic frameworks.23 The carbon scaffolds were explored both with AB and AB/metals intercalated into them. One type of carbon scaffold, mesoporous carbon, is somewhat acidic and was shown to enhance reaction rates and lower temperatures due to the acidity or the proximity of another AB unit. It was also shown that the addition of lithium to this scaffold ‘scrubs’ the gas stream by removing NH3,22 a potential fuel cell killer. All of the carbon based mesoporous
-13.8 ppm -5.9 ppm -22.4 ppm
-26.9 ppm
+30.4 ppm -8.8 ppm
+33.2 ppm -8.7 ppm
+39.3 ppm -23.0 ppm
-9.5 ppm
-11.4 ppm
-10.4 ppm
affected by pore size where the smaller the pore size, the lower the activation energy. Like the lithium doped scaffold that removed ammonia, non-metal doped AB-carbon scaffolds suppress the formation of borazine, another potential fuel cell killer.19,25-27 Mesoporous silica showed similar reaction rates and volatile-elimination improvements as its carbon analogues.20,21,24,28 Autrey et al. used SBA-15 and methanol to get a 1:1 ratio of AB and mesoporous silica. Subsequent reaction resulted in a 15 oC reduction in onset temperature for dehydrogenation.20 Carbon cyrogels have the advantage of being slightly easier to synthesize. Unfortunately, thermolysis of these materials only lends ~7 materials weight percent due to the excessive weight of the scaffold.
The other two mesoporous materials, zeolites and metal-organic frameworks, were used differently than the carbon and silica scaffolds. In the case of zeolites, research focused on using them as supports for metal nanoclusters. Zahmakiran et al. showed that reduction of Rh(III) onto the zeolite backbone can significantly enhance the catalytic activity during hydrolysis.29 Similarly, metal-organic frameworks perform well as hydrolysis catalysts.23 The resiliency of these materials was far greater than normal heterogeneous catalysts in hydrolysis; however, as stated previously, hydrolysis cannot achieve the overall total system weight goals.
1.3.3.2 Acid Catalyzed Hydrogen Release Reactions
Only limited research has gone into studying the acid catalyzed H2-release from
catalyze the dehydrocoupling of Me2NHBH3,76 Stephens showed that it catalyzed
H2-releases from AB.77
H3N BH3 H3N BH2 H3N BH2
NH3 H2 B H H2 N H2B H
H B H
H NH3 H2B
H2 N
H
BHNH3
-H2 A H3N BH3
(1.6)
It was found that the amount of acid dramatically changed the reaction pathway. The proposed mechanism is cationic (Equation 1.6) and started with hydride abstraction followed by association of AB and subsequent H2-release and formation of a cationic
ammonia-substituted µ-aminodiborane. With low acid concentration (≤1 mol%), more hydrogen was released and cationic dehydropolymerization continued. However, at high acid loadings (>10 mol%), a side reaction occurred where neutral µ-aminodiborane was the main product and H2-release stopped after only 0.6 equivalents. Stephens also
showed that HCl in ethereal solvents can release 1.2 equivalents of hydrogen at 60 oC after 20 hours. H2-release reactions were measured the on a manual gas burette setup.77
The products of the low acid reactions tended to be cyclic species, such as borazine; however, this was most likely due to the use of organic solvents not as a result of acid catalysis. Ultimately, the slow reaction rates and low H2-release amounts, as well as the
1.3.3.3 Using Transition-Metal Catalysis to Enhance Release Rate and Extent.
Since AB is an ethane analogue, the use of transition-metal catalysis was a logical path to explore to activate AB for H2-release. Research has focused on both
heterogeneous catalysis, mainly nanomaterials, and homogenous catalysts. These catalysts were used for both thermolysis and hydrolysis/methanolysis reactions. Transition-metal catalysts were also used to activate alkylated amine boranes.
1.3.3.3.1 Heterogeneous Transition-Metal Catalysts
The Manners group spearheaded the chemistry of transition-metal catalysis of aminoboranes. From 2001 until 2006, the Manners group was the only group publishing on aminoborane catalysis.76,78-81 The work in 2001 focused on rhodium complexes that cyclized alkylated aminoboranes. They found that the secondary amine borane adducts formed cyclodimers. On the other hand, the monomethylamine borane and parent AB, formed trimers, but with the parent borazine formed in only 10 % yield.78 It was found that the original catalyst, [Rh(1,5-cod)(µ-Cl)]2, was the most active at Me2NHBH3
Rh Rh Colloidal Rh Surface
H2B H
Me2N H
Rh Rh
Colloidal Rh Surface
BH2 H
Me2N H
Me2NHBH3
Me2N=BH2
H2 +
Me2N
H2B NMe2
BH2
x 2
(1.7)
Others have used nanoclusters similar to those in the above experiments, which were formed in situ starting from the precatalyst [Rh(COD)Cl]2.79,82,83 There has been
1.3.3.3.2 Homogeneous Transition-Metal Catalysts
Homogenous catalysis is another area of research using a range of first, second, and third row transition metals. One of the most exciting new catalysts was an iridium pincer catalysis, (t-BuPOCOP)Ir(H)2.87-90 First row transition metal catalysis focused on
nickel carbene chemistry, where both experimental90,91 and theoretical92-94 work showed activity in high extent of H2-release. Catalysis by early transition metals, such as
titanocene, has been reported by Pun.95 Three examples of transition-metal catalysts used to enhance AB H2-release will be discussed below.
1.3.3.3.2.1 Iridium Pincer Catalyst
Heinekey and Goldberg first identified the iridium pincer (κ3-1,3-(OPtBu2)2C6H3)Ir(H)2 as an excellent catalyst for the dehydrogenation of AB.
They found that at room temperature with only 0.5 mol% catalyst loading, the reaction went to one equivalent in 14 minutes and at 1 mol% it was complete in just 4 minutes. This makes the iridium catalyst the fastest dehydrogenation catalyst to date. The 11B NMR spectra of the dehydrogenation products showed a broad signal at -18 ppm characteristic of tetracoordinate boron. The product of the iridium catalyzed reaction was identified as the AB pentamer, [H2NBH2]5, by IR and X-ray powder diffraction and was
formed in near quantitative yields.87 It was found that the catalyst was also active for methylamineborane and the product was soluble unlike the AB reaction products. The methylated products were not discrete pentamers like the previously reported87 AB dehydrogenation products, but were a mixture of cyclic oligomers [MeNHBH2]n (n = 2 –
weight percent. The 1:1 ratio of methylamineborane : AB was still fast and made soluble products. Higher AB ratios produced insoluble products.88 The iridium catalyst was also used by Manners to make discrete linear alkylated amine borane species.96 In these studies the concentration of substrate (AB, MeNH2BH3, and nBuNH2BH3) was increased
substantially from 0.5 M solution in the Heinekey/Goldberg reactions to 10 M. With only 0.3 mol% iridium catalyst at 0 oC, Manners was able to produce high molecular weight, soluble (MeNH2BH3) polyaminoboranes. These polymers were characterized
through gel permeation chromatography and the MeNH2BH3 based polymer showed a
poly-dispersion index of only 2.9 with a molecular weight of 160,000.
The iridium pincer catalyst was initially used for alkane dehydrogenation. In these reactions it was proposed that C-H oxidative addition was the first step. Since AB has a heteroactomic backbone other reaction pathways are possible. It is generally believed that AB dehydrogenation with transition-metal catalysts follow Equation 1.8; however, theoretical studies have introduced the possibility of a much more complex mechanism.89 Calculations showed that both a 14 e- and 16 e- iridium systems were possible although the 14 e- mechanism is higher in energy than the 16 e- system and too high for the reaction to occur at room temperature. The 16 e- system is shown in Equation 1.9 and progresses through a 6 center transition state. The most stable species
progresses to the parent species by loss of molecular hydrogen.89 The catalyst kicks out aminoborane which is proposed to then polymerize in the solvent, THF.
O
Ir
O PR2 PR2
H
H
O
Ir
O PR2 PR2
H H
NH3BH3
HBH2NH3
O
Ir
O PR2 PR2
H H
H BH2
NH2
H
O
Ir
O PR2 PR2 H
H O
Ir
O PR2 PR2 H
H H2
NH2BH2
H H
HH
(1.9)
The initially proposed reason for pentamer formation in AB dehydrogenation is based on the fact that the AB timer (CTB) is soluble in THF, but the pentamer is not and therefore the pentamer is isolated exclusively.89 However, more recent trapping studies by Baker along with calculations by Dixon revealed that metal coordination of aminoborane (H2NBH2) may be the important intermediate in the mechanism of these
different product distribution.90 The dehydrogenation of MeNH2BH3 that formed linear
polymers found by Manners was at a higher concentration and cooler temperatures then previously reported by Heinekey and Goldberg. However, the Heinekey and Goldberg products were not well characterized and therefore no direct comparisons can be drawn. The catalyst is not implicated in further dehydrogenation or polymerization due to its steric bulk. Another reason for the iridium pincer catalyst stopping at one equivalent was poisoning of the iridium center with a borane moiety. It was then shown that the catalyst could be regenerated by placing it under H2 pressure.87,97
1.3.3.3.2.2 Nickel Carbene Catalyst
While the iridium catalyst is exceedingly fast, the reaction only reaches one equivalent. This is a problem for application to H2-release systems but other recently
reported catalysts can now achieve more extensive H2-release. An example of a high
N-heterocyclic carbenes (NHC) as a more robust ligand system than phosphines and found that it gave unprecedented dehydrogenation, achieving 2.5 equivalents.91 This system uses a Ni(cod)2 precatalyst with 2 equivalents of NHC ligand to generate the active
catalyst in situ. Enders’ NHC (1,3,4-triphenyl-4,5-dihydro-1H-1,2,4-triazol-5-ylidene) was shown to exhibit the best activity releasing 18 wt% H2 based on the amount of AB
used. The reaction was run in diglyme at 60 oC and produced mainly polyborazylene type products, as well as some carbene-BH3 side-product (Figure 1.12). The nickel
carbene system is certainly not as fast as the iridium pincer, but the catalytic release of over 2 equivalents is unique to this catalyst.
Figure 1.12 Baker’s nickel carbene catalyst with 11B NMR showing final products.91
[Cr(CO)5(η1-H3BNHMe2)] which decomposed within hours at 20 oC into (Me2NBH2)2.
They also generated the AB adduct [Cr(CO)5(η1-H3BNH3)] which decomposed above -20 o
C to form uncharacterized material.98
However, the side-product carbene-BH3 along with the observed kinetic isotope
effects and calculations have shown that for carbene catalysts, there is an unexpected proton transfer to the carbene rather than the B-H bond undergoing oxidative addition.99 Hall calculated a reaction pathway where the boron coordinates to the nickel center while a proton from the nitrogen is abstracted by one of the carbene ligands (Figure 1.13). The proton then adds to the nickel center as well as a hydride. H2 then reductively eliminates
followed by loss of aminoborane.99
Figure 1.13 Schematic energy profile of the nickel carbene catalyst using the carbene as
This pathway does not explain the formation of carbene-BH3 which requires a
free carbene ligand. Kinetic isotope effect studies as well as additional calculations showed that AB replaces one of the NHC ligands so that the active catalyst is actually a Ni-NHC monoligated species.92,93 In addition to the dehydrogenation reaction at the nickel center, the free carbene actively dehydrogenates AB so that there are two catalytic cycles operating in conjunction with each other. The free carbenes calculated AB H2-release mechanism is shown in Figure 1.14. As part of the catalytic cycle, the
carbene reattaches to the nickel center through oxidative addition once the nickels’ catalytic cycle has reached a point where a ligated aminoborane can assist in the dehydrogenation as shown in Equation 1.11.93
1.3.3.3.2.3 Titanocene Catalyst
Early transition-metal complexes have also been evaluated for AB dehydrogenation catalysts. Manners’ screening of complexes for activity with Me2NHBH3 showed that Cp2TiMe2, a Ti(IV), was inactive.76 They later showed that
Cp2Ti, a Ti(II), which is made in situ using Cp2TiCl2 and nBuLi. The Ti(II) catalyst was
not studied with AB extensively and therefore no H2-release data are available. The
reaction was followed by 11B NMR and the initial product was cyclotriborazane which slowly converted to borazine with release of 2 equivalents of H2.95 H2-release data
collected for Me2NHBH3 and the titanium catalyst showed 50 % conversion to the dimer
in <50 minutes, whereas the heterogeneous Rh(0) catalyst took >400 minutes to reach the same conversion percentage.81 The proposed mechanism for H2-release and Me2NHBH3
dimerization utilizing Cp2Ti is shown in Equation 1.12. This calculation study by Luo
Me2NHBH3 followed by subsequent removal of the B-H hydride and Me2NBH2 release
to self-dimerize.100 This study failed to take into account concurrent results by Chirik that showed in a similar catalyst the mechanistic cycle is reversible. This was shown by deuterium studies where (Cp*2Ti)2N2 was subjected to a D2 atmosphere while
dehydrogenating Me2NHBH3. Deuterium was found in the B-H position and HD was
1.3.3.3.2.4 Transition-Metal Catalysis in Hydrolysis/Methanolysis
1.3.4 Large Scale Preparations of Ammonia Borane
In order to make the hydrogen economy work, a large scale synthesis of AB is needed. The traditional preparation of AB uses sodium borohydride and ammonium sulfate in an ethereal solvent.102,103 Ramachandrand et al. have reported a large scale preparation using tetrahydrofuran as the solvent. In their prep (Equation 1.14), ammonium sulfate was used in 50 % excess with the resulting AB yield being 96 % and
achieved in 98 % purity. In addition to ammonium sulfate, ammonium formate was used in dioxane with similar results.102 While these preps show that the traditional methods can be scaled-up, other pathways will be needed if AB is to become a large scale energy carrier. To that end, Heldebrant et al.103 showed that AB could be made from the decomposition of ammonium borohydride which was made in situ by the reaction of NaBH4 and NH4Cl. In their preparation, liquid ammonia was used as the solvent with
ammonium chloride and sodium borohydride forming the ammonium borohydride (Equation 1.15). Subsequent hydrogen loss and purification gave AB (Equation 1.16) in 99 % yield. All of these materials are available on large scales already; therefore scale-up should be straight forward.
2NaBH4+ (NH4)2SO4 THF
40oC
2 h
2NH3-BH3+ Na2SO4+ 2H2
96%
1.3.5 Recycling the AB Fuel Source
Regeneration of the spent fuel is one of the most important aspects of a complete closed energy system. Most regeneration attempts focus on a two step system where the spent fuel is digested and the boron is converted into a B-X species which is then reduced to B-H bonds and coupled to ammonia. The best current approach for digestion uses
ortho-benzenedithiol in THF which was refluxed for 12 hours to form the borane dithiol
adduct. This adduct was then reduced using tributyltinhydride and the intermediate amine exchanged for ammonia (Equation 1.17).104 Therefore, a regeneration scheme to turn the benzenedithiol-tributyltin adduct back into usable benzenedithiol and tributyltinhydride was designed. In this scheme, the adducts were replaced with chloride then oxidized using formic acid which was driven off with heat to recycle the tributyltinhydride.105
The production of large amounts of waste tributyltin in this process is a serious problem. In an effort to find an alternative to tin reducing agents, Mock et al. analyzed the hydride donor ability in acetonitrile of several transition-metal hydrides and compared them to the hydride affinities of several borane adducts such as B(OSiMe3)3,
B(OPh)3, and BF3.106 Utilizing this information, combinations of digestion agents and
1.3.6 Hybrid Materials Try to Bridge the Gap Between AB and Metal Hydrides
Another class of amine boranes that has received attention is the metal amidoboranes. The progenitor of this class was sodium amidoborane (Na(NH2BH3)),
1.4 Conclusions
As petroleum supplies run low and the need for an alternative energy carrier becomes evident, hydrogen has the potential to supplant petroleum as the United States’ and the worlds’ primary energy carrier. Ammonia borane is one of the most promising hydrogen storage materials due to its high materials weight percent and stability. While the solid-state reaction of AB is slow and incomplete, there are many methods being researched to enhance the rate and extent of H2-release from AB. There have been
advances in the use of metals, carbon scaffold, and acid catalysis to achieve the DOE’s targets; however none have solved the problems with AB H2-release either due to low
extent and/or rate of H2-release or high cost. Now methods for activating AB
dehydrogenation catalysis are needed to help AB become a solution for hydrogen storage. Chapters 2 and 3 demonstrate two new complimentary ways of activating H2-release
1.5 References
1. Boyer, R., et. al. Annual Energy Review, Washington, 2008,
http://www.eia.doe.gov/emeu/aer/pdf/aer.pdf.
2. Dillich, S. 2009 DOE Hydrogen Program & Vehicle Technologies Program
http://www.hydrogen.energy.gov/pdfs/review09/st_0_dillich.pdf. DOE has recently lowered the 2015 gravimetric total system target to only 5.5 total system weight %.
3. Erlebacher, J.; Henry, E.; Frans, S., In Solid State Physics, Academic Press: Burlington, MA, 2009; Vol. 61, pp 77-141.
4. Natural Gas Reforming.
http://www1.eere.energy.gov/hydrogenandfuelcells/production/natural_gas.html. 5. Nocera, D. G. Inorg. Chem. 2009, 48, 10001-10017.
6. Honda Honda FCX Clarity. http://automobiles.honda.com/fcx-clarity/.
7. Chua, Y. S.; Wu, G.; Xiong, Z.; He, T.; Chen, P. Chem. Mater. 2009, 21, 4899-4904.
8. Diyabalanage, H. V. K.; Shrestha, R. P.; Semelsberger, T. A.; Scott, B. L.; Bowden, M. E.; Davis, B. L.; Burrell, A. K. Angew. Chem. Int. Ed. 2007, 46, 8995-8997.
9. Fijalkowski, K. J.; Grochala, W. J. Mater. Chem. 2009, 19, 2043-2050. 10. Lee, T. B.; McKee, M. L. Inorg. Chem. 2009, 48, 7564-7575.
11. Myers, A. G.; Yang, B. H.; David, K. J. Tetrahedron Lett. 1996, 37, 3623-3626. 12. Ramzan, M.; Silvearv, F.; Blomqvist, A.; Scheicher, R. H.; Lebegue, S.; Ahuja,
13. Schlesinger, H. I.; Burg, A. B. J. Am. Chem. Soc. 1938, 60, 290. 14. Spielmann, J.; Bolte, M.; Harder, S. Chem. Comm. 2009, 6934-6936.
15. Wu, H.; Zhou, W.; Yildirim, T. J. Am. Chem. Soc. 2008, 130, 14834-14839. 16. Xiong, Z.; Chua, Y. S.; Wu, G.; W., X.; Chen, P.; Shaw, W. J.; Karkamkar, A.;
Linehan, J. C.; Smurthwaite, T.; Autrey, T. Chem. Comm. 2008, 5595-5597. 17. Xiong, Z.; Wu, G.; Chua, Y. S.; Hu, J.; He, T.; Xu, W.; Chen, P. Energy Environ.
Sci. 2008, 1, 360-363.
18. Xiong, Z.; Yong, C. K.; Wu, G.; Chen, P.; Shaw, W. J.; Karkamkar, A.; Autrey, T.; Jones, M. O.; Johnson, S. R.; Edwards, P. P.; David, W. I. F. Nat. Mater. 2008, 7, 138-141.
19. Feaver, A.; Sepehri, S.; Shamberger, P.; Stowe, A.; Autrey, T.; Cao, G. J. Phys.
Chem. B 2007, 111, 7469-7472.
20. Gutowska, A.; Li, L.; Shin, Y.; Wang, C. M.; Li, X. S.; Linehan, J. C.; Smith, R. S.; Kay, B. D.; Schmid, B.; Shaw, W. J.; Gutowski, M.; Autrey, T. Angew. Chem.
Int. Ed. 2005, 44, 3578-3582.
21. Kim, H.; Karkamkar, A.; Autrey, T.; Chupas, P.; Proffen, T. J. Am. Chem. Soc. 2009, 131, 13749-13755.
22. Li, L.; Yao, X.; Sun, C.; Du, A.; Cheng, L.; Zhu, Z.; Yu, C.; Zou, J.; Smith, S. C.; Wang, P.; Cheng, H.-M.; Frost, R. L.; Lu, G. Q. Adv. Funct. Mater. 2009, 19, 265-271.
23. Li, Y.; Xie, L.; Li, Y.; Zheng, J.; Li, X. Chem. Eur. J. 2009, 15, 8951-8954. 24. Paolone, A.; Palumbo, O.; Rispoli, P.; Cantelli, R.; Autrey, T.; Karkamkar, A. J.
25. Sepehri, S.; Feaver, A.; Shaw, W. J.; Howard, C. J.; Zhang, Q.; Autrey, T.; Cao, G. J. Phys. Chem. B 2007, 111, 14285-14289.
26. Sepehri, S.; Garcia, B. B.; Cao, G. J. Mater. Chem. 2008, 18, 4034-4037. 27. Sepehri, S.; García, B. B.; Cao, G. Eur. J. Inorg. Chem. 2009, 599-603.
28. Wang, L.-Q.; Karkamkar, A.; Autrey, T.; Exarhos, G. J. J. Phys. Chem. C 2009,
113, 6485-6490.
29. ZahmakIran, M.; Özkar, S. Appl. Catal., B 2009, 89, 104-110.
30. Custelcean, R.; Dreger, Z. A. J. Phys. Chem. B 2003, 107, 9231-9235. 31. Stock, A.; Pohland, E. Ber. 1925, 58, 657.
32. Shore, S. G.; Parry, R. W. J. Am. Chem. Soc. 1955, 77, 6084-6085.
33. Shore, S. G.; Parry, R. W. J. Am. Chem. Soc. 1958, 80, 20-24 and preceeding papers in this issue.
34. Stephens, F. H.; Pons, V.; Baker, R. T. Dalton Trans. 2007, 25, 2613-2626. 35. Schlesinger, H. I.; Burg, A. B. J. Am. Chem. Soc. 1938, 60, 290-299.
36. Schaeffer, G. W.; Adams, M. D.; Koenig, F. J.; Koenig, S. J. J. Am. Chem. Soc. 1956, 78, 725-728.
37. Mayer, E. Inorg. Chem. 1972, 11, 866-869. 38. Mayer, E. inorg. Chem. 1973, 12, 1954-1955.
39. Carpenter, J. D.; Ault, B. S. J. Phys. Chem. 1991, 95, 3502-3506.
40. Nguyen, V. S.; Matus, M. H.; Grant, D. J.; Nguyen, M. T.; Dixon, D. A. J. Phys.
Chem. A 2007, 111, 8844-8856.
41. Nguyen, M. T.; Nguyen, V. S.; Matus, M. H.; Gopakumar, G.; Dixon, D. A. J.