http://www.sciencepublishinggroup.com/j/ass doi: 10.11648/j.ass.20190701.15
ISSN: 2376-6174 (Print); ISSN: 2376-6182 (Online)
Comprehensive Analyses of Factors Associated with
Postoperative Renal Global Function in Patients Treated by
Partial Nephrectomy
Takehiro Sejima
1, *, Toshihiko Masago
2, Tetsuya Yumioka
3, Shuichi Morizane
3, Masashi Honda
3,
Atsushi Takenaka
31
Department of Urology, Matsue City Hospital, Matsue, Japan
2
Department of Urology, YONAGO Medical Center, Yonago, Japan
3Division of Urology, Department of Surgery, Tottori University Faculty of Medicine, Yonago, Japan
Email address:
*
Corresponding author
To cite this article:
Takehiro Sejima, Toshihiko Masago, Tetsuya Yumioka, Shuichi Morizane, Masashi Honda, Atsushi Takenaka. Comprehensive Analyses of Factors Associated with Postoperative Renal Global Function in Patients Treated by Partial Nephrectomy. Advances in Surgical Sciences.
Vol. 7, No. 1, 2019, pp. 21-28. doi: 10.11648/j.ass.20190701.15
Received: February 8, 2019; Accepted: March 14, 2019; Published: April 8, 2019
Abstract: Study aim:
To characterize the associated factors of postoperative renal global functional deterioration after partial nephrectomy (PN), comprehensive analyses were performed using multiple factors categorized as data from pre, intra and postoperative periods. Methods: Ninety-three patients underwent PN. Estimated glomerular filtration rate (eGFR) and computed tomography (CT) scans were examined pre- and 6 months postoperatively. Renal global functional deterioration after PN was assessed by postoperative percent of eGFR decline. Pre- and postoperative renal parenchymal volume (RPV) was measured by the Synapse Vincent volumetric analyzer which creates a reconstructed image from a CT scan. Additional factors that were analyzed included patient demographics, comorbidities, surgical factors and tumor pathology. All factors demonstrating statistical tendencies (P < 0.1) in univariate analyses were subjected to multivariate logistic regression analysis. Two groups were categorized according to the degree of eGFR decline. Groups A and B were categorized as less than 15% and greater than 15% declines, respectively. Results: The case distributions of hypertension (HTN) and male gender were significantly shifted in group B. Significant compensatory renal hypertrophy of the contralateral side occurred postoperatively. The percent increment of RPV in the contralateral side in group B was significantly lower than that in group A. In multivariate analysis, HTN was the sole independent associated factor in group B. Conclusions: Host factors, rather than surgical factors, may be associated with postoperative renal global functional deterioration in PN. Surgeons should consider medical problems in addition to surgical skills especially in HTN patients.Keywords:
Estimated Glomerular Filtration Rate, Partial Nephrectomy, Renal Function, Renal Volume1. Introduction
Renal cell carcinoma (RCC) accounts for 3% of all cancers in adults. Over the past decade, the diagnosis of RCC increased; there are 270,000 cases worldwide each year [1, 2]. This increase in diagnoses partly results from an increase in incidental detection of RCC from the development of radiological imaging and might also be related to an increased
of small renal masses including clinical stage T1a RCC. Numerous studies have confirmed the benefits of PN in terms of improved renal function and overall survival [7]. The objective of PN is to preserve as much renal function as possible while achieving negative surgical margins, all within the context of a low perioperative complication rate [8, 9]. Achieving the best PN outcomes requires the use of open, laparoscopic or robot-assisted approaches that are appropriate for individual tumor characteristics, surgeon experience or institution-related factors. However no effective report has shown the predictors of renal functional damage after PN that enables choosing the appropriate operation. Although sparing non-neoplastic renal tissue can be accomplished, the preservation of renal function in any PN case is difficult. It is important to predict which patients may experience significant impairment after PN because they may benefit from more rigorous follow-up, aggressive reno-protective measures and more accurate postoperative counseling.
In the postoperative management of patients treated by PN, renal global function is a practical and crucial factor in clinical
practice. Although numerous studies in searching
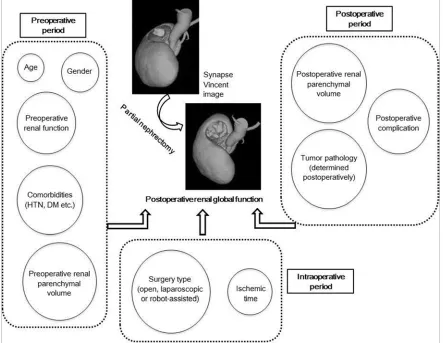
intraoperative-associated factors such as ischemic time with postoperative renal global function have been performed, no study has aimed to perform comprehensive analyses with regard to postoperative renal global function. In fact, multiple factors that are categorized as pre-, intra- and postoperative periods are thought to be associated with postoperative renal global function (Figure 1). The aim of the study was to characterize the associated factors of postoperative renal global functional deterioration after PN. Therefore, comprehensive analyses were performed using multiple factors that were categorized as pre-, intra- and postoperative periods. Moreover, postoperative renal parenchymal volume (RPV) change calculated by sophisticated film technology was added to the analyzed factor as the novel approach in this study.
Figure 1. Associations of multiple factors that are categorized as data from pre-, intra- and postoperative periods with postoperative renal global function in PN. Kidney schemas are reconstructed from one of the actual cases using the Synapse Vincent system.
2. Materials and Methods
2.1. Postoperative Renal Global Functional Evaluation
A total of 93 patients who underwent PN were identified in between April 2010 and March 2015. The patient’s eGFR was calculated using the following equation: eGFR = 194 × serum
creatinine-1.094 × age-0.287 (for females, × 0.739) [10]. This formula is currently recommended by the Japanese Society of Nephrology. The percent eGFR decline was defined as (preoperative eGFR - postoperative eGFR) / preoperative eGFR × 100. Group A was defined as percent eGFR decline < 15, whereas Group B was defined as percent eGFR decline
2.2. Patient Clinical Data Collection
Patients’ demographic and clinical data were collected and categorized from the preoperative period. The collected data included age, gender, body mass index (BMI), Eastern Cooperative Oncology Group performance status (ECOG PS), Age-adjusted Charlson Comorbidity Index (CCI), American Society of Anesthesiologists (ASA) score, history of smoking, patient’s comorbidities, tumor characteristics, the RENAL
nephrometry score [11], preoperative eGFR and
hematological laboratory data of hemoglobin (Hgb), white blood cell (WBC) count, lactate dehydrogenase (LDH) and C-reacted protein (CRP). With regard to comorbidities, hypertension (HTN), diabetes mellitus (DM), proteinuria,
dyslipidemia, hyperuricemia and past history of
cardiovascular disease (CVD), all of which can affect renal function, were evaluated. Analysis of surgical factors included surgery type, surgical approach method, renal vessel clamp pattern and ischemic method and time, all of which were categorized as data from the intraoperative period. In terms of postoperative complications that were categorized as data from the postoperative period, the events of more than a grade 2 Clavien-Dindo classification were evaluated. An additional analyzed factor was tumor pathology which was determined postoperatively. All of the backgrounds of 93 patients are summarized in table 1. Informed consent was obtained from all individual participants included in the study. The study was approved by the Ethics Committee of Tottori University Faculty of Medicine (approval number 2692).
Table 1. Patient, laboratory, tumor, surgical and renal parenchymal volume (RPV) background of all cases.
Category Factors Mean (range) or No. of patient
Pre Age (yrs) 63.5 (41 – 85)
-operative Gender Male / Female 60 / 33
BMI (kg/m2) 24.0 (17.8 – 33.2)
ECOG PS 0 / 1 / 2 55 / 34 / 4
Age-adjusted CCI 0 / 1 / 2 / 3 / 4 / 5 5 / 12 / 24 / 26 / 22 / 4
ASA score ClassⅠ / Ⅱ / Ⅲ / Ⅳ 14 / 71 / 6 / 2
History of smoking Yse / No 44 / 49
Comorbidities CVD Yse / No 17 / 76
HTN Yse / No 45 / 48
Dyslipidemia Yse / No 21 / 72
Hyperuricemia Yse / No 10 / 83
Proteinuria Yse / No 14 / 79
DM Yse / No 14 / 79
Tumor side Right / Left Yse / No 52 / 41
Tumor diameter (cm) 2.5 (0.9 – 4.7)
RENAL score 5.7 (4 – 10)
eGFR (mL/min/1.73m2) 79.2 (49.7 – 117.5)
Blood examination Hgb (g/dL) 13.5 (9.1 – 16.8)
WBC (/µl) 5650 (2900 – 9600)
LDH (IU/l) 205 (101 – 356)
CRP (mg/dl) 0.14 (0.1 – 1.92)
RPV (mL) Contralateral side 158.8 (88.2 – 239.2)
Diseased side 159.0 (92.3 – 231.4)
Bilateral sides 317.8 (195.3 – 442.3)
Intra Surgery type Open / Lapro / Robot 44 / 23 / 26
-operative Approach method Retro- / Intraperitoneal 53 / 40
Vessel clamp Vein and artery / Artery 22 / 71
Ischemic method Warm / Cold 48 / 45
Ischemia time (minute) 27.2 (8.1 – 60.2)
Post Complication Yse / No 9 / 84
-operative Tumor pathology Benign / Malignancy 13 / 80
eGFR (mL/min/1.73m2) 68.2 (40.2 – 104.3)
% change of RPV Contralateral side +6.6 (+1.1 – +12.4)
Diseased side -12.8 (-21.1 – -4.2)
Bilateral sides -3.2 (-8.7 – +2.2)
2.3. The Indication, Degree of Difficulty and Procedure of PN
Basically, the indication of PN was unilateral renal small mass (≤ 4cm) with possibility of malignancy without metastasis which was diagnosed by enhanced computed tomography (CT) scan. However, four cases deviated from the indication. The tumor maximal diameter of these cases was
Renal vessel clamp (both of artery and vein or artery only) procedure was adopted in all cases. All PN were performed by four certificated doctors of Japanese Urological Association who had been familiar with PN over the past five years.
2.4. Renal Parenchymal Volumetry
Renal tumor and remnant RPV were calculated by multi-detector CT scanners using the standard clinical abdomen-pelvis imaging protocol. CT scan examinations were performed pre- and 6 months postoperatively. The volume analysis of RPV was performed using Synapse Vincent system version 4. (Fujifilm corporation, Tokyo, Japan), an image-processing software package dedicated to digital imaging and communications in medicine (DICOM) images. After the observer had manually rendered the tumor area, the software calculated 3D tumor and RPV volume automatically. Pre- and postoperative RPV of contralateral, diseased side and bilateral sides were analyzed, and postoperative RPV changes that were categorized as data from the postoperative period were calculated (Table 1). The percent change of RPV was defined as (postoperative RPV - preoperative RPV) / preoperative RPV × 100.
2.5. Statistical Analyses
In the analysis to determine associated factors for
postoperative severe renal global functional deterioration (groups B), the comparisons of all factors between groups A and B were performed in the first step. Continuous variables were evaluated to determine whether the data fit a Gaussian distribution. If the data fit a Gaussian distribution, then Student’s t-test was used. If not, the Mann-Whitney U test was used. Case distributions were compared using the chi-square test. Potent factors (P < 0.1 in univariate analyses) were subjected to multivariate logistic regression analysis in the second step. Statistical analysis was performed with SPSS version 8 (SPSS Inc., Chicago, IL, USA).
3. Results
3.1. Univariate Comparison of Factors Between Groups A and B
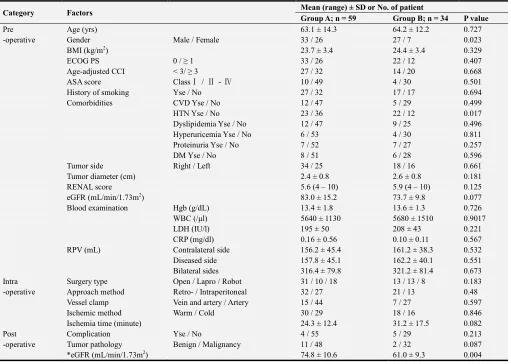
Fifty-nine and thirty-four cases were categorized as group A and B, respectively. Comparing the preoperative patient characteristics between the two groups, the case distributions of male gender and HTN were significantly shifted in group B (Table 2). Preoperative hematological factors were not different between the two groups. Although statistical significance was not determined, lower preoperative eGFR, longer ischemic time and malignant tumor pathology tended to be associated with group B (Table 2).
Table 2. Comparison of factors between group A and B.
Category Factors Mean (range) ± SD or No. of patient
Group A; n = 59 Group B; n = 34 P value
Pre Age (yrs) 63.1 ± 14.3 64.2 ± 12.2 0.727
-operative Gender Male / Female 33 / 26 27 / 7 0.023
BMI (kg/m2) 23.7 ± 3.4 24.4 ± 3.4 0.329
ECOG PS 0 / ≥ 1 33 / 26 22 / 12 0.407
Age-adjusted CCI < 3/ ≥ 3 27 / 32 14 / 20 0.668
ASA score ClassⅠ / Ⅱ - Ⅳ 10 / 49 4 / 30 0.501
History of smoking Yse / No 27 / 32 17 / 17 0.694
Comorbidities CVD Yse / No 12 / 47 5 / 29 0.499
HTN Yse / No 23 / 36 22 / 12 0.017
Dyslipidemia Yse / No 12 / 47 9 / 25 0.496
Hyperuricemia Yse / No 6 / 53 4 / 30 0.811
Proteinuria Yse / No 7 / 52 7 / 27 0.257
DM Yse / No 8 / 51 6 / 28 0.596
Tumor side Right / Left 34 / 25 18 / 16 0.661
Tumor diameter (cm) 2.4 ± 0.8 2.6 ± 0.8 0.181
RENAL score 5.6 (4 – 10) 5.9 (4 – 10) 0.125
eGFR (mL/min/1.73m2) 83.0 ± 15.2 73.7 ± 9.8 0.077
Blood examination Hgb (g/dL) 13.4 ± 1.8 13.6 ± 1.3 0.726
WBC (/µl) 5640 ± 1130 5680 ± 1510 0.9017
LDH (IU/l) 195 ± 50 208 ± 43 0.221
CRP (mg/dl) 0.16 ± 0.56 0.10 ± 0.11 0.567
RPV (mL) Contralateral side 156.2 ± 45.4 161.2 ± 38.3 0.532
Diseased side 157.8 ± 45.1 162.2 ± 40.1 0.551
Bilateral sides 316.4 ± 79.8 321.2 ± 81.4 0.673
Intra Surgery type Open / Lapro / Robot 31 / 10 / 18 13 / 13 / 8 0.183
-operative Approach method Retro- / Intraperitoneal 32 / 27 21 / 13 0.48
Vessel clamp Vein and artery / Artery 15 / 44 7 / 27 0.597
Ischemic method Warm / Cold 30 / 29 18 / 16 0.846
Ischemia time (minute) 24.3 ± 12.4 31.2 ± 17.5 0.082
Post Complication Yse / No 4 / 55 5 / 29 0.213
-operative Tumor pathology Benign / Malignancy 11 / 48 2 / 32 0.087
Category Factors Mean (range) ± SD or No. of patient
Group A; n = 59 Group B; n = 34 P value
% change of RPV Contralateral side +7.4 ± 2.8 +5.8 ± 3.2 0.048
Diseased side -13.2 ± 4.6 -12.3 ± 4.9 0.123
Bilateral sides -3.1 ± 2.6 -3.4 ± 1.9 0.186
*Postoperative eGFR was not included in comparative analyses because group A and B were defined as % eGFR decline < 15 and ≧15, respectively.
3.2. Analyses of Renal Parenchymal Volumetry and Univariate Comparisons of RPV Changes Between Groups A and B
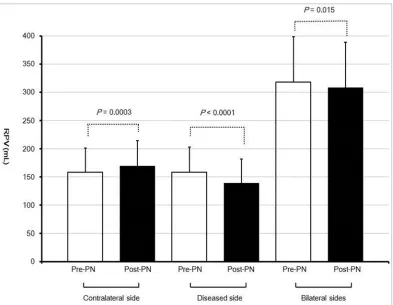
The mean and standard deviation (SD) RPV values of the contralateral, diseased side and bilateral sides were analyzed. The mean (SD) preoperative RPV values of the contralateral, diseased side and bilateral sides were 158.8 (42.6), 159 (43.9) and 317.8 (81.2) mL, respectively (Table 1). The mean (SD)
postoperative RPV values of the contralateral, diseased side and bilateral sides were 169.2 (45.7), 138.6 (43.4) and 307.8 (80.7) mL, respectively. Postoperative RPV of diseased and bilateral sides both significantly decreased, whereas that of the contralateral side significantly increased compared with the preoperative RPV (Figure 2). The percent increment of RPV in the contralateral side in group B was significantly lower than that in group A (Table 2).
Figure 2. Comparisons of contralateral, diseased side and bilateral sides RPV between pre- and postoperative periods. White and black bars indicate pre- and postoperative RPV, respectively. Longitudinal lines at the top of each bar indicate SD.
3.3. Multivariate Analysis of Independent Associated Factors with Group B
Finally, gender, HTN, preoperative eGFR, ischemia time, tumor pathology and percent change of RPV in the contralateral side were forwarded to multivariate logistic regression analysis. HTN was the sole independent associated factor in group B (Table 3).
Table 3. Multivariate logistic regression analysis for factors associated with global estimated glomerular filtration rate (eGFR) decline rate ≥15%.
Factors Odds ratio (95% CI) P value
Gender Male vs. Female 4.082 (0.159–105.075) 0.3959
HTN Yes vs. No 8.149 (1.281–62.324) 0.0482
Preoperative eGFR 0.975 (0.928–1.024) 0.3125
Ischemia time 1.028 (0.982–1.126) 0.2782
Tumor pathology Malignant vs. Benign 2.699 (0.395–18.442) 0.3112
3.4. The Comparative Analysis of Pre- and Postoperative eGFR, and Percent Change of Contralateral Side RPV Between the Patients with and Without HTN
Because the factors of top two P values in multivariate analysis were HTN and percent change of contralateral side RPV, it was suggested that renal hypertrophy in contralateral side compensated postoperative renal global functional decline in patients without HTN. Therefore, comparative
analysis of pre- and postoperative eGFR, and percent change of contralateral side RPV between the patients with and without HTN was performed for the further confirmation of multivariate regression analysis. Postoperative eGFR and percent change of RPV in contralateral side were significantly higher in patients without HTN than in patients with HTN (Table 4).
Table 4. Comparison of pre-, postoperative estimated glomerular filtration rate (eGFR) and percent change of contralateral side renal parenchymal volume (RPV) between patients with and without hypertension (HTN).
Factors
Patients with HTN Patients without HTN
P value
(n = 45) (n = 48)
Mean ± SD
eGFR (mL/min/1.73m2) Preoperative 73.9 ± 9.6 81.5± 13.8 0.062
Postoperative 60.5 ± 9.8 75.8 ± 10.2 0.004
% change of RPV Contralateral side +6.0 ± 3.3 +7.3 ± 2.7 0.038
4. Discussion
Postoperative renal global function is the crucial outcome in addition to oncological control in PN. Mir et al. reviewed 19 articles evaluating post-PN renal global function in patients with bilateral kidneys and indicated that most series support the preservation of approximately 88% to 91% of renal global function after PN [12]. On the basis of the values, groups A and B were identified. Therefore, group B (the percent eGFR decline was greater than 15) should be categorized as unfavorable renal functional outcome cases. Although multiple factors are thought to affect postoperative renal global function in PN, comprehensive analyses identifying the factors that are associated with postoperative renal global function are very limited. Ischemic time from renal arterial clamping is the most important surgical factor [13]. Additionally, baseline preoperative renal function and patient comorbidities are critical [14, 15]. In the analyses of preoperative factors in this study, male gender and HTN were significantly associated with postoperative renal global functional deterioration. Moreover, HTN was the sole independent associated factor in multivariate analysis. HTN, DM and proteinuria, which are known to generally affect renal function, have been well documented [16, 17]. The comorbidities chosen to be analyzed in the present study were similar to those in their study and can be obtained easily by preoperative medical examination. Several studies showed that the renal functional decline in females is associated with increased vascular stiffness [18, 19]. Vascular stiffness was reported to be associated with HTN and renal functional decline.17 Specifically, arterial stiffness, independent of mean arterial pressure, results in end organ damage by imposing
hemodynamic stress on vascular beds. Facilitated
transmission of excessive pressure, flow pulsatility into the micro-vascular beds of the kidneys and a high-flow organ will lead to endothelial dysfunction, micro-vascular ischemia and tissue damage. Other possible mechanisms include chronic inflammation, oxidative stress, and renin-angiotensin system
activation. The statistically significant association of male
gender with postoperative renal global functional
deterioration might be reflected by the high ratio of male patients in all HTN patients. Although the male patient percent ratio in the patient cohort was 64.5 (60 out of 93), that in HTN patients was 84.4 (38 out of 45). The influence of gender difference on postoperative renal global functional decline should be investigated in a larger patient cohort without a comorbidity bias. The present study revealed that HTN might be useful information for the prediction of postoperative renal global functional deterioration after PN.
contralateral side in a PN patient cohort [23, 24]. Kim et al. demonstrated that the tumor and resected parenchymal volume were independent predictive factors of CRH after
robot-assisted PN [23]. Large tumors (>7cm) were
significantly associated with CRH in a mixed cohort of RN and PN [25]. The resected parenchymal volume was also significantly associated with CRH in a mixed cohort of RN and PN [20]. The findings in this study indicated that CRH of group B was statistically inferior to group A. The ischemic time of group B was somewhat longer than that of group A. Considering the universal evidence of the correlation between ischemic time and post-PN renal function [13], it might be possible that ischemic time affects the CRH of the contralateral side, consequently leading to postoperative renal global functional deterioration in this study. Another characteristic factor associated with postoperative renal global
functional deterioration was tumor pathology. The
distribution of malignancy was somewhat higher in group B (32 out of 34; 94.1%) than in group A (48 out of 59; 81.4%). Although detailed evaluation of the resected normal parenchymal margin occurs during the operation, surgeons might be influenced by the preoperative CT diagnosis of the tumor and decide the margin thickness in each case. Therefore, margin thickness might be thinner in preoperative suspected benign tumor cases, consequently leading to the preservation of a large amount of normal parenchyma. Another interpretation is the coexistence of renal malignancy and systemic disease which can be predicted by histopathological evaluation of resected renal specimens. HTN, smoking, obesity, DM and increasing age are risk factors for renal malignancy, and independently, they all have a strong impact on renal function [26-29]. Bijol et al. also showed the presence of pathological arteriosclerosis and DM as frequent findings in nephrectomized normal renal parenchyma in a cohort of 110 consecutive renal tumor patients [30].
The study has certain limitations. First, multiple operators performed PN. Although the surgical concept was standardized in all cases of our study, technical differences among surgeons might influence the outcome. Therefore, our study does not have enough power to deny the effect of surgical factors to postoperative renal global function in patients treated by PN. External validation in a large sample size of patients who are operated by a single expert surgeon will help to further characterize the potent factors. Second, although the volumetric software was easy to use, and the results were accurate, there might be some inter-observer variability in measuring volumes. Third, the retrospective nature and the small sample size of patients was an additional limitation.
5. Conclusion
This study suggested that host factors, rather than surgical factors, may be associated with postoperative renal global functional deterioration in PN. In the presence of HTN, patients may benefit from more rigorous follow-up and aggressive reno-protective measures throughout surgical
treatment.
Conflict of Interest Statement
The authors declare that they have no competing interests.
References
[1] Ferlay J, Shin HR, Bray F, Forman D, Mathers C, Parkin DM. Estimates of worldwide burden of cancer in 2008: GLOBOCAN 2008. Int J Cancer. 2010; 127: 2893-2917.
[2] Li P, Znaor A, Holcatova I, Fabianova E, Mates D, Wozniak MB, Ferlay J, Scelo G. Regional geographic variations in kidney cancer incidence rates in European countries. Eur Urol. 2015; 67: 1134-1141.
[3] Cote ML, Colt JS, Schwartz KL, Wacholder S, Ruterbusch JJ, Davis F, Purdue M, Graubard BI, Chow WH. Cigarette smoking and renal cell carcinoma risk among black and white Americans: effect modification by hypertension and obesity. Cancer Epidemiol Biomarkers Prev. 2012; 21: 770-779.
[4] Roos FC, Brenner W, Jäger W, Albert C, Müller M, Thüroff JW, Hampel C. Perioperative morbidity and renal function in young and elderly patients undergoing elective nephron-sparing surgery or radical nephrectomy for renal tumours larger than 4 cm. BJU Int. 2011; 107: 554-561.
[5] Lane BR, Fergany AF, Weight CJ, Campbell SC. Renal functional outcomes after partial nephrectomy with extended ischemic intervals are better than after radical nephrectomy. J Urol. 2010; 184: 1286-1290.
[6] Ohno Y, Nakashima J, Ohori M, Hashimoto T, Iseki R, Hatano T, Tachibana M. Impact of tumor size on renal function and prediction of renal insufficiency after radical nephrectomy in patients with renal cell carcinoma. J Urol. 2011; 186: 1242-1246.
[7] Campbell SC, Novick AC, Belldegrun A, Blute ML, Chow GK, Derweesh IH, Faraday MM, Kaouk JH, Leveillee RJ, Matin SF, Russo P, Uzzo RG; Practice Guidelines Committee of the American Urological Association (2009) Guideline for management of the clinical T1 renal mass. J Urol. 2009; 182: 1271-1279.
[8] Uzzo RG, Novick AC. Nephron sparing surgery for renal tumors: indications, techniques and outcomes. J Urol. 2001; 166: 6-18.
[9] Gill IS, Aron M, Gervais DA, Jewett MA. Clinical practice. Small renal mass. N Engl J Med. 2010; 362: 624-634.
[10] Matsuo S, Imai E, Horio M, Yasuda Y, Tomita K, Nitta K, Yamagata K, Tomino Y, Yokoyama H, Hishida A; Collaborators developing the Japanese equation for estimated GFR (2009) Revised equations for estimated GFR from serum creatinine in Japan. Am J Kidney Dis. 2009; 53: 982-992.
[11] Kutikov A, Uzzo RG. The R. E. N. A. L. nephrometry score: a comprehensive standardized system for quantitating renal tumor size, location and depth. J Urol. 2009; 182: 844-853.
[13] Thompson RH, Lane BR, Lohse CM, Leibovich BC, Fergany A, Frank I, Gill IS, Blute ML, Campbell SC. Every minute counts when the renal hilum is clamped during partial nephrectomy. Eur Urol. 2010; 58: 340-345.
[14] Kim JH, Park YH, Kim YJ, Kang SH, Byun SS, Kwak C, Hong SH. Perioperative and long-term renal functional outcomes of robotic versus laparoscopic partial nephrectomy: a multicenter matched-pair comparison. World J Urol. 2015; 33: 1579-1584.
[15] Muramaki M, Miyake H, Sakai I, Fujisawa M. Prognostic Factors Influencing Postoperative Development of Chronic Kidney Disease in Patients with Small Renal Tumors who Underwent Partial Nephrectomy. Curr Urol. 2013; 6: 129-135.
[16] Jeon HG, Choo SH, Jeong BC, Seo SI, Jeon SS, Choi HY, Lee HM. Uric acid levels correlate with baseline renal function and high levels are a potent risk factor for postoperative chronic kidney disease in patients with renal cell carcinoma. J Urol. 2013; 189: 1249-1254.
[17] Abouassaly R, Finelli A, Tomlinson GA, Urbach DR, Alibhai SM. How often are patients with diabetes or hypertension being treated with partial nephrectomy for renal cell carcinoma? A population-based analysis. BJU Int. 2011; 108: 1806-1812.
[18] Earle KA, Ng L, White S, Zitouni K. Sex differences in vascular stiffness and relationship to the risk of renal functional decline in patients with type 2 diabetes. Diab Vasc Dis Res. 2017; 14: 304-309.
[19] Van den Munckhof ICL, Holewijn S, de Graaf J, Rutten JHW. Sex differences in fat distribution influence the association between BMI and arterial stiffness. J Hypertens. 2017; 35: 1219-1225.
[20] Takagi T, Mir MC, Sharma N, Remer EM, Li J, Demirjian S, Kaouk JH, Campbell SC. Compensatory hypertrophy after partial and radical nephrectomy in adults. J Urol. 2014; 192: 1612-1618.
[21] Mibu H, Tanaka N, Hosokawa Y, Kumamoto H, Margami N, Hirao Y, Fujimoto K. Estimated functional renal parenchymal volume predicts the split renal function following renal surgery. World J Urol. 2015; 33: 1571-1577.
[22] Isotani S, Shimoyama H, Yokota I, Noma Y, Kitamura K, China T, Saito K, Hisasue S, Ide H, Muto S, Yamaguchi R, Ukimura O, Gill IS, Horie S. Novel prediction model of renal function after nephrectomy from automated renal volumetry with preoperative multidetector computed tomography (MDCT). Clin Exp Nephrol. 2015; 19: 974-981.
[23] Kim DK, Jang Y, Lee J, Hong H, Kim KH, Shin TY, Jung DC, Choi YD, Rha KH. Two-year analysis for predicting renal function and contralateral hypertrophy after robot-assisted partial nephrectomy: A three-dimensional segmentation technology study. Int J Urol. 2015; 22: 1105-1111.
[24] Mir MC, Campbell RA, Sharma N, Remer EM, Simmons MN, Li J, Demirjian S, Kaouk J, Campbell SC (2013) Parenchymal volume preservation and ischemia during partial nephrectomy: functional and volumetric analysis. Urology. 2013; 82: 263-268.
[25] Park BH, Jeong BC, Jeon SS, Seo SI, Lee HM, Choi HY, Jeon HG. Volumetric measurement of compensatory hypertrophy in the contralateral normal kidney by the tumor growth. World J Urol. 2016; 34: 63-68.
[26] Lindblad P, Chow WH, Chan J, Bergström A, Wolk A, Gridley G, McLaughlin JK, Nyrén O, Adami HO. The role of diabetes mellitus in the aetiology of renal cell cancer. Diabetologia. 1999; 42: 107-112.
[27] Shapiro JA, Williams MA, Weiss NS, Stergachis A, LaCroix AZ, Barlow WE. Hypertension, antihypertensive medication use, and risk of renal cell carcinoma. Am J Epidemiol. 1999; 149: 521-530.
[28] Shapiro JA, Williams MA, Weiss NS. Body mass index and risk of renal cell carcinoma. Epidemiology. 1999; 10: 188-191.
[29] Yuan JM, Castelao JE, Gago-Dominguez M, Yu MC, Ross RK. Tobacco use in relation to renal cell carcinoma. Cancer Epidemiol Biomarkers Prev. 1998; 7: 429-433.