National Conference on Recent Trends in Synthesis and Characterization of
Futuristic Material in Science for the Development of Society
(NCRDAMDS-2018)
In association with
InternationalJournal
of
ScientificResearch inScience andTechnologyMethod Development and Validation of Stability Indicating
RP-HPLC Method for Estimation of Metformin and Miglitol in
Pharmaceutical Dosage Form
Faisal A. Shaikh
1,Ashish A Gawai
21
Gawande College of Pharmacy,Sakharkherda, Maharashtra, India 2
Anuradha College of Pharmacy,Chikhali, Maharashtra, India
ABSTRACT
The data obtained from result and discussion it showed that the RP-HPLC method for estimation of pharmaceutical dosage form was developed successfully. The RP-HPLC analysis was performed on the PRIMESIL
C18,(250*4.6)mm, 5µm particle size in the isocratic mode, at Ambient column oven temperature using Acetonitrile:
Water (80:20 v/v) as mobile phase; flow rate was adjusted to 0.7 ml/min. The detection was carried out at 236nm. The average retention time for candidate drugs was found to be 3.7333 and 8.5833 min. Linearity was observed in
the concentration range of 20-100 µg/ml (r2= 0.9987 and r2=0.9984). The method has been successively applied for
the determination of candidate drug in tablet formulation. There was no interference from the excipients present in the tablet. The drug content was found to be 101.63% for candidate drug. Accuracy of the method was studied by the recovery studies at three different levels 80%, 100%, 120%. The % recovery was found to be within the limit of the acceptance criteria with average recovery of 98-102. According to USP, system suitability tests are integral part of chromatographic methods. They are used to reproducibility of the chromatographic system.
I.
INTRODUCTION
Metformin, marketed under the trade name Glucophage among others, is the first-line medication for the treatment of type 2 diabetes, particularly in people who are overweight. It is also used in treatment of polycystic ovary syndrome. Limited evidence suggests metformin may prevent the cardiovascular disease and cancer complications of diabetes. Chemical name:
N,N-Dimethyllimidodicarbonimidic diamide. Empirical
formula: C4H11N5. Molecular weight: 129.164.
Description: Metformin is an orally administered biguanide derivative used to lower blood glucose. M.P: 224 °C. Solubility: It is soluble in Acetonitrile; sparingly soluble in water. Bioavailability: Metformin, 50–60%. Half–life: 4-8.7 hours. Volume of distribution. 654 ± 358 L. Clearance: renal clearance (CLr) is 510±120 ml/min. Active tubular secretion in the kidney is the principal route of metformin elimination. Protein
binding. plasma protein binding of metformin is
negligible Dose. 1.25 to 5 mg daily with a maximum of 10 mg daily.
Structure:
Miglitol is an oral anti-diabetic drug that acts by inhibiting the ability of the patient to break down complex carbohydrates into glucose. It is primarily used in diabetes mellitus type 2 for establishing greater glycemic control by preventing the digestion of carbohydrates (such as disaccharides, oligosaccharides, and polysaccharides) into monosaccharides which can
be absorbed by the body. Chemical name:
Molecular weight: 207.22. Description: Miglitol is an oral anti-diabetic drug that acts by inhibiting the ability of the patient to breakdown complex. M.p. 146°. Toxicity. Symptoms ofoverdose are transient increase in flatu-lence, diarrhea, and abdominal discomfort. Bioavailability: 50-70%. Half–life: 2 hours.Volume of distribution. 0.18 L/kg. Clearance. Systemic plasma clearance, about 0.8 L/min. Protein binding. The protein binding of miglitol is negligible (<4.0%). Dose. An initial dose of 5 mg daily is given followed by a usual maintenance dose of 2.5 to 10 mg. Elderly and patients with impaired liver function: initial dose of 2.5 mg daily.
Structure:
II.
MATERIALS AND METHOD
A. Materials : Acetonitrile, Distilled Water, Metformin,
and Miglitol.
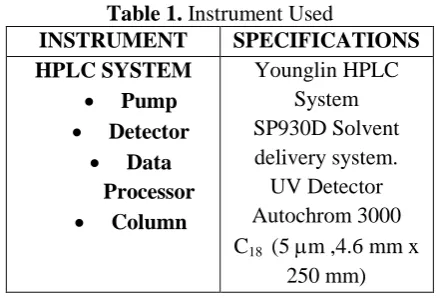
Table 1. Instrument Used
INSTRUMENT SPECIFICATIONS
HPLC SYSTEM Pump Detector Data Processor Column Younglin HPLC System SP930D Solvent delivery system. UV Detector Autochrom 3000 C18 (5 m ,4.6 mm x
250 mm)
1.
Selection of Chromatographic Parametersa) Selection of Stationary Phase : Primesil C18 (4.6
mm x250 mm) with Particle Size 5 m Was Selected.
b) Selection of Solvent: Acetonitrile and Water was
selected as a solvent for Metformin and Miglitol.
B.METHOD
1. Preparation of Stock Standard Solution
Stock Standard Solution was Prepared by dissolving 10 mg Metformin and 10 mg of Miglitol in 10 ml Methanol that give concentration of 1000 µgm/ml Metformin 1000 µgm/mL Miglitol.
2. Optimization of Chromatographic Parameters Optimization in HPLC is the process of finding as set of condition that adequately separate and enable the quantification of the analytes from the endogeneous material with acceptable accuracy, precision, sensitivity, specificity, cost, ease and speed.
3. Optimization of Mobile Phase Strength
The mobile phase was chosen after several trials with Acetonitrile and Water in various proportions. A mobile Phase consisted of Acetonitrile and Water (80:20v/v) was selected to achieve symmetrical peak. The effects of flow rates in the ranges of 0.5 to 1ml/min. were examined. A flow rate of 0.7ml/ min. gave good results, system suitability parameter and reasonable retention time. The retention time of Metformin and Miglitol Was observed 3.7333 and 8.5833 min at 236nm wavelength. Finalized chromatographic conditions are shown in table 2.
The following chromatographic conditions were established by trial and error and were kept constant throughout the experimentation.
Table 2. Chromatographic condition Chromatographic condition
HPLC Software Column Particle size packing Stationary phase Mobile phase Detection Wavelength Flow rate Temperature Sample size Younglin (S.K.)Gradient
system. UV
Detector Autochro -3000 4.6 x 250 mm 5 m
C18 (primesil) Acetonitrile:Water (80:20)
236 nm 0.7 ML/min. Ambient 20l.
Linearity studies
diluted up to the mark with methanol such that to obtained concentration of Metformin and Miglitol in the
range 20-100 l/ml. Volume of 20µL of each sample
was injected with the help of Hemilton syringe. All measurements were repeated two time for each concentration and curve was constructed by plotting the peak area versus the drug concentration. The observation and calibration curve is shown in table 3.
Table 3. Data showing Linearity study of Metformin. Sr.
No.
Concentration
of Ramipril
(g/mL)
Mean peak area
SD %RSD
1 20 1344.83 9.86 0.73
2 40 2882.78 7.44 0.26
3 60 4088.74 84.34 1.34
4 80 5402.78 57.57 1.07
5 100 6715.85 33.11 0.49
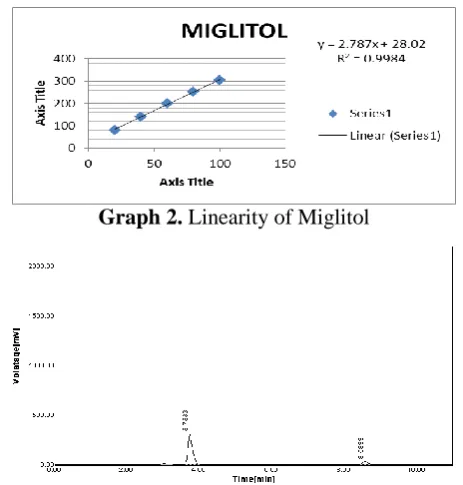
Table 4. Data showing Linearity study of Miglitol.
Sr. No.
Concentration of Felodipine (g/mL)
Mean peak area
SD %RSD
1 20 80.715 1.12 1.39
2 40 139.705 0.60 0.43
3 60 200.97 3.45 1.72
4 80 251.07 2.36 0.94
5 100 303.735 5.48 1.80
Graph 1. Linearity of Metformin
Graph 2. Linearity of Miglitol
Figure 1. Chromatogram of standard of Metformin and Miglitol. ( 10 g/mL )
The Trial Experimental work was carried out for linearity parameter and the graphs has obtained has shown in the Figure 3,4,5,6,7,8, as follows
Trial 1. of Metformin and Miglitol with Acetonitrile:
water (90:10) at 235 nm with flow rate 0.7ml
Figure 2. Chromatogram of Metformin and Miglitol
Table 5. Trial 1 of Metformin and Miglitol No . RT[m in] Area[m V*s] Area %
TP TF Resolu
tion
1 3.416
7 2279.56 59 98.8 2 161 8.3 1.38 89 0.0000
2 4.800
0
27.2441 1.18 718
Trial 2. Metformin and Miglitol with Acetonitrile: water (80:20) at 235 nm with flow rate 0.7ml.
Figure 3. Chromatogram of Metformin and Miglitol
Table 6. Trial 2 of Metformin and Miglitol
No. RT[min] Area[mV*s] Area% TP TF Resolution
1 3.8000 191.5861 16.67 8007.3 0.7917 0.0000
2 4.0833 366.3116 31.87 1027.3 1.7143 0.2394
3 4.4667 102.8074 8.94 398278.4 1.2000 1.2105
4 4.7500 156.6841 13.63 3127.8 1.0714 1.3077
5 5.1833 113.9153 9.91 6621.4 1.0625 1.1818
6 5.3833 54.6425 4.75 4938.7 3.2500 0.6667
7 5.6667 163.6040 14.23 134.6 1.3333 0.2957
Sum 1149.5511
Trial. 3. Metformin and Miglitol with Acetonitrile: water (80:20) at 240 nm with flow rate0.7ml.
Figure 4. Chromatogram of Metformin and Miglitol.
Table 7. Trial 3 of Metformin and Miglitol
No. RT[min] Area[mV*s] Area% TP TF Resolution
1 6.0667 178.9879 17.32 7347.2 1.1111 0.0000
2 7.1167 653.7641 63.24 8355.8 1.0417 3.0000
3 8.5167 200.9586 19.44 10055.3 0.9667 3.6522
Trial 4. Metformin and Miglitol with Methanol:water (60:40) at 238nm with Flow rate 0.7.
Figure 5. Chromatogram of Metformin and Miglitol.
Table 8. Trial 4 of Metformin and Miglitol
No. RT[min] Area[mV*s] Area% TP TF Resolution
1 6.0500 181.1603 11.19 7306.9 1.0500 0.0000
2 7.1000 1058.1221 65.37 8316.7 1.0000 3.0000
3 8.4333 379.2775 23.43 9859.5 1.0000 3.4783
Sum 1618.5598
Trial 5. Metformin and Miglitol with Methanol:water (80:20) at 238nm with Flow rate 0.7
Figure 6. Chromatogram of Metformin and Miglitol.
Table 9. Trial 5 of Metformin and Miglitol
No. RT[min] Area[mV*s] Area% TP TF Resolution
1 3.6000 56907.8906 99.89 2587.2 2.3333 0.0000
2 9.3167 65.5109 0.11 8840.7 1.1538 14.2917
Sum 56973.4023
Trial 6. Metformin and Miglitol with Acetonitrile: water (80:20) at 236 nm with flow rate 0.7ml
Figure 7. Chromatogram of Metformin and Miglitol
Table 10. Trial 6 of Metformin and Miglitol
No. RT[min] Area[mV*s] Area% TP TF Resolution
1 3.7333 2947.3479 88.55 2782.4 1.4286 0.0000
2 8.5833 381.0026 11.45 12154.8 0.9615 13.8571
Sum 3328.3506
III.
RESULTS AND DISCUSSION
1 Determination of max of Metformin and Miglitol
The -max was determined on Shimadzu UV-Visible
spectrophotometer in the range 200-400 nm using methanol as blank. Spectrophotometric study of Metformin and Miglitol was carried out in methanol. Optimum solubility of the drugs was obtained in the methanol. Spectral study showed that the max for the Metformin and Miglitol at 236 nm. The solution of exhibited maxima at about 236 nm .
The primary target in developing this stability indicating RP-HPLC method is to achieve resolution of drug and its degradation product. We use a stationary phase C-18.
A mobile phase consisting of different buffers ratio and column, but peak shape and retention time of Metformin and Miglitol broad compared to water, acetonitrile composition as mobile phase, pH was adjust 3.2±0.05 with orthophosphoric acid. Acetonitrile : Water ratio was selected at proportion of 80:20. This shows good resolution chromatogram with symmetrical peaks.
Figure 8. UV Curve of Metformin
Figure 10. Isobestic point of Metformin and Miglitol
IR ANALYSIS
IR ANALYSIS OF METFORMIN:
Figure 11. IR Interpretation of Metformin
Table 11. Interpretation of Metformin
Sr No Observation Peak Region
1 Primary N-H Stretching 3400-3200
2 Secondary N-H
Stretching
3300-3100
3 Aliphatic C-H Stretching 2900-2700
4 C=N Stretching 1700-1600
5 C-N Stretching 1300-1000
IR ANALYSIS OF MIGLITOL:
Figure 12. IR Interpretation of Miglitol
Table 12. Interpretation of Metformin
Sr No Observation Peak Region
1 Primary O-H Stretching 3400-3200
2 Aliphatic C-H Stretching 2900-2700
3 C-N Stretching 1300-1000
4 O-H Bending 1000-900
IR ANALYSIS OF METFORMIN AND MIGLITOL:
Figure 13. IR Interpretation of Metformin andMiglitol
Table 13. Interpretation of Metformin and Miglitol
Sr No Observation Peak Region
1 Primary O-H Stretching 3400-3200
2 Primary N-H Stretching 3400-3200
3 Secondary N-H Stretching 3300-3100
4 Aliphatic C-H Stretching 2900-2700
5 C=N Stretching 1700-1600
6 C-N Stretching 1300-1000
7 O-H Bending 1000-900
Tablet Assay for Metformin and Miglitol:
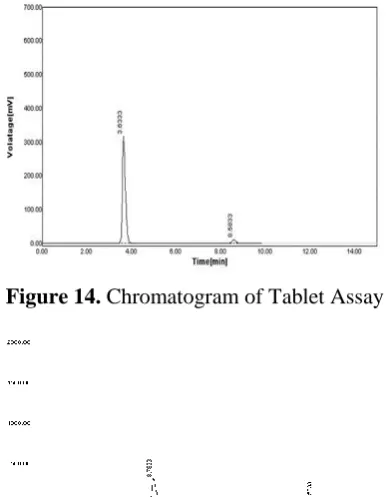
Table 14. Data Showing Tablet Assay
Conc Area Amt Found % Label Claim
40.00 2803.15 40.65 101.63
40.00 2831.26 41.06 102.65
Mean 2817.21 39.67 102.14
SD 19.88 0.29 0.07
Figure 14. Chromatogram ofTablet Assay
Figure 15. Chromatogram Of Standard Solution
Acceptance criteria:
The % assay should be within 98102%.
The results of the assay indicate that the method is selective for the analysis of Metformin and Miglitol without interference from the excipients used to formulate and produce these tablets.
Validation of RP-HPLC Method For Metformin and
Miglitol
Method of Precision:
The precision of an analytical procedure expresses the closeness of agreement (degree of scatter ) between a series of measurements obtained from multiple sampling of the same homogeneous sample under the prescribed conditions precision may be considered as three levels repeatability, intermediate precision and reproducibility. The %RSD should not be more than 2%.
Table 15. Precision of Metformin. Sample
no. Conc. Area I Area II Mean SD %RSD
1 40 2902.96 2956.85 2929.91 38.11 1.30
2 60 4178.32 4255.2 4216.76 54.36 1.29
3 80 5523.28 5497.22 5510.25 18.43 0.33
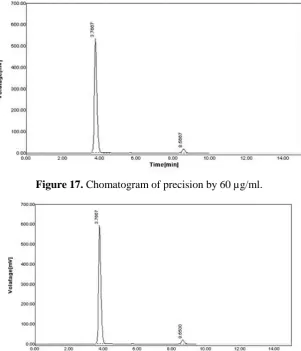
Table 16. Precision of Miglitol. Sample
no. Conc. Area I Area II Mean SD %RSD
1 40 139.86 136.42 138.14 2.43 1.76
2 60 201.96 199.1 200.53 2.02 1.01
3 80 249.36 251.72 250.54 1.67 0.67
Figure 17. Chomatogram of precision by 60 µg/ml.
Figure 18. Chomatogram of precision by 80 µg/ml.
Acceptance criteria: % RSD NMT 2% for test results.
a) Repeatability (Intra-Assay precision): Repeatability express the precision under the same operating condition
over a short intervals of time. Repeatability is also termed as intra-assay precision.
Table 17. Repeatability of Metformin and Miglitol.
Figure 19. Chromatogram of Repeatability by 20 µg/ml. Metformin and Miglitol.
Reno. Conc. Peak Area Amt. Found % Amt. Found
1 60 4221.32 60.91 101.52
2 60 202.92 61.62 102.70
Mean 61.26 102.11
SD 0.51 0.84
Figure 20. Chromatogram of Repeatability by 20 µg/ml. Metformin and Miglitol.
Acceptance criteria:
% RSD of Two standard injections should not be more than 2.0. Results obtained lies well within the acceptance criteria.
b) Intermediate precision: Intermediate precision expresses within laboratory variations different day, different analyst or equipment etc. Intermediate precision is usually demonstrated by repeated measurement of the sample used in therapeatability experiment within the same laboratory
c) Reproducibility: Reproducibility expresses the precision between laboratories (collaborative studies, usually applied to standardisation of methodology). Repeatability is usually demonstrated by means of an inter laboratory trial.
Specificity:
Specificity is ability to asses unequivocally the analyte in the presence of components that may be expected to be present. Typically these might be include impurities, degradents, matrix etc.
Specificity may often be expressed as the degree of bias of test results obtained by analysis of samples containing added impurities, degradation products, related chemical compounds, or placebo ingredients when compared to test results without added substances.No peak is observed and the result shows that the method is specific for estimation. Accuracy:
The accuracy of an analytical procedure expresses the closeness of agreement between the value which is accepted either as convention true value which is accepted either as a conventional true value or an accepted reference value and the value found. This is sometime termed trueness. Accuracy should be established across the specified range of analytical procedure. Accuracy is usually demonstrated by adding known amounts of analyses to the sample matrix and determined the measured result using the analytical procedure. Result shows that the Method is accurate and precise.
Table 18. Accuracy of Metformin.
Metformin Sample No.
80% % Recovery
100% % Recovery
120% % Recovery
1 97.99 100.70 101.94
2 97.02 99.35 101.40
Mean 97.51 100.03 101.58
SD 0.69 0.95 0.38
Figure 21. Chromatogram Accuracy of Metformin.
Table 19. Accuracy of Miglitol. Miglitol
Sample No.
80% % Recovery
100% % Recovery
120% % Recovery
1 99.31 102.26 97.96
2 101.29 101.73 99.08
Mean 100.30 102.00 101.58
SD 1.40 0.37 0.79
%RSD 1.40 0.37 0.78
Figure 22. Chromatogram Accuracy of Miglitol. Acceptance Criteria:
Recovery at each level and % mean recovery should be between 98-102 with % RSD should not be more than 2.0%.
The % recovery at each level, % mean recovery, and % RSD at each level meets the established acceptance criteria. Hence the method is accurate in the specified range.
Linearity:
The correlation coefficient, y-intercept, slope of the regression line and residual sum of squares should be calculated. A plot of the data should be included. In addition, an analysis of the deviation of the actual data points from the regression line may also be helpful for evaluating linearity.
A minimum of five concentrations is recommended other approaches should be justified.
Table 20. Linearity of Metformin.
Conc. Mean SD %RSD
20 1344.83 9.86 0.73
40 2882.78 7.44 0.26
60 4088.74 84.34 1.34
80 5402.78 57.57 1.07
100 6715.85 33.11 0.49
Graph 3. Linearity of Metformin.
Table 21. Linearity of Miglitol.
Conc. Mean SD %RSD
20 80.715 1.12 1.39
40 139.705 0.60 0.43
60 200.97 3.45 1.72
80 251.07 2.36 0.94
100 303.735 5.48 1.80
Acceptance criteria:
The correlation coefficient value should not be less than 0.995. The areas obtained are directly proportional to the concentration of analyte in the sample. The method is linear in the specified range.
Robustness:
The procedure for the commencement of method validation was followed. The result were obtain are as follows.
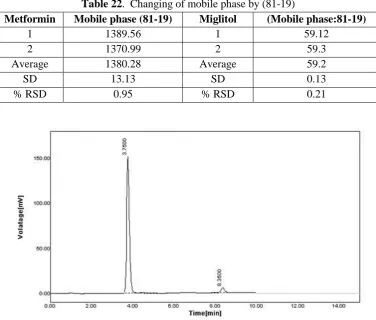
Changing of mobile phase by ±1 ml.
Table 22. Changing of mobile phase by (81-19)
Metformin Mobile phase (81-19) Miglitol (Mobile phase:81-19)
1 1389.56 1 59.12
2 1370.99 2 59.3
Average 1380.28 Average 59.2
SD 13.13 SD 0.13
% RSD 0.95 % RSD 0.21
Figure 23. Chromatogram of Robustness Changing of mobile phase by (81-19)
Table 23. Changing mobile phase by (79-21)
Metformin Mobile Phase (79-21) Miglitol Mobile Phase (79-21)
Sample no. Robustness Sample no. Robustness
1 1348.26 1 57.25
2 1366.59 2 56.99
Average 1357.4 Average 57.12
SD 12.96 SD 0.18
Figure 24. Chromatogram of Robustness Changing mobile phase by (79-21)
Changing Flow rate 0.1 ml.
Table 24. Changing Flow rate 0.8 ml.
Metformin Flow rate :0.8
ml Miglitol
Flow rate: 0.8ml
Sample no. Robustness Sample no. Robustness
1 1185.1 1 51.07
2 1174.91 2 49.67
Average 1180.01 Average 50.37
SD 7.21 SD 0.99
%RSD 0.61 %RSD 1.97
Figure 25. Chromatogram of Robustness Changing Flow rate 0.8 ml.
Table 25. Changing Flow rate 0.6 ml.
Metformin Flow rate 0.6 ml Miglitol Flow rate 0.6 ml
Sample no. Roubstness Sample no. Roubstness
1 1540.21 1 59.39
2 1538.11 2 61.06
Average 1539.16 Average 60.23
SD 1.48 SD 1.18
%RSD 0.10 %RSD 1.96
Figure 26. Chromatogram of Robustness Changing Flow rate 0.6 ml.
Changing Wavelength by ±1nm.
Table 26. Changing wavelength by +237 nm.
Metformin Wavelength 237nm Miglitol Wavelength 237nm
Sample no. Roubstness Sample no. Roubstness
1 1312.77 1 51
2 1310.3 2 52.07
Average 1311.5 Average 51.5
SD 1.75 SD 0.76
%RSD 0.13 %RSD 1.47
Table 27. Changing wavelength by - 235 nm.
Metformin Wavelength 235 nm Miglitol Wavelength 235 nm
Sample no. Roubstness Sample no. Roubstness
1 1364.92 1 51.99
2 1397.32 2 53.01
Average 1381.12 Average 52.50
SD 22.91 SD 0.72
%RSD 1.66 %RSD 1.37
Figure 28. Chromatogram of robustness changing wavelength by - 235 nm.
STABILITY Acid Degradation
Table 28. Data Showing Stability For Acid Degradation (0.1 N HCL) ( After 1 Hr)
No. Name RT[min] Area[mV*s] Area% TP TF Resolution
1 DEG 1 3.1000 1816.6869 35.56 2997.5 1.2727 0.0000
2 MET 3.7333 3031.1052 59.33 1932.2 0.9231 1.9000
3 DEG 2 4.5167 88.0248 1.72 3365.7 1.1250 2.0435
4 DEG 3 5.4667 31.5897 0.62 2330.4 0.9063 2.1111
5 MIG 8.3333 141.5015 2.77 9627.1 1.0294 6.1429
Sum 5108.9082
Figure 29. Chromatogram of stability for Acid Degradation (0.1 N Hcl) ( After 1 Hr)
Base Degradation For 0.1N NaoH
Table 29. Data showing stability for base degradation (0.1 N NaoH) ( After 1 Hr)
DEG 1= Degradation, DEG 2= Degradation, MET= Metformin, MIG= Miglitol.
Figure 30. Chromatogram of stability for Base Degradation of 0.1N NaoH ( After 1 Hr)
Oxidative/ Peroxide Degradation:
Table 30. Data Showing Stability For 3% H2O2 ( After 1 Hr)
No. Name RT[min] Area[mV*s] Area% TP TF Resolution
1 DEG 1 3.0833 30.8480 0.49 1897.8 1.0000 0.0000
2 MET 3.9000 6026.0122 96.68 841.1 0.6852 1.6897
3 DEG 2 5.7167 26.7433 0.43 1479.3 0.8889 2.7250
4 MIG 8.7500 149.5588 2.40 10613.9 1.0833 5.5152
Sum 6233.1621
DEG 1= Degradation, MET= Metformin, DEG 2= Degradation, MIG= Miglitol.
No. Name RT[min] Area[mV*s] Area% TP TF Resolution
1 DEG 1 3.1833 49.3753 1.26 5619.3 0.9000 0.0000
2 DEG 2 3.3167 15.7109 0.40 8783.8 1.1667 0.7273
3 MET 3.8333 3728.2952 95.40 1303.7 0.7895 1.5500
4 MIG 8.3333 114.7569 2.94 9627.1 1.0000 10.0000
Figure 31. Chromatogram of stability for of 3% H2O2 ( After 1Hr)
Neutral Degradation After 1 Hr min.
Table 31. Data showing stability for H2O (After 1 Hr)
No. Name RT[min] Area[mV*s] Area% TP TF Resolution
1 DEG 1 3.1167 52.9534 1.63 1346.6 1.1000 0.0000
2 MET 3.8333 3049.0105 94.01 1496.6 0.9333 1.6538
3 DEG 2 5.7167 21.0371 0.65 4530.5 0.8947 4.3462
4 MIG 8.7167 120.2059 3.71 10533.1 1.0000 7.5000
Sum 3243.2068
DEG 1= Degradation, MET= Metformin, DEG 2= Degradation, MIG= Miglitol.
Figure 32. Chromatogram of Stability For Neutral Degradation of H2O( After 1Hr.)
For 1N NaOH
Table 32. Data Showing Stability For Base Degradation (1 N NaOH) ( After 1Hr )
No. Name RT[min] Area[mV*s] Area% TP TF Resolution
1 DEG 1 3.2000 67.8441 1.38 3194.0 0.8571 0.0000
2 MET 3.7333 3543.6804 71.94 2782.4 0.6400 1.7778
3 DEG 2 3.8833 1113.6755 22.61 2488.0 5.5000 0.4286
4 DEG 3 4.3333 71.8982 1.46 81.1 5.2143 0.3418
5 MIG 8.3500 128.7018 2.61 9665.6 0.9000 3.0125
Sum 4925.8003
Figure 33. Chromatogram of stability for Base Degradation of 1N NaOH (After 1 Hr) For 5% H2O2
Table 33. Data showing Stability For 5% H2O2 ( After 1 Hr)
No. Name RT[min] Area[mV*s] Area% TP TF Resolution
1 DEG 1 3.0167 44.5053 0.88 1816.7 0.5690 0.0000
2 MET 3.6500 4863.0430 96.40 1846.9 0.8250 1.7273
3 DEG 2 5.5167 21.7153 0.43 7500.5 0.8824 5.3333
4 MIG 8.4500 115.1934 2.28 11780.1 1.0000 8.8000
Sum 5044.4570
DEG 1= Degradation, MET= Metformin, DEG 2= Degradation, MIG= Miglitol.
Figure 34. Chromatogram of Stability For of 5% H2O2 ( After 1 Hr)
IV.
REFERENCES
[1]. Chatwal G.R., Sharma A., Instrumental Methods
of Chemical Analysis, Himalaya Publishing House, Delh 5th Edn., 2004, 1.1-1
[2]. Skoog, D.A., Holler, F.J. and Nieman, T.A., In
Principles of Instrumental Analysis, 5, Thomson Brooks/Cole, 1998, 329-335.
[3]. Kasture A.V., Mahadik K.R., More H.N.,
Instrumental Methods 14(2), Niraliprakashan, Pune, 2006,44-55.
[4]. Sethi, P.D., In; HPLC ‘High Performance Liquid
Chromatography’, Quantitative Analysis of Pharmaceutical Formulations, 1, CBS Publishers and Distributors, New Delhi, 2001, 3-72, 116-120.
[5]. Beckett A.H. and Stenlake, J.B., In; Practical
Pharmaceutical Chemistry, 4(2), CBS Publishers and Distributors, New Delhi, 2002, 275-278, 281-300.
[6]. Christian, G.D., In; Analytical Chemistry, 6. Jhon
Wiley and Sons, 2004, 1-7.
[7]. Connors, K.A., In; A Textbook of Pharmaceutical
[8]. Brown, R.P., Reversed-Phase High Performance Liquid Chromatography, Theory, Practice and Biomedical Applications, 1982, 10-20.
[9]. Saint Louis, MO, ETATS-UNIS, International
Symposium on High Performance Liquid Phase Separations and Related Techniques No 22, 1998, 828(1-2), 283-286.
[10]. Mohammad Yunoos, Gowri sankar D. A
Validated Stability Indicating High-Performance
Liquid Chromatographic Method for
Simultaneous Determination of Metformin HCL and Dapagliflozin in Bulk Drug and Tablet Dosage Form. Asian J Pharm Clin Res 2015; Vol 8: Issue 3, 320-326.
[11]. Pravin Kumar S, Aruna G. Analytical Method
Development and Validation of Alogliptin and Metformin Hydrochloride Tablet Dosage form by RP-HPLC Method. Int Bulletin Drug Res 2013; 3(5): 58-68.
[12]. Anandkimar Tengli R, Vishwanathan B. Method
Development and Validation of Metformine, Pioglitazone and Glibenclamide in Tablet Dosage Form by using RP-HPLC. Biochem Anal Biochem 2013; 2(2): 130.
[13]. Chittora NC,Jain A. New RP-HPLC Method of
Miglitol in Tablet Dosage form Including Forced Degradation Studies and Estimation in Spiked Rabbit Plasma. J Young Pharm 2009;1(4): 364-370.
[14]. Sambasiva Rao M, Ashok Kumar A. New RP
HPLC method for the estimation of imatinib in pharmaceutical dosage form. ICJPIR 2016; 3(1): 72-94.
[15]. Sejal Patel R, Prachi Kabra V. A Development
and Validation of Analytical Method for
Quantitative Estimation of Miglitol and
Metformin in Combined Dosage Form. J Applied Pharm Sci 2012; 02(06): 227-229.
[16]. Tatarkiewicz K, Polizzi C, Villescaz C, D’Souza
LJ, Wang Y, Janssen S, et al. Combined
antidiabetic benefits of exenatide and
dapagliflozin in diabetic mice. Diabetes Obes Metab 2014;16(4):376-80.
[17]. Lambers Heerspink HJ, de Zeeuw D, Wie L,
Leslie B, List J. Dapagliflozin a glucose-regulating drug with diuretic properties in subjects with type 2 diabetes. Diabetes Obes Metab 2013;15(9):853-62.
[18]. Aubry AF, Gu H, Magnier R, Morgan L, Xu X,
Tirmenstein M, et al. Validated LC-MS/MS methods for the determination of dapagliflozin, a sodium-glucose co-transporter 2 inhibitor in normal and ZDF rat plasma. Bioanalysis 2010;2(12):2001-9.
[19]. Sanagapati M, Lakshmi DK, Reddy NG,
Sreenivasa S. Development and validation of stability - Indicating RP-HPLC method for determination of dapagliflozin. J Adv Pharm Edu Res 2014;4(3):350-3.
[20]. Madhukar A, Prince A, Vijay Kumar R, Sanjeeva