The Robust Learning Model With
A Spiral Curriculum: Implications
For The Educational Effectiveness
Of Online Master Degree Programs
Yoram Neumann, Touro University Worldwide, USA Edith Neumann, Touro University Worldwide, USA
Shelia Lewis, Touro University Worldwide, USA
ABSTRACT
This study integrated the Spiral Curriculum approach into the Robust Learning Model as part of a continuous improvement process that was designed to improve educational effectiveness and then assessed the differences between the initial and integrated models as well as the predictability of the first course in the integrated learning model on a wide range of educational effectiveness indicators for online master degree programs.
Meaningful improvement in educational effectiveness was validated by the study. The importance of the first course's predictors in predicting and explaining the various degree program educational effectiveness indicators was also very instrumental.
The theoretical and practical implications of the study's findings for online faculty, university administrators, and policy makers were examined.
Keywords: Learning Model; Online Learning; Educational Effectiveness; Spiral Curriculum
INTRODUCTION
nline education has gained acceptance in recent years. The most recent U.S Department of Education data from fall 2014 indicated that 5.8 million students took at least one online course, with 2.85 million of them studying exclusively online. Among graduate degree programs, 25% of students enrolled in exclusively online degree courses (725,722 out of a total of 2,918,582). The role of online learning is then proportionally more significant in master degree programs than in undergraduate programs. Therefore, the focal points of this study are the online master degree programs.
Like in any area of higher education, there are quality online learning experiences and many less successful programs resulting in low retention, low graduation rates, and extending the time needed to complete degree programs. The MOOCs movement is still popular among various constituencies but its widespread use in degree programs is quite limited. The competency-based approach, with a major focus on the cognitive domain, recently gained popularity both among academicians and policy makers although its widespread use is still limited especially when the goal is to reduce the time-to-degree and increase graduation rates for underserved groups.
have been developed, the Robust Learning Model (RLM) was the first integrative learning approach to online degree programs.
THE ROBUST LEARNING MODEL (RLM)
Built on studies of student success and learning (Neumann & Neumann 1989a, 1993, 1995; Neumann, Neumann, & Reichel, 1990), Neumann and Neumann (2010) developed, implemented, and assessed the Robust Learning Model as the foundation for building multiple online degree programs as well as online universities. Neumann and Neumann (2016) initially engendered the RLM as the basis of the development of a forward-looking and sustainable online university. They developed a "multi-factorial model based on the basic belief that successful learning outcomes depend on multiple factors employed together in a holistic approach," which can be used to manage an entire university (Neumann & Neumann, 2010, p. 28). This approach was used twice to manage an entire university (Neumann & Neumann, 2016). "The RLM was developed adhering to the following standards:
• Comprehensive to enable systematic applications to all degree programs.
• Widespread relevance for many groups of learners including adult and mobile learners.
• Built in mechanism for accountability, transparency, affordability, and quality assurance.
• Budget and resource allocation plan designed to meet the needs of the various components of the model based on projected enrollment growth and pre-defined quality improvements.
• Provides Scalability in all activities. Results in verifiable attainment of learning outcomes of students for each degree program" (Neumann & Neumann, 2010, p. 28-29).
Key principles guided the RLM. It applied the latest research results from cognitive psychology and the psychology of learning to enhance student success in online learning. More specifically, the RLM emphasized interactive and self-regulated learning while persistently and intrinsically motivating the learner. The learning support services were specifically designed to support the model. Similarly, a customized and integrated learning management system with built in assessment and data analytics were developed to support the learner and student support services while alerting faculty in real time on learner success or problems that needed to be individually addressed throughout the course or the program. This integrated IT system did not only focus on the continuous support and improvement of student learning or the effective faculty interactive teaching but it also provided real time reports on student progress in their courses and degree program, retention, graduation rates, time-to-degree, and the attainment of the degree program learning outcomes and competencies.
The pedagogy of the programs was one of the basic factors developed in the RLM and included multiple levels: university learning outcomes, degree program learning outcomes (PLOs), and course-level student learning outcomes (SLOs) (Neumann & Neumann, 2010). The main focus was on consistency across programs and courses, alignment of mission and goals of the university with those of the program, alignment of degree program learning outcomes with course level learning outcomes, and being hierarchical and exhaustive at a rigor commensurate with the degree level (ibid). A faculty committee assessed the degree to which the totality of the course SLOs was rigorously leading to the attainment of the PLOs.
The courses were module-based developed across all degree programs. At the course level, students engaged in a variety of learning activities as follows (Neumann & Neumann, 2010):
Case Assignment (Problem-Based Learning)
The Case Assignment was a written description of a problem or situation. Most cases were a snapshot of a particular situation within a complex environment. The student was required to conduct research (information literacy), synthesis of information (critical thinking), to distinguish between pertinent information and peripheral facts, to identify central alternatives among several issues competing for attention, and to formulate strategies and recommendations.
embedded in the grade book. Faculty grading the Case Assignment filled out the rubric and the database system provided reports by student and/or by course. Faculty committees used those reports for assessing students’ competencies across courses students enrolled in throughout the term(s). The University developed the capability to assess whether those competencies improved over time as students moved forward in the program.
Threaded Discussion
At least twice per week/module, the students participated in online class discussions (Threaded Discussions-TDs) according to the instructor's guidance. Students needed to read, understand, write and participate in discussions. The TDs developed communication competencies and provided opportunities for peer-to-peer interaction and student-to- faculty interaction. In addition, the TDs provided opportunities for students to demonstrate cognitive and meta-cognitive skills related to the specified topic. The University used a content analysis mode of assessing achievement of the SLOs within the TDs.
Signature Assignment
The students’ Signature Assignments (SAs) were submitted by the student at the end of each course. The SA provided direct evidence of the students’ level of competency of the course SLOs. A SA consists of a research paper or a project that encompassed all the Student Learning Outcomes (SLOs) of the course. The SA entailed a formative process; it was divided into several steps, each of which was submitted separately (outline, bibliography, draft, final) and each of these required the faculty’s prompt feedback. The completed SAs were assessed by the faculty utilizing an SLO rubric to state whether the student’s submitted work “exceeded,” “met,” or “did not meet” expectations. An SLO heat map is created by course to provide an aggregated snapshot of SLO achievement for a specified course. In addition, the heat map assessed whether the courses SLOs were achieved within the course and whether deficiencies were due to course design, faculty, or student failure in meeting SLOs.
Self- Reflective Essay
Students reflected upon what they learned or how they performed in the course comparing those self-assessments with their own expectations or goals. Students were to address five items ranging from how they feel the course improved their knowledge, skills, and abilities as well as to self-report if course SLOs were achieved. The University utilized a content analysis to assess the achievement of the SLOs in the Self Reflective Essays.
Capstone Course at the end of each Program
The capstone course was the required course at the end of each program. It provided students the forum to combine various competencies acquired throughout the program in a culminating assignment (project-based learning). The Capstone course provided the Programs’ Faculty and Director the ability to assess whether students achieved the Program Learning Outcomes utilizing a Capstone rubric. The Capstone rubrics not only provided the Director and Faculty of the program with an assessment of the PLOs' attainment, but provided information about what were the specific courses that contribute to the low level of student success (achievement of low PLOs' scores in certain areas).
The Important Role of the Faculty and the Quality of Faculty Feedback
The faculty were a crucial component of the RLM. All faculty members were extensively trained with a learner-centered focus in mind. The standards of conduct for faculty were:
• "Responsiveness (24-hour turnaround on email and 72-hour turnaround for grading assignments).
• Flexibility with students on course and assignment deadlines.
• Constructive and supportive feedback and communications with students.
• Serving the institution through committee work, as well as course development and maintenance.
• Providing timely and constructive feedback (including text-based and audio) on students’ assignments for each module.
• Grading of all assignments and submitting final grades.
• Engaging students in meaningful learning through discussions with their peers and their core faculty" (Neumann & Neumann, 2010).
Key to the RLM is faculty development. Lewis and Ewing (2016) discussed “how an online university conducted faculty development through its Robust Learning Model (RLM) and its unique pedagogy” (p. 1) and how these efforts supported the continuous improvement of the Model.
Hamlin (2015) rated the Robust Learning Model as one of the more transformative learning environments in college education featuring an innovative constructivist outcomes-based pedagogy. "Faculty are afforded a wide range of capabilities by the RLM from providing content in problem and project-based assignments to interacting with students in on-going outcomes-linked discussions. Both faculty and student performance is on display at all times providing a record that can be used for quality assurance purposes. The faculty, the pedagogy and the information management system form a powerful instructional environment for teaching and learning. Faculty members are encouraged to provide on-going engagement and feedback to the students on both their assignments and bi-weekly discussions. The faculty members provide the content, but it must be fit to a standard pedagogy that includes discussions, a midterm case study and an end-of-term signature assignment all tied to student learning outcomes that link to program learning outcomes" (Hamlin, 2015, p. 131-132). In addition, Hamlin (2017) made a compelling case for the advantage of the RLM as the path for attaining online educational outcomes. Neumann et al. (2017), found that the Robust Learning Model is the dominant predictor in understanding alumni assessment of their online degree programs.
INTEGRATING THE SPIRAL CURRICULM (SC) WITH THE ROBUST LEARNING MODEL
The first-generation RLM's educational effectiveness results for online master degree students were quite positive for working adults pursuing online master degree programs. Overall retention rates were 86%, degree completion rates were 76%, and the mean time-to-degree was 1.82 years.
The institution commitment to continuous improvement, reviewing assessment results and related data analytics led the University to examine ways to improve the first-generation RLM. After analyzing the results of the various program reviews, it became clear that the best way to improve the quality of student learning is to transform all degree programs by revising the curriculum using the spiral approach.
Harden (1999) building on the work of Bruner (1960) defined the following for steps as the main characteristics of the Spiral Curriculum:
1. Topics were revisited throughout the curriculum with increased complexity 2. There were increasing levels of difficulty and/or depth throughout the curriculum 3. New learning was related to previous learning
4. The learner’s competence increased throughout the curriculum until the overall PLOs are achieved.
Both Hardin (1999) and Bruner (1960) concluded that the concept of a spiral curriculum merits careful consideration. The iterative revisiting of subjects throughout the courses was particularly relevant in integrated and problem-based learning and in outcome-based education. Indeed the University of Dundee applied the spiral model in their medical school.
"Spiral integration in its most ideal form might then represent a combination of both horizontal and vertical integration, uniting integration across time and across disciplines" (p. 315)
.
In late 2012, the academic council of the University and various school-based committees began to revise the RLM curricula for all degree programs using the spiral approach. Well-defined and integrated
curricula
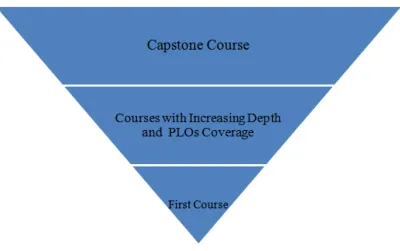
were developed for undergraduate degree programs (at the major level) and for graduate degree programs. Six out of the seven online master degree programs that the University offers did not include clinical and practicum elements. In those degree programs, students who took full load could have graduated from those programs in two years or if they opted for an accelerated option they could have completed those programs in one year. For the purpose of this study, it includes six online master degree programs without clinical components for students who started those programs under the revised model format.The first course in each degree program was designed as the main point of introduction to the subject-matter. One criterion was to introduce the students, at the minimum, to 50% of the PLOs of the degree program. A degree map was designed for each program where subsequent courses were sequentially built and the PLOs are then further developed, practiced, mastered, and finally integrated. Specialty courses were the last part of the curriculum map and are organized into concentrations. In the final course (The Capstone), students were required to demonstrate the full mastery and integration of course PLOs. The result was a revised RLM with Spiral Curriculum, or in short, RLM-SC.
Figure 1. The Spiral Curriculum in the Context of the Robust Learning Model
Although all courses in the degree programs were important, the first and last courses played a critical role. The first course laid the framework and foundations of the degree program and key concepts. In the last course, students had to demonstrate their understanding, comprehension, application, and integration of all the competencies and learning outcomes required for successful completion of the degree program.
the end result was a fully interlinked curriculum with cause-and-effect relationship from the first course through the final Capstone as well as various educational outcomes. This logic sequence was first proposed by Hamper (1999) who argued that the SC can bring order and predictability to increasingly complex degree program. Hamper (1999) did not empirically test this proposition.
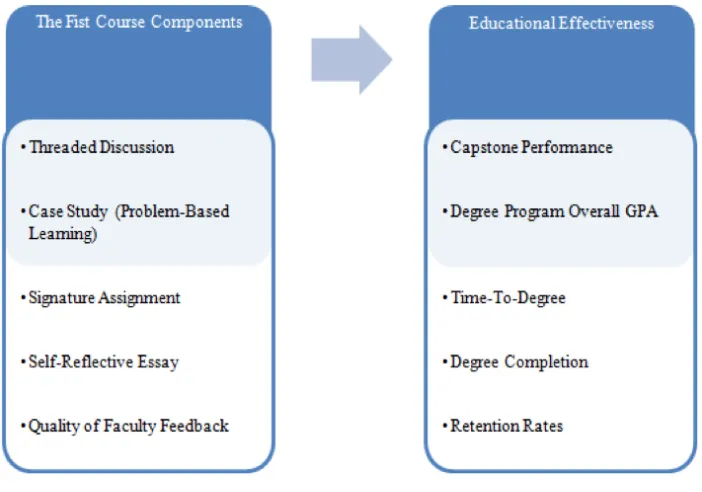
The components of the first course in RLM-SC (Threaded Discussion, Case Assignment, Signature Assignment, Self- Reflective Essay, and the Quality of Faculty Feedback) are then the independent variables that can predict an array of educational effectiveness outcomes (Retention Rates, Mastery of Competencies in the Capstone Course, Degree Completion, Time-To-Degree, and Overall GPA).
Figure 2.RLM-SC: Cause and Effect Relationships between the First Course Components and Educational Effectiveness. The
higher the connectivity and predictability, the more effective the combined approach in respresenting a cohesive and well integrated learning model.
In sum, this study compared retention rates, degree completion rates, and time-to-degree, capstone integrative course performance, and overall GPA between the initial RLM and the new RLM-SC for online master degree students. In addition, this study assessed the relative importance of the first course (which serves as the basis for the overall program) in predicting the various outcomes of the program (retention rates, capstone performance, overall GPA, time-to-degree, and degree completion rates). Overall, this study presented an empirical test of the interconnectivity of the spiral curriculum and its predictive power of educational effectiveness indicators.
METHOD
Subjects
Measures
The variables for the first (and crucial) course in the degree program were measured as follows:
1. Threaded Discussion Performance (TDP) was assessed by the average grade that instructor assigned to each of the student's required 16 different postings throughout the course (Twice per week). The grades (A-F) assessed the extent to which the student demonstrated (a) the complete understanding, comprehension, and application of the key concepts; quality constructive feedback to other postings; (b) used citations to support opinions, interpretations, and facts; and (c) expressed new ideas in an articulated and concise form. The letter grades are then transformed to the regular (0 to 4) scale. 2. Case Study Performance (CSP) was assessed by a rubric comprised of six areas. The first area was
completeness where the case analysis needed to be complete in all aspects and reflected all requirements. The second area was an understanding of the topics and issues covered in the case. The third area was analysis, evaluation and recommendations where the rubric examined the extent to which the case analysis: (a) represented an insightful and thorough analysis of all issues identified in the case; (b) made powerful connections among the various concepts; and (c) supported opinions with strong arguments and evidence while presenting a critical and objective interpretations. The fourth area was the extent to which research is incorporated into the case analysis. The fifth area was the accuracy and clarity of the case analysis. The last area was the completeness of the presentation, citations and bibliography. The CSP was assigned an A to F grades with their numerical interpretation.
3. The Signature Assignment Performance (SAP) was assessed by direct evidence that all the Student Learning Outcomes for course (including skills and competencies) were fully demonstrated at all levels (knowledge, comprehension, application, critical thinking, communication and integration). The SAP was assigned an F to A grade with the corresponding numerical interpretation.
4. Self Reflective Essay (SRE) was performed at the end of each course. The students wrote self-reflective essays responding to 5 questions which included:
A. Descriptions of how the student felt he/she improved their knowledge, skills, abilities, and self through this course.
B. Evaluation of the work the student did during the session and explanations of ways he/she could have performed better.
C. Topics that the student did not understand or applied suggestions you have about how to improve the course materials on those topics.
D. Student's measure the future effects of what he/she learned in this course.
E. A student statement of whether or not he/she achieved the course outcomes (Student Learning Outcomes).
The SRE performance was assessed by the extent to which a student completely responded to all five items and also employed the self-reflection to increase his/her ability to self-regulate the mastery of learning outcomes and competencies of the course (a dominant dimension of self-reflection). If the assessment is "Yes" on each of the 5 items, then the student scored 1 on SRE performance, otherwise the score was 0.
5. The Quality of Faculty Feedback (QFF) was a main differentiating factor in the Robust Learning Model. All university faculty were trained on effective feedback and their performance was regularly assessed by the Director of Quality Assurance. In the revised RLM-SC, the role of the faculty was as crucial as before. QFP performance was measured by the four major factors:
A. Timeliness of the feedback on all required course assignments meaning whether the feedback on threaded discussions were received within 24 hours, and the feedback on the case study and signature assignment were received within 72 hours.
B. The constructiveness of the feedback needed for effective student positive reinforcements. C. The substantiveness and clarity of the feedback.
D. The extent to which the feedback guided students in how to strengthen their learning efficacy.
The Educational Effectiveness variables are measured as follows:
1. Retention Rates was the percentage of master degree students returning the following 12 months after their initial enrollment.
2. Degree Completion Rates (or Graduation Rates) was the percentage of students who completed their degree requirements within 36 months after their initial enrollment.
3. Capstone Course Performance (CCP) was the student performance in their Capstone Integrative at the end of their master degree program (see description above). Students in this course should have demonstrated understanding, applying, and integrating all the degree PLOs. A rubric was developed to assess the depth to rigor to which students demonstrate the attainment of the degree PLOs acquired through core, advanced, and concentration courses. CCP was graded from F to A with its 0-4 numerical interpretation.
4. The GPA measure was the cumulative grade point average on a 0 to 4 range based on the A through F grade assessment.
5. Time-to-Degree was measured as the time between student's initial enrollment and degree completion.
Analysis
The comparison between educational effectiveness variables between the RLM and RLM-SC was be performed by t-test for independent samples.
The models where either retention rates or graduation rates were the dependent variables in the RLM-SC were assessed by the logistic regression analysis where the first course predictors served as the independent variable and retention and graduation were measured by binary dummy variables.
The models where Capstone Course Performance, GPA, or Time-to-Degree were the educational effectiveness indicators were assessed by a multiple regression analysis where the first course predictors served as the independent variable. In addition to beta coefficients, and R2 values, the contribution of each predictor to the explained variation was assessed by using the "fair-share" method (see Neumann & Neumann, 1989b). In each regression model, the fair- share partitioning of the explained variation (R2 ) "is equal to the sum of multiplication of each independent variable's weight with the correlation between the same independent variable and the dependent variable. Thus, unique contribution of each independent variable to the explained variation is simply the multiplication of the beta weight with the corresponding correlation coefficient. This method is applicable only if the signs of the beta weight and correlation coefficient are the same" (Neumann & Neumann, 1989, p. 231).
RESULTS
Table 1 presents the comparison between the Initial Robust Learning Model and the Revised RLM with Spiral Curriculum. The differences between the two models clearly indicated the superiority of the RLM with Spiral Curriculum. Retention rates grew from 86% to 92% while graduation rates within three years increase from 76% to 88%. Both Capstone Performance and Cumulative GPA also significantly improved. Finally, the Time-to-Degree was reduced from 1.84 years to 1.48 years.
Table 1. Educational Effectiveness Variables; A comparison between the Initial RLM and RLM-SC *
Educational Effectiveness Indicators RLM Initial RLM with Spiral Curriculum
Retention Rates 86% 92%
Graduation Rates 76% 88%
Capstone Performance 3.53 3.72
Cumulative GPA 3.56 3.79
Time-to-Degree 1.84 1.48
Table 2 presents the logistic regression where one-year retention is the dependent variable and the first course indicators in the RLM-SC are the independent variables. The WALD coefficients were used to determine whether any independent variable's effect on retention is significant. Overall, the most potent predictors of retention were the first course's performance on case assignment and the quality and depth of the self-reflective essay. The performance on the signature assignment and the quality of instructor's feedback also had significant effects on retention (p < 0.01) but their WALD coefficients were smaller than the first two predictors. Interestingly, the performance on the first course's threaded discussion was found to have a statistically non-significant effect on retention. The Nagelkerke R2 for the whole model was 0.56 and the percent of correct classification is 95% using the model. In other words, the first course's independent variables predicted in 95% of the cases whether or not the students successfully completed their studies following the 12 months after their initial enrollment.
Table 2. Logistic Regression of RLM-SC - Dependent Variable: Retention
Independent
First Core Course Predictors (RLM-SC) B WALD Coefficient Exp(B)
Threaded Discussion 1.12 2.05 3.05
Case Study 1.11 13.64** 3.03
Course Signature Assignment 0.81 8.52** 2.24
Self-Reflective Essay 2.42 14.12** 11.30
Quality of Instructor's Feedback 2.29 7.11** 9.85
Nagelkerke R2 0.56
Percent of Correct Classifications 95%
* p < .05 ** p < 0.0
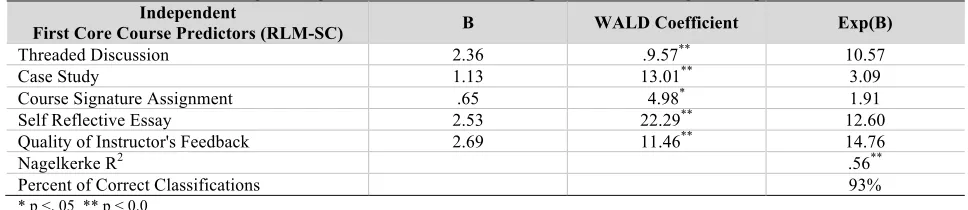
Degree completion was significantly affected by all the first course's independent variables as illustrated in Table 3. The dominant predictor with the maximal WALD coefficient was the first course's self-reflective essay. Case study performance, quality of the instructor's feedback and Threaded Discussion assessment all played significant roles in explaining degree completion (p < 0.01). The Course Signature Assignment 's effect on degree completion was the least potent although statistically significant (p < 0.05). The Nagelkerke R2 for the whole model was again 0.56 while the model's percent of correct classification is 93%. In other words, the first course's independent variables predicted 93% of the cases to determine whether or not the students would successfully complete their degree program.
Table 3. Logistic Regression of the RLM-SC - Dependent Variable: Degree Completion
Independent
First Core Course Predictors (RLM-SC) B WALD Coefficient Exp(B)
Threaded Discussion 2.36 .9.57** 10.57
Case Study 1.13 13.01** 3.09
Course Signature Assignment .65 4.98* 1.91
Self Reflective Essay 2.53 22.29** 12.60
Quality of Instructor's Feedback 2.69 11.46** 14.76
Nagelkerke R2 .56**
Percent of Correct Classifications 93%
* p <. 05 ** p < 0.0
Table 4. Multiple Regression - Dependent Variable: Degree Program Capstone Performance
Independent
First Core Course Predictors (RLM-SC) b Beta
Partitioning of the Explained Variation
Threaded Discussion .51 .26** .096
Case Study .48 .36** .151
Course Signature Assignment .63 .32** .128
Self Reflective Essay .55 .45** .171
Quality of Instructor's Feedback 1.20 .48** .197
R2 .74**
* p < .05 ** p < 0.0
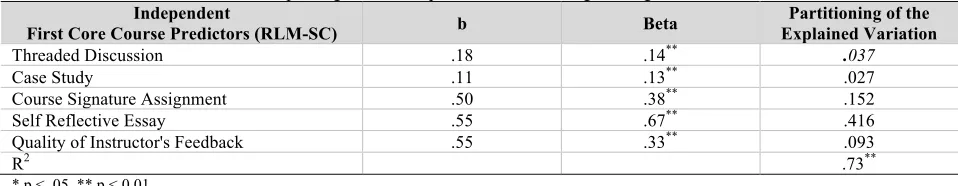
Table 5 presents the overall GPA in the degree program. The overall predictability of the first course's variable was quite strong (R2 = 0.73; p < 0.01). The first course's self-reflective essay was the most dominant predictor while the fist course's signature assignment and the quality of instructor's feedback also played very important roles in predicting overall GPA. Interestingly, although statistically significant, the first course's threaded discussion and case study performance played minor roles in predicting the overall GPA. The dominance of the first course's self-reflective essay in predicting GPA manifested itself through the partitioning of the explained variation; 42% out of 73% could be directly attributed to this predictor.
Table 5. Multiple Regression - Dependent Variable: Degree Program Overall GPA
Independent
First Core Course Predictors (RLM-SC) b Beta Explained Variation Partitioning of the
Threaded Discussion .18 .14** .037
Case Study .11 .13** .027
Course Signature Assignment .50 .38** .152
Self Reflective Essay .55 .67** .416
Quality of Instructor's Feedback .55 .33** .093
R2 .73**
* p < .05 ** p < 0.01
Table 6 presents the regression model where time-to-degree was the predictor variables and the first course indicators served as the independent variables. The R-Square of the model was 0.62 indicating a high level of predictability attributed to the first course's indicators. The dominant predictor of time-to-degree is the first course's quality of faculty feedback. Its beta weight was very strong (0.57; p < 0.001) while it contributed about 30% out of the 62% explained variation. The first course's self-reflective essay and signature assignment were also strong predictors although the former was a stronger predictor than the latter. The other predictors had statistically significant effects on time-to-degree although the role in predicting it was far less potent.
Table 6. Multiple Regression ---Dependent Variable: Time-to-Degree
Independent
First Core Course Predictors (RLM-SC)
b Beta Partitioning of the
Explained Variation
Threaded Discussion -.22 -.08* .021
Case Study -.35 -.19** .066
Course Signature Assignment -.90 -.34** .092
Self Reflective Essay -.65 -.39** .144
Quality of Instructor's Feedback -1.94 -.57** .296
R2 .62**
* p < .05 ** p < 0.01
CONCLUSION
degree programs were significantly improved by this deliberate learning model adaptation. That is, retention and graduation rates were enhanced, and degree program capstone course performance and overall GPA were increased. Finally, time-to-degree was significantly reduced.
The importance of the first course in the adapted learning model cannot be overlooked since the curriculum was built, expanded, deepened, and integrated based on the first course's foundations while the overall curriculum connectivity and educational effectiveness indicators were directly and substantially influenced by it and its components.
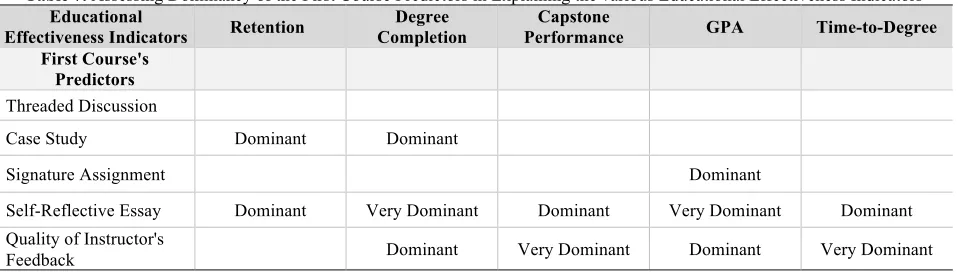
Table 7 provides a comparative analysis of the importance of the first course's predictors in predicting and explaining the various degree programs’ educational effectiveness indicators. Two predictors stood out as the most influential across the several first course's indicators. The first predictor was the self-reflective essay performance (SRE). The SRE performance was assessed by the extent to which a student completely responded to all five items and also employed the self-reflection to increase his/her ability to self-regulate the mastery of learning outcomes and competencies of the course (a dominant dimension of self-reflection).
The second potent predictor of educational effectiveness was the quality of faculty feedback which brings us back to the core of the Robust Learning Model. The quality of faculty feedback was a main factor in the Robust Learning Model differentiating it from many other learning models. All university faculty were trained on effective feedback and their performance is regularly assessed by the Director of Quality Assurance. Quality instructor feedback is needed to pass the following tests: timeliness, constructiveness, substantiveness, and of the push of students toward strengthening their learning efficacy.
Table 7. Assessing Dominancy of the First Course Predictors in Explaining the various Educational Effectiveness Indicators
Educational
Effectiveness Indicators Retention
Degree Completion
Capstone
Performance GPA Time-to-Degree
First Course's Predictors
Threaded Discussion
Case Study Dominant Dominant
Signature Assignment Dominant
Self-Reflective Essay Dominant Very Dominant Dominant Very Dominant Dominant
Quality of Instructor's
Feedback Dominant Very Dominant Dominant Very Dominant
Interestingly, both the aforementioned predictors are the cornerstones of the RLM that focuses on the “learning-to-learn” ability (Neumann & Neumann, 2016). Learning-to-learn is the ability to persist in learning through student awareness of his/her learning needs, effective search for information, efficient time management, and the proactive use of support to overcome challenges. Students with high learning-to-learn ability will find greater success than students without this ability. The individual’s learning-to-learn abilities were addressed in the RLM and RLM-SC in three stages. The first stage involved improving the learner's search behavior by providing learning cues or other supporting mechanism designed to improve pre-identified areas where the learner may experience difficulty. Second, the learner was provided with a variety of learning activities with timely, constructive, and supportive faculty feedback aimed at developing the meta-cognitive self-evaluating skills. Finally, the learner employed the self-reflection to increase his/her ability to self-regulate the mastery of learning outcomes and competencies in each course and throughout the program. Organizing the RLM through the spiral curriculum principles further enhanced the cornerstones of the original RLM and interactively caused improvements in educational effectiveness of online master degree programs.
for improving online degree program's educational effectiveness received some unequivocal input from this study. To generalize beyond the RLM, different learning models should also experiment with the spiral curriculum approach.
Finally, this study only tested the spiral based RLM for master degree programs only. As undergraduate students approach their eligibility to complete their degree program under the adapted RLM, future research will examine if the same results hold across degree levels.
AUTHOR BIOGRAPHIES
Yoram Neumann (Contact Author), Ph.D. (Cornell University), is the Chief Executive Officer and University Professor of Business Administration at Touro University Worldwide. He assumed this position in 2012. Previously he was the Founder, President, and CEO of Touro University International (TUI). TUI was later sold and is currently Trident University International. Prior to founding TUI, Dr. Neumann served as the Executive Vice President and Vice President for Academic Affairs and Dean of the College of Business and Public Administration at California State University, Dominguez Hills. Professor Yoram Neumann also served as Research Professor and the Director of the Graduate Program in Technology Strategy and Policy at Boston University and Dean of the Faculty of Humanities and Social Sciences at Ben-Gurion University. ([email protected])
Edith Neumann, Ph.D. (Boston University) is the Provost and Chief Academic Officer and University Professor of Health Sciences at Touro University Worldwide. She assumed this position in 2012. Dr. Edith Neumann was the Vice President for Academic Affairs and is the founding Dean of the Colleges of Education and Health Sciences at Touro University International (currently Trident University International). Dr. Neumann served as Dean of the School of Health and Director of the Center for Policy Research and Evaluation at California State University, and on the faculty of Boston University and Ben-Gurion University. ([email protected])
Shelia Lewis, Ph.D. (Touro University International) is the Associate Provost, Director of the School of Business Administration, and Professor of Business Administration at Touro University Worldwide. She assumed this position in 2013. Previously, Dr. Lewis served as the Associate Provost and Professor of Business Administration at United States University. Prior to joining United States University, Dr. Lewis served as the Director of Institutional Research at Touro University International. ([email protected])
REFERENCES
Anderson, T. & Dron, J. (2011). Connectivism: Design and delivery of social networked learning. Three generations of distance
education pedagogy. The International Review of Research in Open and Distance Learning, 12(3).
Brauer, D. G., & Ferguson, K. J. (2015). The integrated curriculum in medical education: AMEE Guide No. 96. Medical teacher,
37(4), 312-322.
Bruner J. S. (1960). The process of education. Cambridge, MA: Harvard University Press
Gupta, V. K., Joseph, B., Alcantar, N., Toomey, R. & Sunol, A. (2008, November). A Spiral Curriculum for Chemical
Engineering. In Proceedings of the Annual Meeting of the AIChE.
Hamlin, M. (2015). Technology in transformative learning environments. In Transformative Curriculum Design in Health
Sciences Education (pp. 126-140). IGI Global.
Hamlin, M. D. (2017). The Application of the Learning Sciences to the Design of Business Education Cases. In Case Studies as a
Teaching Tool in Management Education (pp. 141-168). IGI Global.
Harden, R. M. (1999). What is a spiral curriculum? Medical teacher, 21(2), 141-143.
Jorge, N., Dopper, S. & van Valkenburg, W. (2015). Defining a Pedagogical Model: The TU Delft Online Learning Experience. Paper presented at the 2015 EDEN Annual Conference – Expanding Learning Scenarios, Barcelona, Spain.
Lewis, S. & Ewing, C. (Winter 2016) Assuring student learning outcomes achievement through faculty development: An online
university example. Online Journal of Distance Learning Administration, 19(4).
Maynes, N. & Hatt, B. E. (2013). Online learning: Growing into our capacity for flexible learning. Journal of Transformative
Entrepreneurship, 1(2), 83-92.
Moore, S. (2014). Ethics and design: Rethinking professional ethics as part of the design domain, In B. Hokanson & A. Gibbons (eds.), Design in educational technology, educational communications and technology: Issues and Innovations. Switzerland: Springer International Publishing.
experience approach. Journal of Experimental Education, 57(2), 129-140.
Neumann, Y., & Finaly-Neumann, E. (1989b). An organizational behavior model of students' evaluation of instruction. Higher
Education, 18(2), 227-238.
Neumann, Y. & Neumann, E.F. (1993). Quality of learning experience and students’ college outcomes. International Journal of
Educational Management, 7(1), 4-10
Neumann, Y. & Neumann, E.F. (1995). Quality learning teams: Improving student retention, performance, and satisfaction. In A.M. Hoffman and D.J. Julius (Eds.), Total quality management: Implications for higher education (pp. 246-266). Maryville, MO: Prescott Publishing Company.
Neumann, Y. & Neumann, E. (2010). The Robust Learning Model (RLM): A Comprehensive approach to a new online
university. Journal of College Teaching & Learning, 7(1), 27-36.
Neumann, Y. & Neumann, E. (May 3, 2016). Lessons about online learning. InsideHigher Ed. Retrieved from
https://www.insidehighered.com/views/2016/05/03/what-weve-learned-after-several-decades-online-learning-essay Neumann, Y., Neumann, E., & Lewis, S. (2017). The assessment of online degree programs: Lessons from recent alumni.
Contemporary Issues in Education Research (CIER), 10(1), 67-76.
Neumann, Y., Neumann, E.F., & Reichel, A. (1990). Determinants and consequences of students’ burnout in universities. The