Using Mathematical Programming
For Marketing Plan Optimization
Tom Bramorski, University of Wisconsin-Whitewater, USA
ABSTRACT
While a growing number of companies are embracing analytical metrics to measure the performance of their critical business processes, many neglect to apply the same mathematical rigor to their marketing efforts. This paper examines how to apply a disciplined quantitative approach to resource allocation within the context of marketing. This project will examine a company that manufactures and sells electric power generation components. This firm’s executive management believes that developing nations in Asia have a particularly strong need for power generation equipment as they build and expand new infrastructure at a rapid pace. Management objective is to construct a marketing plan that will maximize both total revenue as well as revenue from a targeted geographic region, while working within the budgetary and other constraints. Operations Research offers sophisticated tools for translating complex business situations into mathematical expressions. These expressions may then be evaluated to identify one or more optimal solutions. Multivariate Testing is used to quantify all the relevant variables for the mathematical model. This statistical tool allows the researcher to simultaneously test the effect of various input factors on the response variable, and also test for any interactions between factors. These interactions are often significant in predicting the response outcome. Using indexed utility values produces a blended model that can simultaneously satisfy both objectives. This blended model results in a marketing plan that will increase total revenue by more than five million dollars, a 57% gain. At the same time, the plan will generate an 18% increase in targeted revenue, positioning the company for future growth. The project shows that companies can, and should, insist on the same degree of financial accountability from their marketing investments that they would expect from any other capital or operational expenditures.
Keywords: Marketing Investment; Business Intelligence; Marketing Strategy
INTRODUCTION
n an effort to boost productivity and competitiveness mainstream businesses have embraced analytics, often referred to as "business intelligence" (Williams and Williams, 2007, pg. 97). Yet many organizations have not applied the same scientific approach to their marketing plans. This research shows how businesses that utilize quantitative analytical techniques in developing their marketing strategies achieve a competitive advantage over those that simply rely on anecdotal evidence and speculation. The heuristic methods of decision-making in marketing applications are often counterintuitive and yield sub-optimal results. This project is an extensive case study of how a business can use techniques from the field of Operations Research to optimize a marketing plan, and measure its performance against predetermined strategic goals.
The marketing strategies and tactics vary significantly between companies that sell directly to consumers and those who market their products to other companies, to institutions, or the government. In this research we apply quantitative marketing decision techniques in a business-to-business setting. This project will examine a Midwestern company that manufactures and sells electric power generation components. The firm’s executive management believes that developing nations in Asia have a particularly strong need for power generation equipment as they build and expand new infrastructure at a rapid pace. It is anticipated that in less than 20 years rich industrial countries will be overshadowed by developing countries in their produced share of the world’s output (Pearce and Robinson, 2009). The majority of sales currently come from North America but the company believes that global
diversification will help mitigate the risk of regional economic shifts and position the company for future growth. With this in mind, one of the goals for the firm’s marketing plan is to maximize sales in this targeted geographic region while maintaining strong total revenue performance.
Marketing departments in organizations are continually challenged with allocating limited financial resources in order to maximize revenue. Surprisingly, many companies fail to measure the efficacy of these investments, and fewer still use quantitative criteria for deciding how to allocate their marketing budgets. This firm’s Director of Marketing is concerned with promoting five different generator products, each with its own unique features and applications. She has identified five specific vertical markets that have strong historical demand for generator products as well as a positive outlook for continued growth. Within each market, the firm must choose from among five different channels. Each of the five markets has a variety of targeted publications, trade shows, and other industry-related media channels that provide opportunities to advertise the firm’s products.
While this project addresses solely the allocation of marketing budgets, the same approach can be used more broadly for other budgeting and resource allocation problems. Traditionally, many organizations already utilize sophisticated techniques for other capital and operational budgeting decisions, and the marketing department is one of the last to specifically measure the financial performance of its investments. While most large organizations use metrics to measure and analyze business performance, few have applied the same quantitative approach to their marketing efforts. In this paper we also explore methods for calculating saturation points and using them as additional constraints in the linear model. The solution will be compared against the currently used heuristic approach for total revenue and targeted revenue generation.
RESEARCH GOALS AND OBJECTIVES
The firm’s previous marketing plans were based purely on anecdotal evidence and speculation. Although they produced adequately successful results, executive management wants to determine if a more scientific approach will yield higher levels of total revenue as well as targeted revenue growth. Executive management has determined that its primary objective should be to maximize the total revenue generated by the marketing plan. At the same time, however, management has a secondary goal it wants to take into consideration: achieve targeted revenue from Asia, which was selected as a strategic growth region. We note that a marketing plan setup solely for revenue maximization would be sub-optimal in satisfying the geographical objective. Conversely, a marketing plan optimized for the targeted region would not yield maximum total revenue. The marketing team has been asked to simultaneously address both of these objectives.
In preparing a marketing plan for the coming year, the Director of Marketing must decide where to allocate limited financial resources and which marketing opportunities to pursue. Each marketing option has a specific utility value related to both of the strategic goals, and a cost to execute that option. Executive management has set a total budget limitation, and there are a finite number of possible options from which to choose. Ultimately, the question facing the Director of Marketing is to generate the best possible combination of both strategic goals, while working within the overall budget constraint.
The problem is formulated and solved hierarchically. In Phase I, we utilize multivariate testing (MVT), which offers the ability to test combinations of factors instead of the traditional one-factor-at-a-time method of experimenting. The traditional solution approaches typically ignore the interactions between factors, which are often vital to the response. This procedure is relatively new to the field of marketing, but has already yielded significant results. MVT allows a business to understand, and even predict, the response to any possible combination of products, markets and channels employed in the campaign. This insight alone is very valuable and becomes even more powerful when used together with tools from phases two and three.
values are indexed in order to make relative comparisons among a diverse group of values (Ling, Marchal and Wathen, 2005).
In the third phase of the problem with only one single coefficient of utility for each possible marketing option, we solve the problem using Combinatorial Optimization. The solution itself is achieved by modeling the problem as an integer linear programming problem to allocate the budget for maximum desirability within the given constraints. The optimum solution will then be examined for its total expected revenue as well as its expected revenue from the targeted region.
THE LITERATURE REVIEW
In 1980, Porter published his now classic work on the subject of competitive strategy, becoming one of the first visionaries to provide a comprehensive analytical basis for managers to utilize. He describes the competitive rivalry that inevitably occurs as each firm seeks to maximize its own returns at the expense of others. “In most industries, competitive moves by one firm have noticeable effects on its competitors and thus may incite retaliation or efforts to counter the move, that is, firms are mutually dependent” (Porter, 1980). This behavior is especially common of oligopolistic competition where markets that are dominated by only a few large players. In addition to the competitive forces of familiar rivals, business leaders must also be on constant alert for what Christensen refers to as “disruptive technologies.” Christensen further extended the body of research by attempting to explain why “firms that could be esteemed as aggressive, innovative, customer-sensitive organizations” could rapidly fail by missing critical new developments in their industries. While Porter and Christensen have provided a qualitative understanding of competitive strategy, a more quantitative approach has developed the foundations of Game Theory, which studies the behavior of individuals and organizations by relating real situations from life and business to simple, mathematical games (McGuigan, Moyer, and Harris, 2005.) This approach allows researchers to simulate and evaluate the various alternative strategies available to each player. We are interested in is the payoff (or utility) function of a player. The independent variable in the model is the player’s strategy. We look for the strategy that maximizes the payoff function (Dutta, 1999.)
Many organizations are beginning to employ advanced quantitative analytics to build predictive models that drive their strategy development and operational decisions. A growing number of companies have recognized the power of leveraging data-driven insights through the use of business intelligence” (Davenport and Harris, 2007.) When implemented successfully, these tools can benefit both the supplier and the customer, allowing the firm to adjust business processes to provide high levels of service to the most profitable customers to ensure retention, thereby increasing profitability (Williams and Williams, 2007.) Business executives are increasingly utilizing statistics because they believe that it can improve decision-making within their organization. A robust decision is the best possible choice, one found by eliminating all the uncertainty possible within available resources, and then choosing with known and acceptable levels of satisfaction and risk (Ullman, 2006.) The role of business intelligence has expanded to include providing actionable insights, reducing risk in marketplace actions, and improving return on investment (Cooper and Schindler, 2006.)
While quantitative analysis provides powerful insights for improving all manner of operational processes, the firm’s marketing decisions are of primary interest in this research. Just as in other functional areas of the company, marketing managers are discovering the significant benefits that can be realized by using a more scientific approach to decision making (Bradley, 2007.) By measuring and analyzing data, marketing leaders are able to understand which systems, projects, staff, and processes are performing well and which need improvement. Just as the dashboard of a car provides critical information about the performance of the vehicle, marketing “dashboards” can provide real-time metrics on where the marketing investments are paying off and where they are not (LaPointe, 2005.)
and hard financial returns for the company remains one of the greatest challenges for most marketing departments, and demonstrating how to achieve it is precisely the purpose of this project (Lenskold, 2003.) Optimization techniques are used to solve for the highest possible return in terms of media mix, segment emphasis, and channel management (LaPointe, 2005.) The mathematical optimization tools and techniques are especially useful for helping understand and deal with business complexity and uncertainty. Just as new products typically undergo rigorous testing prior to their release, “…no business executive should dream of making a strategic decision with major impact on the corporation until that decision has been modeled and validated using operations research technology” (Crowder, 2006.)
This research combines methods from several different mathematical disciplines and applies them in the context of marketing. Multivariate Testing will be used to determine exact parameter values for each of the possible marketing options. Next, the two coefficients will be indexed by their relative correlation to the objective functions, and then blended into a single utility value. With all relevant data now in place, the final step will be to employ combinatorial optimization in order to find the best possible allocation of the marketing budget, subject to the predefined constraints. The result will be a more scientific approach to the marketing plan, yielding a higher return on the marketing investment and, ultimately, give the company a stronger competitive position in the marketplace (Young and Aitken, 2007.)
MODEL FORMULATION
In preparing a marketing plan for the coming year, the Director of Marketing must decide where to allocate limited financial resources and which marketing opportunities to pursue. Each marketing option (J) has a utility value (UJ) and a cost (KJ) associated with it. Executive management has set a total budget limitation (B), and there
are (N) possible options from which to choose. The objective is to construct a marketing plan within the budget constraint that will generate the highest possible utility. Let QJ be the quantity of each option (J) chosen for the final
marketing plan. The can be formulated as an integer linear programming problem:
Max Z=UJQJ (Total utility) (1)
s.t.
JQJ ≤ B (Budget) (2)
QJ ≥ 0 (Nonnegativity) (3)
QJ I (Integrality) (4)
For the purpose of this study each generator product has its own unique size (in kilowatts), features and applications shown in Table 1.
Table 1. Generator Products by Size and 2010 List Price
Label Name Size List Price
P1 Raven Generator 750kW $25,540
P2 Falcon Generator 1000kW $38,325
P3 Hawk Generator 1250kW $49,940
P4 Osprey Generator 1500kW $65,515
P5 Eagle Generator 1750kW $77,075
The five vertical markets that have strong historical demand for these generator products, as well as a positive outlook for continued growth grouped by their NAICS (North American Industry Classification System) code are shown in Table 2.
Table 2. Vertical Market Sectors by 2010 NAICS Codes
Label Sector Name NAICS Code
M1 Highway Construction 2373
M2 Marine Shipping 4831
M3 Airport Infrastructure 4881
M4 Data Processing Centers 5182
Each of the five sectors has a variety of targeted publications, tradeshows, and other industry-related activities that provide opportunities to advertise the firm’s products. In Table 3 we list five advertising channels effectiveness of which will be evaluated. The cost per unit for each channel (including production costs) is consistent within each of the markets.
Table 3. Advertising Channels with 2010 Cost per Unit
Label Channel Cost Per Unit
C1 Print Ad in Trade Magazine $11,000
C2 Tradeshow Exhibit $19,000
C3 Direct Mailing $9,500
C4 Targeted Email Blast $7,250
C5 Search Engine Campaign $8,000
The indexed utility value is designed to facilitate the simultaneous satisfaction of multiple criteria. In this case, executive management has determined that the primary objective is to maximize the total revenue of the marketing plan. Management also wants to maximize targeted revenue from a specific geographic region. These two goals are conflicting as a marketing plan optimized solely for total revenue maximization would be sub-optimal in satisfying the geographic objective. Conversely, a marketing plan optimized for the targeted region would probably not yield maximum total revenue. Taking the average coefficients of the two goals, the utility value provides a single quantitative value for the final linear programming problem.
Each marketing option (J) represents a specific combination of a featured product (P), a targeted vertical market (M), and an advertising channel (C). There are five products to feature, each promoted in five different vertical markets and offering five different marketing channels. In order to preserve a balanced mix of products and markets, executive management has set minimum requirements (TP, TM) that must be added to the model.
Linear programming models necessitate an assumption of proportionality, which requires that all variables produce constant returns to scale. In reality, however, marketing efforts frequently violate this assumption. Marketing response is often more accurately depicted as a curve (similar to the curves of supply and demand.) In an early stage, a marketing campaign will typically exhibit steady response in direct proportion to the quantity or volume of effort. Eventually, response will peak at a saturation point and then subside as the product or brand suffers from overexposure. Although this violates the assumption of proportionality, the returns up to the saturation point can be assumed to be (approximately) constant. In a modified model, the point of saturation (S) must be determined separately for each market (M) and for each channel within each market (V). Taking into account the additional requirements, the final model formulation becomes:
MAX Z=UJQJ (Total utility) (1)
s.t.
JQJ ≤ B (Budget) (2)
QP ≥ TP (Product Mix) (3)
QM ≥ TM (Market Mix) (4)
QM ≤ SM (Market Saturation) (5)
QC ≤ VC (Channel Saturation for each M) (6)
QJ ≥ 0 (Nonnegativity) (7)
QJ I (Integrality) (8)
where:
J = Marketing option
N = Number of possible options Q = Quantity of each option, J U = Utility value of each option, J K = Cost of each option, J B = Total budget limitation
M = Targeted vertical market for each option, J C = Advertising channel for each option, J
T = Minimum requirement for each market, M and product, P S = Total saturation point for each market, M
V = Saturation point for each channel, C (within each market, M)
DATA COLLECTION AND ANALYSIS
To derive the indexed utility value, the expected total revenue (R) and expected targeted revenue (G) must be determined for each option (J). Multivariate testing methods will be used to find the lead generation coefficients for each product (P), market (M), and channel (C). The total number of expected leads generated for each option (J) will be used to determine expected revenue (R), while only those leads originating from the specific geographic region will be counted toward the targeted revenue objective. The predicted number of leads generated (LR and LG)
is then multiplied by the historical conversion rate (VP) of the sales team. The result is the expected number of
products sold, which is multiplied by the list price (W) for the product to find to total expected revenue and targeted revenue for that option. Thus, for each option (J):
RJ = LRVPWP, and (9)
GJ = LGVPWP. (10)
The values RJ and GJ are divided by the cost (KJ) of executing the respective marketing option (J) to find an
efficiency rating (FR and FG) for that option relative to both goals. Next, these efficiencies are indexed (XR and XG)
by dividing each individual value by the average of all values in order to provide a level comparison. Finally, the indexed efficiency ratings are averaged to yield a utility value (U) for each option (J).
Generally, industrial companies do not track marketing performance data required for the analysis in such a project. We observe that doing so is not only financially beneficial but also vital to securing a long-term competitive advantage. Companies that do measure and analyze quantitative data on their marketing efforts typically keep such information confidential because detailed information regarding the performance of specific products, market segments and promotional channels constitute the very essence of an organization’s competitive marketing strategy. Since such data is typically confidential, much of the lead generation, product pricing and channel cost data used in this paper were obtained through Monte Carlo simulation performed in Microsoft Excel. The simulation procedure robustness was empirically verified by a company Marketing Data Analyst to ensure that the techniques used and conclusions drawn in this study are sound. The approach can be duplicated in most industrial marketing environment, and, to a broader extent, in any resource allocation problem.
Multiple factors potentially influence the response in applied marketing settings. In these circumstances it is appropriate to use multivariate testing analysis. The technique is particularly valuable because it not only tests the impact of each factor on the response variable, but also tests the presence of interactions between factors. The effect of these interactions is often missed if simple linear regression is used to evaluate multiple factors separately.
This project involves three discrete factors (product, market and channel) that potentially impact a response variable (leads generated). Multivariate testing will examine the effect each main factor has on lead generation and the significance of two-factor interactions. We expect that a product will have a consistent quantifiable impact on lead generation, independent of which market or channel is used (the product main effect.) If we find that certain products perform better in some markets than others we may conclude that there is a significant two-factor interaction (product and market.) The statistical analysis was performed using SAS statistical software, while the integer linear programming optimization was completed in Microsoft Excel using What’s Best.
Multivariate testing (MVT) was used to determine the precise impact of each factor on the response outcome. The MVT model is a full factorial standard least squares regression with the lead generation data including one row of data for every possible treatment combination, or 125 records1. There two response outcomes: total lead
1
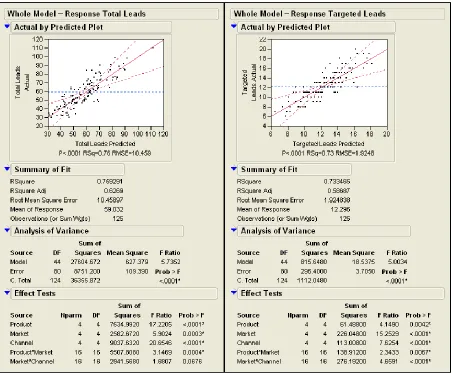
generation and targeted lead generation (leads originating from the targeted geographical region). The input factors were tested separately for their correlation to the two response outcomes. The three main effects were included in the model, as well as the two-factor interactions between market and the other two factors. The interaction between product and channel was tested but then removed from the model because it was found not to be significant. A lack of interaction between product and channel indicates that each channel performs equally well, independent of the product featured. Figure 1 shows sample test results for total leads and targeted leads.
Figure 1. The test results for total leads and targeted leads.
The ANOVA output shows that the p-value is less than 0.001 for both responses, so the model is highly significant. The coefficient of multiple determination, R2 = 0.76 for total leads and R2 = 0.73 for targeted leads. Both of these values confirm the general validity of the statistical models. Coefficients of the main factors and the two-factor interactions indicate the magnitude of impact each two-factor has on the response variable.
Equally important to the response outcomes are the interactions between factors. The results demonstrate that interactions between product and market and between channel and market are statistically significant. For example, the Raven Generator product clearly performs best in the Construction market for both total leads and targeted leads. The Eagle product, on the other hand, appeals strongly to Hospitals for both response outcomes. For total lead generation, Print Ads perform well when targeted to the Data Centers market, but poorly in the Airports market. To generate leads from Asia, the best choices are Print Ads for Hospitals, or Search Engine campaigns aimed at Airports. These insights have significant value for the Executive Management in their effort to improve resource use efficiency.
These findings have significant practical implications. Based on the model the lead generation response (L) can be predicted for any treatment combination of product, market and channel. The predicted value can then be compared against the actual historical value to evaluate model accuracy. The residual columns and the average percentage error show that the equation is reasonably accurate (relative error of 10 percent) in predicting both total lead generation and targeted lead generation.
Maximizing lead generation would produce sub-optimal results for both total revenue and targeted revenue because the analysis has ignored the cost to execute each option. In order to avoid sub-optimization, predicted values for total lead generation (LR) and targeted lead generation (LG) are first translated into expected revenues (R). Then, they are compared against their cost (K) in order to properly evaluate them for their financial efficiency (F). In order to derive the efficiency rating for each marketing option, the predicted number of total and targeted leads for each option is multiplied by a respective conversion rate (V), which varies by product and geographic location. The conversion rate is the average percentage of leads that the sales team can expect to convert into actual sales based on historical performance data. Based on historical comparisons each marketing option is associated with an expected number of product sales. When multiplied by the list price for the given product, the transformation produces the expected total revenue (R) and targeted revenue (G) for an option.
The expected revenue for each option is now divided into its cost to find the two efficiency ratings for each marketing option: the total revenue goal and the targeted revenue goal. These two values are aggregated by indexing and averaging. In the indexing process the ratings are divided by the average of all efficiencies for a given goal. The two-phase transformation reconciles the two goals and combines them into a single utility value using a weighted average approach with both weights equal to 0.5.
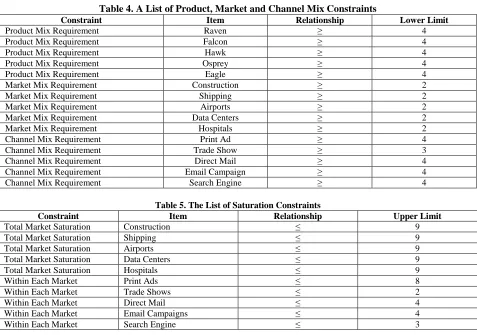
The marketing budget allocation problem can be modeled using integer programming. Management wants to ensure a relatively balanced mix of products, markets and channels subject to a budget constraint of $250,000. To guarantee that each of the five products receives some promotion, the marketing plan must include at least four options from each product. Management is also committed to maintaining a diversified cross-section of vertical market presence. Therefore, at least two options must be chosen from each of the five markets. Management wants the plan to include a variety of advertising channels, so each channel must be represented at least four times. The exception to this rule is Trade Shows, which were assigned a minimum value of three, because they are less frequent and more expensive. These constraints are shown in Table 4.
In the early stage, a marketing campaign will typically exhibit constant returns to scale. Eventually the response will peak at a saturation point and then subside as the product or brand suffers from overexposure. All saturation points are estimated using historical data and are included as constraints. A constraint must also be placed on the number of promotions within any given market sector. In determining the saturation points the marginal analysis reveals that the saturation point is not simply the quantity that produces the highest response. For example, in the channel saturation analysis for P2 the saturation point was determined to be two trade shows within the same
Table 4. A List of Product, Market and Channel Mix Constraints
Constraint Item Relationship Lower Limit
Product Mix Requirement Raven ≥ 4
Product Mix Requirement Falcon ≥ 4
Product Mix Requirement Hawk ≥ 4
Product Mix Requirement Osprey ≥ 4
Product Mix Requirement Eagle ≥ 4
Market Mix Requirement Construction ≥ 2
Market Mix Requirement Shipping ≥ 2
Market Mix Requirement Airports ≥ 2
Market Mix Requirement Data Centers ≥ 2
Market Mix Requirement Hospitals ≥ 2
Channel Mix Requirement Print Ad ≥ 4
Channel Mix Requirement Trade Show ≥ 3
Channel Mix Requirement Direct Mail ≥ 4
Channel Mix Requirement Email Campaign ≥ 4
Channel Mix Requirement Search Engine ≥ 4
Table 5. The List of Saturation Constraints
Constraint Item Relationship Upper Limit
Total Market Saturation Construction ≤ 9
Total Market Saturation Shipping ≤ 9
Total Market Saturation Airports ≤ 9
Total Market Saturation Data Centers ≤ 9
Total Market Saturation Hospitals ≤ 9
Within Each Market Print Ads ≤ 8
Within Each Market Trade Shows ≤ 2
Within Each Market Direct Mail ≤ 4
Within Each Market Email Campaigns ≤ 4
Within Each Market Search Engine ≤ 3
COMPUTATIONAL RESULTS
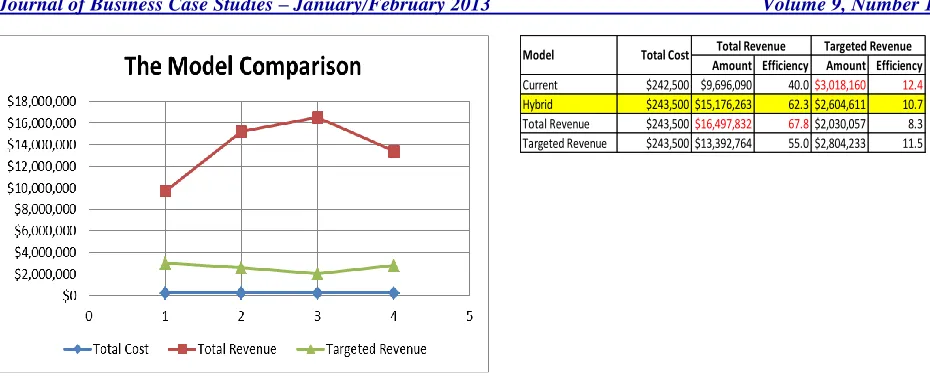
Using the formulation (1), we propose three marketing plans and compare them to the current heuristic marketing plan. The three plans are: (i) Optimization for total revenue, (ii) Optimization for targeted revenue from Asia, and (iii) The hybrid marketing plan. The total cost of the marketing plan remains constant across the four models. However, the total revenue model maximizes the expected total revenue from all markets while the current heuristic model performs best when targeted revenue from Asia needs to be maximized. The weighted hybrid model offers a compromise between total revenue and targeted revenue objectives. An efficiency rating demonstrates the effectiveness of resource use. It can be found by dividing the expected revenue by the total cost. The computational results are summarized in Figure 2.
Figure 2. The model performance comparison.
The option with both the highest utility and highest efficiency is P5M5C4 (Eagle, Hospitals, Email). The
hybrid model fully exploits this option subject to the channel saturation constraint for Email in the Hospital market. Print Ads and Trade Shows are less efficient means of promotion than other channels but they must be included in the final plan at minimum quantities to satisfy the channel mix constraint. The management may wish to reconsider this requirement and allocate that money to better options.
Table 6. Output from the hybrid marketing plan
Product Market Channel Quantity Channel Cost Total Cost
Raven Construction Print Ad 4 $11,000 $44,000
Falcon Shipping Direct Mail 4 $9,500 $38,000
Hawk Airports Trade Show 1 $19,000 $19,000
Hawk Airports Email 2 $7,250 $14,500
Hawk Airports Search Engine 3 $8,000 $24,000
Osprey Data Centers Trade Show 2 $19,000 $38,000
Osprey Data Centers Email 4 $7,250 $29,000
Osprey Data Centers Search Engine 1 $8,000 $8,000
Eagle Hospitals Email 4 $7,250 $29,000
Total: $243,500
CONCLUSION
Traditionally, the field of marketing has been viewed as intangible and subjective. This study has shown how the allocation of the overall marketing budget can be optimized using statistical and mathematical programming techniques. Companies should insist on the same degree of financial accountability from their marketing investments that they would expect from any other capital or operational expenditures. The result is a more scientific approach to the marketing plan yielding a higher return on the marketing investment and, ultimately, a stronger competitive position in the marketplace.
Based on the results of this study the following recommendations to management can be made:
1. Support strategic marketing decisions with data. In many companies, historical marketing performance values are often difficult to find and/or incomplete. Dashboards can provide management with real-time information about critical business processes, revealing potential problems and opportunities.
2. Employ multivariate testing methods. Statistical techniques such as MVT can help determine factors that have the greatest impact on business results. Despite the widespread availability of statistical software packages many business decisions are made without the benefit of these tools. Marketing plans developed heuristically are expensive gambles with company resources.
Amount Efficiency Amount Efficiency Current $242,500 $9,696,090 40.0$3,018,160 12.4
3. Incorporate strategic goals into the marketing plan. Rather than maximizing total revenue, this project identified a methodology that will position the company for long-term growth while still demanding strong top-line performance. As these priorities evolve they must be communicated to the marketing organization on a continual basis to ensure resource alignment.
4. Utilize optimization techniques. Companies that utilize these quantitative analytical techniques will be able to achieve a competitive advantage over those that simply rely on anecdotal evidence and speculation. These heuristic methods of decision-making yield suboptimal results, because the most advantageous solutions are often counterintuitive, particularly in marketing applications.
AUTHOR INFORMATION
Tom Bramorski, Ph.D. received his M.S. degree in Mechanical Engineering from the Technical University of Warsaw. He received his M.B.A and Ph.D. degrees from The University of Iowa. As a Professor of Management at the University of Wisconsin-Whitewater, he has published four books, numerous papers in academic journals and has presented papers at national and international conferences. Dr. Bramorski serves on the editorial boards of several academic journals in the areas of operations, supply chain, operations strategy and quality management. He frequently offers guest lectures at Universities and training institutions in Europe. He is a former Fulbright Senior Lecturer in Oman and in Poland. E-mail: [email protected]
REFERENCES
1. Bradley, N. (2007). Marketing Research: Tools and Techniques. Oxford, UK: Oxford University Press. 2. Christensen, C.M. (1997). The Inventor's Dilemma: When New Technologies Cause Great Firms to Fail.
Boston, MA: Harvard Business Press.
3. Cooper, D.R., and Schindler, P.S. (2006). Business Research Methods (9th ed.). New York, NY: McGraw-Hill/Irwin.
4. Crowder, H.P. (2006). The Science of Better Decisions: Making Operations Research a Core Business Competency.
5. Davenport, T.H. and Harris, J.G. (2007). Competing on Analytics: The New Science of Winning. Boston, MA: Harvard Business Press.
6. Dutta, P.K. (1999). Strategies and Games: Theory and Practice. Cambridge, MA: MIT Press. 7. LaPointe, P. (2005). Marketing by the Dashboard Light: How to Get More Insight, Foresight, and
Accountability from Your Marketing Investments. Princeton, NJ: MarketingNPV.
8. Lenskold, J.D. (2003). Marketing ROI: The Path to Campaign, Customer, and Corporate Profitability. New York, NY: McGraw-Hill Professional. Lind, D.A.,
9. Marchal, W.G., and Wathen, S.A. (2005). Statistical Techniques in Business and Economics (12th ed.). New York, NY: McGraw-Hill/Irwin.
10. McGuigan, J.R., Moyer, R.C., and Harris, F.H.B. (2005). ManagerialEconomics: Applications, Strategy, and Tactics (10th ed.). Mason, OH: Thomson South-Western.
11. Pearce, J.A. and Robinson, R.B. Jr. (2009). Strategic Management: Formulation, Implementation, and Control (11th ed.). New York, NY: McGraw-Hill/Irwin.
12. Ullman, D.G. (2006). Making Robust Decisions. Oxford, UK: Trafford Publishing.
13. Williams, S., and Williams, N. (2007). The Profit Impact of Business Intelligence. San Francisco, CA: Morgan Kaufmann.