Categorizing Top Fortune Company Mission
And Vision Statements Via Text Mining
Faleh Alshameri, University of Mary Washington, USA G. Robert Greene, University of Mary Washington, USA Mukesh Srivastava, University of Mary Washington, USA
ABSTRACT
Purpose - The paper seeks to categorize mission and vision statements into clusters and demonstrate how these clusters can be profiled in the context of Globalization, Innovation and Strategy Centric features for assessment of strategic alignment, positioning and direction. Based on text mining methodology, mission and vision statements of the top 772 Fortune companies were analyzed to understand: 1) How mission and vision statements can be meaningfully categorized into clusters, 2) How attributes of each cluster can be meaningfully evaluated in the context of the degree to which Globalization, Innovation and Strategy Centric Mission and Vision statements are discovered. Clustering Toolkit (CLUTO) software was used for text mining the data collected from two websites. A recursive bisection approach has been followed to reach the desired number of six clusters, which were further analyzed through Wordle software for visual representation. The study clustered the companies in the dataset into groups in which globalization, innovation, and strategy issues were dominant. The epistemological contribution of this research includes how text mining can be used to meaningfully categorize a large dataset consisting of mission and vision statements of 772 Fortune corporations, how knowledge contained in a large dataset can be managed through the use of text mining in analyzing cluster attributes, and how these clusters can be profiled in the context of Globalization, Innovation and Strategy Centric features for assessment of strategic alignment, positioning, and direction.
Keywords: CLUTO, Categorizing Mission and Vision Statements, Wordle, Text Mining, Globalization, Innovation, Strategy
1. INTRODUCTION
ata mining methods provide a variety of computational techniques that are becoming an increasingly important and viable approach to efficiently and effectively extract new information from massive datasets (Rasmuseen and Karypis, 2004). Due to advances in the information technology, the tremendous growth in the volume of the text documents in different fields ranging from business to the sciences available on the Internet, in digital libraries, in news sources, and on companywide intranets, has greatly encouraged researchers in developing new challenging methods to work with the complexity and the growing size of this text data in order to extract its data features. These methods can help users effectively navigate, summarize, and organize the data in an appropriate way to help them to find information for which they are looking.
It is a widely accepted leadership and management premise that the better an organization’s objectives, strategies, internal operating strengths, key competitive advantages, and procedures are aligned emerging opportunities extant in the external environment in which it operates, as well as with the organization’s vision, mission, and purpose for being, the more likely the organization is to successfully achieve its key goals, objectives, and outcomes, and thus validate its reason for existence (Gamble and Thompson, 2011). This research attempts to categorize the mission and vision statements of organizations for the assessment of strategic alignment, positioning and direction.
2. REVIEW OF SELECTED LITERATURE
Trusov, et. al. (2006) point out that a good model should account for product attributes, historical sales volume, and store specific issues to control for marketing mix, and one of the challenges is that many variables which describe product, store, or promotion conditions frequently involve hundreds or thousands of levels for a single attribute. They discuss the use of data mining technologies combining techniques from statistical market response modeling, and combinatorial optimization to produce small but significant rules set that predicts sales volume.
Davi, et. al. (2005) have demonstrated the usefulness of data mining technology in the key steps related to analysis of unstructured text data. Those steps were outlined by the authors to include: (a) data preparation, including importing and cleaning, (b) performing association analysis, and (c) presentation of the outcomes of the analysis, including providing illustrative quotes and graphic presentation of results that facilities better understanding of underlying key points in a dataset.
Those authors reviewed the features of two text mining software packages, specifically WordStat and SAS TextMiner, and evaluated the ability of each software to help researchers extract major themes from a dataset, the authors concluded that both software packages offered variety of features that helped researchers effectively identify associations and present research outcomes. They point out, however, that those software packages were only marginally successful (effective) in extracting themes from the underlying dataset.
Another example of the use of data mining is the study of Xu and Qiu (2008), based on collection and analysis of customer information using data mining technologies in effective customer relationship management (CRM) strategies. Applying data mining technologies to extract high value information is useful in management strategies and tactical business operations.
3. RESEARCH FRAMEWORK
Developing fast and high quality document clustering algorithms significantly helps achieve the goal of extracting relevant and useful information from massive data. These clustering algorithms provide navigation and browsing mechanisms by organizing large amounts of data into a small number of meaningful clusters, as well as by greatly improving retrieval performance either via cluster-driven dimensionality reduction, term-weighting, or query expansion. In fact, the clusters discovered can be used to explain characteristics of data distribution, while simultaneously showing the relationships among these datasets.
Determining the most important features of the text dataset improve analyzing and extracting methods and provide meaning to the dataset, while greatly benefiting users by increasing understanding of their work.
In this paper, the authors attempted to extract meaningful information from the dataset consisting of 772 text documents, while attempting to discover key relationships among data in these documents. To reach this goal, the authors analyzed the dataset in different ways by extracting key features from documents in the dataset that facilitate understanding the contents of the documents.
In this regard, the authors implemented two features, topics feature, and discriminating words feature. To implement these features, researchers used data mining tools, algorithms, and other software that are explained in the following sections.
The primary issues being investigated in this study addressed the following primary research questions: (1) How mission and vision statements can be meaningfully categorized into clusters, and (2) How attributes of each cluster can be meaningfully evaluated in the context of the degree to which Globalization, Innovation and Strategy Centric Mission and Vision statements are discovered within them.
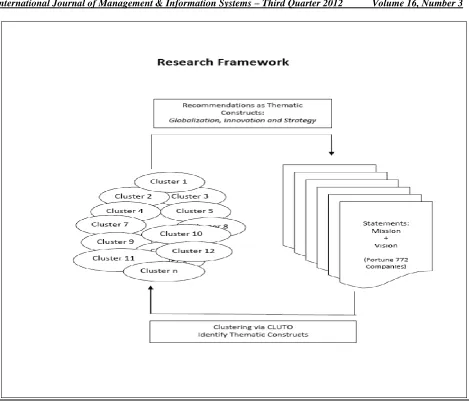
Figure 1: Information flow between mission/vision statements and creation of clusters for further analysis
Mission and vision statements copied into a word processing (text) document containing the formal mission and vision statements of the top 772 Fortune companies were fed into the CLUTO and WORDLE software tools, and analyzed in an attempt to discover the answers to the questions noted above. The software extracted and profiled the data, then generated information regarding various clusters of firms in which globalization, innovation, and strategy were emphasized within the dataset. This was accomplished based on both discriminate and descriptive words analysis processes provided within the software tools.
4. DATA ANALYSIS
The Sample
The dataset for the study consisted of formal vision and mission statements of 772 Fortune companies collected from two different websites identified below:
http://www.missionstatements.com/company_mission_statements.html, and http://www.company-statements-slogans.info/fortune-500-companies.htm
statements of the Fortune 500 companies listed in alphabetical order, and provides more extensive information related to each company. Clustering was achieved by applying two technologies: (1) CLUTO, and (2) WORDLE, both of which are described in the following sections.
Document Clustering
Given a dataset S of n documents, the idea here was to partition these documents into a pre-determined number of k subsets S1, S2, …, Sk such that the documents assigned to each subset are more homogeneous to each other than to the documents assigned to different subsets.
In order to partition the dataset (772 documents) into a useful and meaningful subsets, and simultaneously discover the most characteristics (features) of the data by describing and explaining the similarities between the documents on each subset (cluster), and how each differs from other subsets, the authors partitioned the documents in the dataset into different clusters, experimenting with several possible choices regarding the number of clusters, but chose to report on the choice of six key clusters. Therefore, for each cluster, intra-cluster similarity is maximized and the inter-cluster similarity is minimized. The authors applied a software application known as CLUTO to accomplish this objective (Karypis, 2003).
Clustering Toolkit (CLUTO)
CLUTO (CLUstering TOolkit) is a software package for clustering low and high dimensional datasets and for analyzing characteristics of the various clusters. It provides tools for analyzing clusters, thus it enables understanding relations between objects assigned to each cluster, while simultaneously identifying relations between different clusters. In fact, CLUTO attempts to identify all sets of features that occur within each cluster, which enables describing or discriminating each cluster. These sets of features can work as a key digital object to enable understanding the set of documents assigned to each cluster, and provide brief idea about the cluster's content. CLUTO also provides tools for visualizing clustering solutions in order to understand the relationship among the clusters, objects, and the identifying features.
The CLUTO algorithms were optimized for operating on very large datasets, both as measured by the number of objects as well as the number of dimensions. These algorithms quickly cluster datasets with several tens of thousands of objects and dimensions. CLUTO also maintains the sparsity of the datasets, and requires memory that is roughly linear regarding input size (Karypis, 2003).
Clustering Algorithms Methods
There are 18 different cluster methodologies supported by CLUTO to compute clustering solutions based on partitional, agglomerative, and graph partitional clustering algorithms, each of which has certain advantages and disadvantages. Several of these algorithms are suited for datasets with different characteristics, and can be used to perform different types of analysis. These algorithms operate either directly in the object's feature space, or in the object's similarity space.
Partitional Clustering
With the partitional clustering algorithms, clusters are created by partitioning the dataset into a pre-determined number of disjoint sets, each corresponding to a single cluster. This partitioning is achieved by treating the clustering process as an optimization procedure that attempts to create high quality clusters according to a particular objective function that reflects the underlying definition of the “goodness” of the clusters.
The default method used in CLUTO is a recursive bisection approach. With this method, the desired k-way clustering solution is computed by performing a sequence of k-1 repeated bisections on the data matrix. This method first clusters the data matrix into two groups (clusters), and then one of these groups is selected and bisected further, creating a total of three clusters. This process repeated until the desired number of clusters is reached (i.e., until k clusters are obtained). Each of these bisections is performed so that the resulting two-way clustering solution optimizes a particular criterion function. The bisection method ensures that the criterion function is locally optimized within each bisection, but in general is not globally optimized. Obtaining a k –way clustering solution in this approach maybe desirable because the resulting solution is hierarchical and thus it can be easily visualized. The key feature of this approach is the method used to select which cluster to bisect next. By default, the next cluster to be bisected is the one that will optimize the overall clustering criterion most. This method generally shows that in high-dimensional datasets, good clusters are often embedded in low-dimensional subspaces.
Another partitional method is the direct k-way clustering solution, which is computed by simultaneously finding all k clusters. The clustering solution with this approach is slower than the clustering solution based on the recursive bisections approach. In fact, the direct k-way method yields a better selection when the value of k small (less than 10-20), whereas the repeated bisections approach much better than direct k-way clustering as k increases.
5. KNOWLEDGE EXTRACTION AND PROFILING APPLYING CLUTO
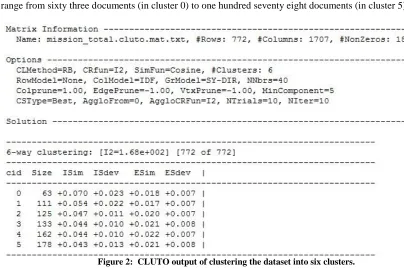
In the study, the same dataset was clustered by using CLUTO agglomerative clustering software for high dimensional datasets in the clustering process. The authors initially clustered the documents into five, six, seven, and eight clusters for comparison. Thereafter, the authors selected six clusters for further study; this selection (decision) was based on the intra-cluster similarity. Figure 2, below, reveals the CLUTO output of information clustering the dataset into six clusters.
The number of documents (cluster size) for each cluster differs from one cluster (topic) to another. Cluster sizes range from sixty three documents (in cluster 0) to one hundred seventy eight documents (in cluster 5).
Figure 2: CLUTO output of clustering the dataset into six clusters.
options that the software used to compute the clustering, and the number of desired clusters (#Clusters). The number of rows in the output is the number of documents in the dataset (772 documents).
The figure also reports the overall value of the criterion function for the computed clustering solution. Here it is reported as 1.68e+002, which is the value of the I2 criterion function of the resulting solution. In general, the overall cluster quality information displayed in the report depends on the criterion function used.
The report also indicates the number of objects that are able to cluster (772 of 772); this means all the documents on the dataset are clustered into some clusters. The last part on the figure shows some statistics reported regarding each cluster, such as cluster number (cid), number of objects (documents) that belong to each cluster (size), the average similarity between the objects of each cluster (internal similarities) (ISim), and the standard deviation of these average internal similarities (Isdev). The report also shows the average similarity of the objects of each cluster and the rest of the objects (external similarities) (Esim), and finally, the report displays the standard deviation of the external similarities (Esdev). One of the most important points discovered from the statistical report in Figure 2 is that clusters are ordered in increasing (Isim-Esim) order, which means clusters that are tight and far away from the rest of the objects have smaller cid values.
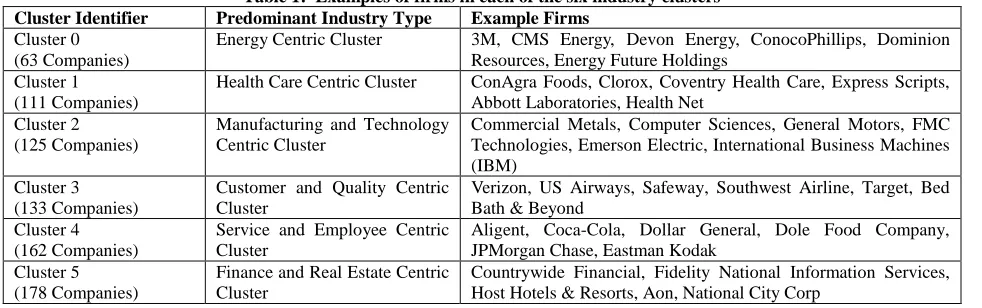
Table 1, below, provides examples of firms in each of the six industry clusters as determined by the CLUTO data mining software.
Table 1: Examples of firms in each of the six industry clusters Cluster Identifier Predominant Industry Type Example Firms
Cluster 0 (63 Companies)
Energy Centric Cluster 3M, CMS Energy, Devon Energy, ConocoPhillips, Dominion Resources, Energy Future Holdings
Cluster 1 (111 Companies)
Health Care Centric Cluster ConAgra Foods, Clorox, Coventry Health Care, Express Scripts, Abbott Laboratories, Health Net
Cluster 2 (125 Companies)
Manufacturing and Technology Centric Cluster
Commercial Metals, Computer Sciences, General Motors, FMC Technologies, Emerson Electric, International Business Machines (IBM)
Cluster 3 (133 Companies)
Customer and Quality Centric Cluster
Verizon, US Airways, Safeway, Southwest Airline, Target, Bed Bath & Beyond
Cluster 4 (162 Companies)
Service and Employee Centric Cluster
Aligent, Coca-Cola, Dollar General, Dole Food Company, JPMorgan Chase, Eastman Kodak
Cluster 5 (178 Companies)
Finance and Real Estate Centric Cluster
Countrywide Financial, Fidelity National Information Services, Host Hotels & Resorts, Aon, National City Corp
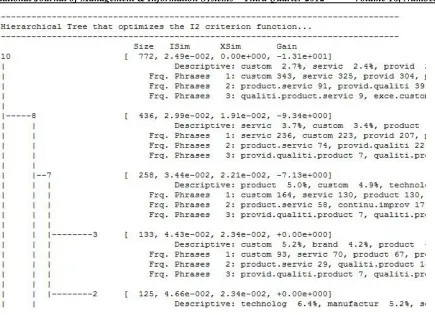
Another feature of this software is that the clusters can be represented as a leaf node on tree. Figure 3 describes a hierarchical agglomerative tree for the discovered clusters. To construct this tree, the algorithm repeatedly merged a particular pair of clusters, and the pair of clusters to be merged is selected so that the resulting clustering solution at that point optimizes the specified clustering criterion function. The tree produced in this manner is represented in rotated fashion, where the root of the tree is in the first column, and the tree grows from left to right. The leaves of the tree (as noted above) represent the discovered clusters, which numbered from 0 to Ncluster-1. The internal nodes are numbered from Ncluster to 2*Nclusters-2, with the root being the highest numbered node (the hierarchical agglomerative tree of the dataset in this study shows the root = 10, since the Ncluster = 6 clusters).
Figure 3: Hierarchical agglomerative tree for discovered clusters Discriminating Words Feature
The second feature is the discriminating words feature. This feature is connected with the industry types feature noted above. In fact, discriminating words are used as a key in industry types feature, since each industry type contains certain documents, these documents are clustered together in one cluster by looking at the discriminating words that distinguish the documents in a certain topic (cluster) rather than another topic (cluster), and at the same time used to determine in general the topic title (cluster name), i.e., the discriminating words are surrogate for topic title. There are approximately sixty discriminating words for all the six clusters (ten discriminating words for each cluster or topic).
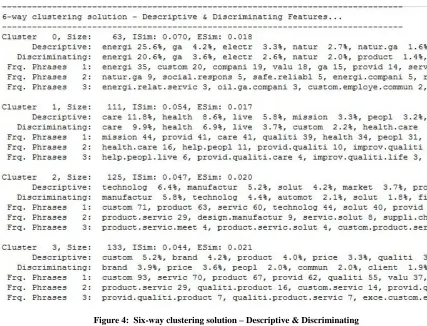
CLUTO can help with analyzing each cluster, and determine the set of features that best describe and discriminate each of the clusters. Figure 4, below, shows the output produced by CLUTO for the discriminating words. The figure displays the set of descriptive and discriminating features for each cluster into three different lines. The first line contains some basic statistics for each cluster such as cid, Size, Isim, and Esim. The second line contains ten of the most descriptive words features (ten features), whereas the third line displays the most discriminating words features (ten features).
The features in these lists are sorted in decreasing descriptive or discriminating order. Regarding descriptive features, the percentage number to the right of each feature means the percentage within cluster similarity that this particular feature can explain. For example, in cluster 0, the feature “energy” explains 25.6% of the average similarity between the objects of the 0th cluster. Likewise, in the descriptive features, a percentage also follows each discriminating feature indicating the percentage of the dissimilarity between the cluster and the rest of the objects that this feature can explain.
There are three types of discriminating features displayed in the figure: one phrase, two phrases, and three phrases. These appropriate discriminating features are attached to each document in the dataset as metadata to assist the search for features extracted in the database and retrieving the documents.
Figure 4: Six-way clustering solution – Descriptive & Discriminating
6. KNOWLEDGE EXTRACTION AND PROFILING APPLYING WORDLE
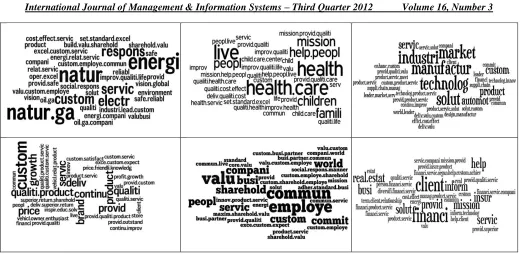
Wordle is a “software toy” for that generates “word clouds” from text data that the researcher provides. The clouds give greater prominence to words that appear more frequently in the source text dataset. The researcher can tweak clouds with different fonts, layouts, and color schemes.
Figure 5: Predominant industry types associated with each of the industry clusters
Industry focus of the six identified clusters
Referring to the information in Figure 5, above, in Cluster 0, it becomes apparent that this cluster has energy centric industry issues as its primary emphasis. Information in Cluster 1 suggests that this cluster is focused primarily on health care centric industry. Likewise, the information displayed regarding Cluster 2 indicates that the focus is on manufacturing and technology centric industry issues, whereas Cluster 3 is focused on customer and quality centric industry issues, Cluster 4 is focused on service and employee centric industry issues, and Cluster 5 is focused on issues in the finance and real estate centric industries.
7. DISCUSSION
Globalization, Innovation, and Strategy Centric Profiles
The following discussion addresses areas of emphasis discovered within the mission and vision statements in the six industry clusters identified in the study. Managerial implications will be discussed in the following sections. Figure 6 provides a representation of clusters as per globalization, innovation, and strategy.
Globalization Centric Profile
With regard to the clusters in which globalization is a stated emphasis in the mission and/or vision statements of the companies, clearly Cluster 0 (Energy centric) and Cluster 1 (Health Care centric) are industries in which globalization receives emphasis.
Figure 6: Cluster Profiles as per Globalization, Innovation, and Strategy
Innovation Centric Profile
Likewise, examination of the information depicted in the various industry clusters indicates that innovation has frequent emphasis in every cluster. Innovation appears in Cluster 0 (Energy centric), Cluster 1 (Health Care centric), Cluster 2 (Manufacturing and Technology centric), Cluster 3 (Customer and Quality centric), Cluster 4 (Service and Employee centric), and Cluster 5 (Finance and Real Estate centric).
It appears, therefore, that innovation is an important area of emphasis and focus in each of the six industry clusters, and receives strongest emphasis in manufacturing & technology, and quality & customer centric industry groups.
Strategy Centric Profile
Regarding industries in which strategy is a primary focus, strategy is an area emphasis in each of the six clusters with the exception of Cluster 1 (Health Care centric) where it does not appear as an emphasis. Strategy appears in Cluster 0 (Energy centric), Cluster 2 (Manufacturing and Technology centric), Cluster 3 (Customer and Quality centric), Cluster 4 (Service and Employee centric), and Cluster 5 (Finance and Real Estate centric).
Thus, strategy is an area of emphasis in five of the six industry clusters, and receives strongest emphasis in industries that are energy centric.
Managerial Implications of the results
The information discovered in this study using data mining tools suggests that organizational innovation is the most important emphasis in the industry clusters. Further, organizational strategy issues received the second most frequent emphasis among those companies.
On the other hand, an emphasis on globalization was discovered in the mission and vision statements of only two of the six industry clusters (Energy, and Health Care centric industry groups).
It seems likely that leaders perceive health care centric industries as being globally focused. The facts that emphasis on globalization is essential focus in organizations as nations are becoming more interconnected and interdependent.
8. CONCLUSION
This study demonstrates how text mining can be meaningfully used to profile the mission and vision statements of 772 companies in the context of globalization, innovation and strategy. It also provides the description of industry types associated with each cluster. This analysis can provide an analytical view regarding existing trends in each industry types for those industries that are interested in revising their mission and vision statements or want to focus on the future direction.
AUTHOR INFORMATION
Dr. Faleh Alshameri is an Assistant Professor of Computer Information Systems in the Department of Accounting and Management Information Systems, College of Business at the University of Mary Washington, Fredericksburg, Virginia. He received his Doctor of Philosophy in Information Technology from the Volgenau School of Engineering, George Mason University. His research interests include Text Mining, Image Mining, Database, and Systems Analysis and Design. He has presented and published number of research papers in refereed journals and international conferences. E-mail: [email protected]. Corresponding author.
Dr. G. Robert Greene is an Associate Professor of Leadership and Management in the Department of Management and Marketing at the University of Mary Washington, Fredericksburg, Virginia. He received his Doctor of Philosophy in Management from Georgia State University. His publications have appeared in American Demographics, The Journal of Business Ethics, Proceedings of the Organizational Behavior Teaching Conference, and Proceedings of the Annual Meetings of the Association for Business Simulation and Experiential Leaning. His research interests include strategic management, leadership, and entrepreneurship. E-mail: [email protected]
Dr. Mukesh Srivastava is Associate Professor of Management Information Systems at the University of Mary Washington. He received his Doctor of Business Administration in MIS from the University of Surrey, School of Management in 2008. He has presented and published a number of research papers in refereed journals and international conferences. His research interests are - eLearning, technology adoption, boundary theory, cultural intelligence, global outsourcing, and business process evolution and innovation. He is founder of the Association of Global Management Studies and Editor-in-Chief of two journals - International Journal of Global Management Studies (IJGMS) and International Journal of Global Management Studies (IJGMSP). He also serves on the editorial board of Contemporary Management Research (CMR). He organizes International Conference of the AGMS annually. Dr. Srivastava is author of a book entitled, eLearning via the Internet: An Empirical Study (Pearson Learning Solutions). During 2011 he received Fulbright Specialist Award at the Tunis Business School, Tunis University. E-mail: [email protected]
REFERENCES
1. Davi, A., Haughton, D., Nasr, N., Shah, G., Skaletsky, M., and Spack, R. (2005) “A Review of Two Text Mining Packages: SAS TextMining and WordStat,” American Statistician. Vol 59 (1), PP: 89-103. 2. Gamble J. E., and Thompson, A. A. (2011) “Essentials of Strategic Management: The Quest for
Competitive Advantage,” McGraw-Hill Erwin, New York, NY.
3. Karypis, G. (2003) “CLUTO: A Clustering Toolkit,” University of Minnesota, Department of Computer Science, Minneapolis, MN. Release 2.1.1.
5. Trusov, M., Bodapati, A. V., and Cooper, L. G. (2006) “Retailer Promotion Planning: Improving Forecast Accuracy and Interpretability,” Journal of Interactive Marketing. Vol 20 (3/4), PP: 71-81.
6. Xu, S., and Qui, M. (2008) “A Privacy Preserved Data Mining Framework for Customer Relationship Management,” Journal of Relationship Marketing. Vol 7 (3), PP: 309-322.