Teaching With Computers: A Cautionary
Finding In An Accounting Class
Stuart H. Jones,(E-mail: [email protected]), University of Calgary, Canada Michael Wright, (E-mail: [email protected]), University of Calgary, Canada
Abstract
The study assesses the effects of a hypertext learning aid and GPA on performance in advanced financial accounting. Results indicate that the type of learning aid and GPA significantly affect performance. High GPA students performed better than did the low GPA students. In the study, two versions of the hypertext learning aid were utilized by two different groups of students and compared to a third group of students who had no hypertext learning aid. Use of the full version of the hypertext learning aid results in the lowest performance while students using a modified version of the hypertext learning aid attained the highest exam performance. These differences were found to be statistically significant. Differences in performance between those students who used the modified version and those who used no program were not significant, however. The difference between the full version of the learning aid and the modified version of the learning aid is the degree of information provided to the students; the full version providing the most detailed information. The results suggest that instructors must be careful in the design and use of learning aids.
The authors would like to acknowledge the helpful comments of Philip Beaulieu, Ronald A. Davidson and Gisela Engels on an earlier version of this paper.
Introduction
change is n
X
ducators have long been concerned with the importance of instructing students in the art of “learning how to learn”. It is likely that how successful students are in acquiring this skill depends on the kinds of instructional material that are made available. That substantial eeded in how instructors teach was noted by Jensen a decade ago, when he claimed that accounting education suffers from a “lack of effective, well-developed instructional materials” (Jensen, 1990, p. 172). In the last 20 years, thanks to the rapid development of powerful desktop computers, there has been a significant change in the way students are taught. The learning environment, once typically little more than a blackboard-equipped classroom for instruction augmented by readings and homework assignments selected from the course textbook, has become “high-tech.” Today, many classrooms are equipped with a variety of electronic aids, including computer projection screens and terminals that allow Internet access, and instructors are making their course materials available electronically, thereby enabling students to download material at a moment’s notice. As well, the way homework is assigned has also changed. Many textbooks now assign problems that require the use of a computer involving a spreadsheet or similar program.Literature review and hypotheses
Hypertext learning aids
Improving student performance and increasing completion rates in university courses has been the subject of numerous studies. Different forms of student support have been examined including the use of Supplemental Instruction (SI). SI “does not require any particular teaching method, but instead emphasizes the use of cooperative learning in voluntary, out-of-class SI sessions” (Etter et al., 2000, p. 358). The study by Etter et al. of 132 introductory accounting courses from many different universities indicates that students attending SI have higher grades and lower attrition rates. Jones and Fields (2001) looked at the role of SI as a means of enhancing student performance in the introductory financial accounting course. Their findings indicate that, by employing collaborative learning techniques that emphasize learning strategies and critical thinking skills, significant improvement in total points are earned in the first accounting course. Their study further indicates that the level of SI participation is positively correlated with the total course points earned. The authors noted, however, that their study did not indicate whether SI was more effective than other kinds of academic assistance (such as regular tutorials); only that it indicated that SI students performed better than the control group of non-SI participants.
The findings by Bonham et al. (2003) in their study of students in introductory physics courses suggest that it is not the medium that is important but rather it is some form of extra work or homework in general coupled with feedback that is valuable. Students in one section used a Web-based system for submitting assignments and students in another section completed handwritten assignments. In both cases students received feedback, albeit in one case via the computer and in the other case by a graduate assistant. Students’ GPA and general background knowledge of physics were significant factors in student performance while the method of completing homework assignments was not significant.
Other computer-based modes of instruction include hypertext and hypermedia programs. Unz and Hesse (1999, p. 279) define hypertext as “computer-based systems that consist of nodes and links. Each node contains some amount of text or other information, and the nodes are connected by directed links … people can move non-linearly by following the links” while in comparison “hypermedia is multimedia with links.” One of the most important characteristics of both of these types of programs is the ability of the learner to exert control by making decisions about the number and kinds of events that occur during instruction. Such learner control can be distinguished from adaptive control where it is the program that essentially controls the number and type of events. Unz and Hesse (p. 280) argue that “because of its structure, hypertext facilitates active, exploratory learning. …the system encourages inquiry and discovery and so enhances learning.” Yet we still do not have sufficient theoretical and empirical knowledge of learning with hypertext systems (Unz and Hesse, 1999).
The advantage of these programs is their interactivity. Lucas (1992) suggests that there are three possible levels of interactivity. The highest level is referred to as proactive interactivity. In this level, students, acting on their experiences with the software, develop postulates and rules. For this study, a proactively interactive program could allow students to create their own consolidation accounting problems and produce solutions. Importantly, students would be shown why the solution is the correct one, and, significantly, they would be allowed to change the input variables and immediately observe the results (and explanation for) the change.
This study reports the results of using two versions of a program that prepares consolidated financial statements; “consolidations” is typically part of the advanced financial accounting course found in undergraduate accounting programs. One version of the program can be thought of as being completely proactively interactive, while the other version offers a more restrictive proactive interactivity. The essential difference between the two lies in the amount of detail that is provided. In the complete version, students are not only shown the answer but are also provided with a detailed explanation of each line in the consolidated financial statements. This shows the students why the answer is the correct one. The restricted version, on the other hand, provides only the solution to the problem: students are thus unable to see why the answer is correct and thus must deduce the reasoning themselves. Whether or not the use of these programs has an effect on student learning is the purpose of this research. To measure this effect, we compare the final examination results of three treatments groups. One treatment group was required to use the full program throughout the semester; another had to use the modified version; and the third group used neither version of the software.
This study hypothesizes that use of the software will result in a difference in exam performance. Students using the completely interactive version of the program may have an advantage because they can see the correct solution and why it is the correct solution. However, because the explanation for the answer is conveniently provided, students may not learn and comprehend the material fully. Concerning the modified version of the program – the one that affords a more restricted level of proactive interactivity – this may actually offer no advantage over using no software, because all it affords is the solution. Students still have to provide their own detailed explanation as to why it is the correct solution. Hence it is unclear which treatment group will perform the best.
H1: Examination performance will not be affected by the group to which the student belongs.
GPA
Rollock (1992) controlled for grade-point average because GPA is a measure of “general – and specific – ability” (p. 811). Bonham et al.’s (2003) study of students in a science class demonstrates that grade-point average is a statistically-significant variable in explaining student performance. Consequently, grade-point average is included as a variable in the current study.
Stated in the null form, the hypothesis is:
H2: Examination performance will not be affected by a student’s grade-point average.
Research design
To ensure consistency in marking, an individual from public practice was retained to mark the final exams in all three semesters. This individual was provided with an answer key developed by the course instructor, who then reviewed the marking and resolved some minor differences that were found.
During the term, all students were required to complete two comprehensive assignments worth 25 percent of the course grade. For the first assignment, the students were required to form groups and, during the term, each group was required to prepare a problem of their own creation that met a high level of consolidation requirements, including a detailed solution to the problem. For the second assignment, the instructor provided a case that the students were required to solve individually. This case differed from the student-prepared assignment in that it focused on testing the students’ grasp of specific consolidation concepts.
Students who were required to use either version of the software program were given training at the start of the semester in order to make them familiar with its features. Sample problems were made available and those students who were assigned to the software (either version) were recommended to work out these problems using the software. Students not assigned to either version of the software were recommended to work the problems out manually. All students then completed the two required assignments with either the full version of the program; with the modified version of the program or without the program; depending on in which semester they were registered. For those students not using either program, these two assignments were done manually.
Hypertext consolidation software
The computer program used in the study was created by the author a number of years ago basically to allow him to prepare consolidated financial statements that were error free. At some point the idea of using it in a classroom setting was born and the program then underwent significant changes to give it a more pedagogical focus. The software uses Microsoft’s Excel® spreadsheet program, thereby assuring that almost anybody with a computer will be able to use it.
There are two pages into which the student enters data. The first page, the DATA page, is where some basic facts about the Parent Company and the Subsidiary Company are entered. Here, information such as the date of acquisition, the cost of the acquisition, the method chosen by the parent to account for its investment, and other details, such as intercompany transactions including the unrealized profit contained therein, and particulars involving the allocation of fair-value differences arising from the purchase transaction are all entered by the student.
The DATA page also acts as a learning aid: many of the items to be entered here have active hypertext links embedded in the cell into which the user inserts the information. For example, if a student is unsure to how to distinguish between a company that carries its investment under the “equity method” or the “cost method” or the “modified equity method”, a click on the appropriate cell will cause the program to jump to another page (HELP page) where a full explanation, including examples, is provided. To return to the same place on the DATA page, all that is necessary is a single click anywhere on the HELP page.
Once the page is correct and the student is satisfied with the figures, the recording phase is complete. The final page (the CONSOLIDATION page) is where the results of the consolidation are displayed, and this is accessible simply by clicking on the CONSOLIDATION tab. This page displays the consolidated balance sheet, the consolidated statement of earnings and the consolidated statement of retained earnings.
The above description of the software applies to both versions used in the study. For the modified version of the program version, this describes its complete functionality. In the full version of the program, however, a complete explanation of every line of the output – the elements of the consolidated financial statements portrayed on the CONSOLIDATION page – is available simply by clicking on the appropriate cell. The importance of this feature is that it is “live”. Unlike the static HELP page associated with the DATA page described above, the analysis provided for each line of the output is specific to that particular line for the particular problem being solved. For example, by clicking on the cell where the “consolidated cost-of-goods-sold” amount appears, the program jumps to another page showing how that figure was derived. As before, a single click anywhere on this page will return the user to the original line on the CONSOLIDATION page. Different problems being solved will produce different consolidated financial statements, of course, and the analysis for each line of the statements will change correspondingly.
Results
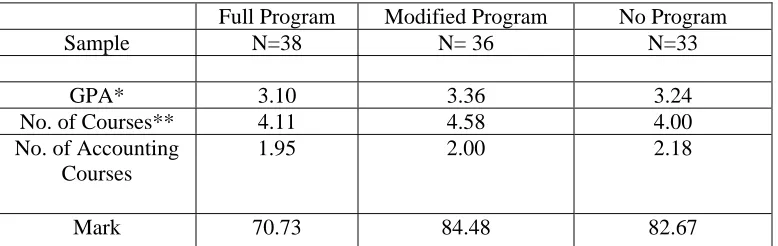
Table 1
Descriptive Statistics
Full Program Modified Program No Program
Sample N=38 N= 36 N=33
GPA* 3.10 3.36 3.24
No. of Courses** 4.11 4.58 4.00
No. of Accounting Courses
1.95 2.00 2.18
Mark 70.73 84.48 82.67
GPA = the cumulative grade point average in the semester prior to the advanced financial accounting course.
No. of Courses = the total number of courses taken concurrently with the advanced financial accounting course.
No. of Accounting Courses = the total number of accounting courses taken concurrently with the advanced financial accounting course.
MARK = the total mark received on the consolidation questions in the final exam in the advanced financial accounting course.
* GPA was significantly different (0.008) between students using the full version of the program and those using the modified version of the program.
Because students’ registration was self-selected, this arrangement resulted in a non-random sample. Thus it was necessary to compare the GPAs of the students in each of the three groups. The students using the full version of the program had a statistically lower GPA than did the students using the modified version of the program (p = 0.008). As illustrated in Table 1, the number of courses and the number of accounting courses taken concurrently with advanced financial accounting was also assessed to determine if the student course loads were comparable. Statistically, the only difference was between the students in the modified program group and the other two groups for the total number of courses being taken concurrently with the advanced financial accounting course. Students in the modified program group took an average of 4.58 courses, while students in the program group took an average of 4.11 courses and students not using either version of the software took an average of 4.00 courses. There was no difference in the number of accounting courses taken concurrently. Students using the modified version had both the highest GPA and the highest total course load which should offset each other as factors affecting performance on the exam. We do include GPA as a hypothesized variable with low GPA coded as zero and high GPA coded as one (based on the median GPA).
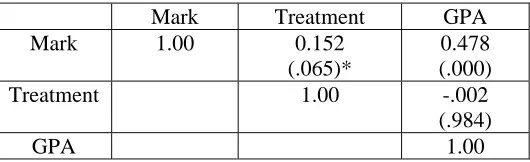
Table 2
Pearson correlation matrix
Mark Treatment GPA
Mark 1.00 0.152
(.065)*
0.478 (.000)
Treatment 1.00 -.002
(.984)
GPA 1.00
* Two-tailed significance levels in brackets
The Pearson correlations for the dependent variable MARK and the independent variables (TREATMENT and GPA) are provided in Table 2. There is no significant correlation between the two dependent variables.
Table 3
Analysis of Variation of Exam Performance
Dependent Variable: MARK
R-Square 0.973
Adjusted R-square 0.975
Sum of Squares DF Mean Square F Sig.
Model 675,129.6 6 112,521.6 644.8 0.000
Treatment 3115.6 2 1557.8 8.9 0.000
GPA 2090.3 1 2090.3 12.0 0.001
Treatment x GPA 372.8 2 186.4 1.1 0.347
Error 17,624.5 101 174.5
Total 692,754.1 107
MARK = the total mark received on the consolidation questions in the final exam in the advanced financial accounting course.
TREATMENT = the groups into which the students were placed. These were: those who used the full version of the program; those who used the modified version of the program; and those who used no program.
GPA = coded as zero if the cumulative grade point average in the semester prior to the advanced financial accounting course is less than or equal to the median of 3.24 and coded as one if the cumulative grade point average in the semester prior to the advanced financial accounting course is greater than the median of 3.24.
The hypotheses are analyzed with a full factorial analysis of variance (using SPSS Version 12.0) and the results are presented in Table 3. The results indicate that TREATMENT and GPA are significant. TREATMENT is significant at the level p = 0.000 and GPA is significant at the level p = 0.001. Therefore, we can reject the null of no effect for TREATMENT (H1) and for GPA (H2).
Scheffé’s Linear Contrasts was used to investigate the significance of the TREATMENT variable. Students using the modified program had the highest performance (mean = 84.48) but this was not statistically different from the performance of those not using either program (mean = 82.67, p = 0.841). However, students using the modified program and no program did significantly better than those using the full version of the program (mean = 70.73, p = 0.000 and p = 0.001 respectively). It appears that students who use the full version of the program (where the answer and how it is derived is made available) are at a disadvantage compared to students who either use the modified version of the program (where the answer but not how it is derived is made available), or use no program. The high GPA students (mean = 84.45) performed better than the low GPA students (mean = 73.73, p = 0.001). There was no interaction hypothesized between TREATMENT and GPA nor did the ANOVA analysis indicate the presence of an interaction term.
Conclusions
The hypotheses investigated the effects of TREATMENT, and GPA on examination performance. The results indicate that TREATMENT did affect performance but closer examination of TREATMENT suggests that use of the full version of the program results in the lowest performance. Students using the modified program attained the highest performance for MARK; however, there was no statistical difference between the modified program students and those using no program.
It is interesting to observe that students who were provided with the full version of the program earned the lowest marks on the examination, while those who had either the modified version or no version at all earned statistically higher marks. Given that the only difference between the two versions lay in the provision of why the answer is correct, it is reasonable to conclude that it is this facet that drives the observed result. Perhaps not requiring students to work out for themselves the proof of the answer leads students to develop an incomplete understanding of the processes underlying consolidation accounting. It then follows that students not using either version of the software – and thus being forced to work out for themselves the proof of the answer – would perform similarly to those students using the modified version of the software, but better than those students using the full version of the software.
the full program. This result is consistent with the observation by Ayersman and Michael (1998) that many students may require experience with multiple linkages before they can benefit fully from their use.
The second independent variable was GPA. This was a statistically significant factor in exam performance and is consistent with the findings of Rollock (1992) and Bonham et al. (2003). No interaction term was hypothesized and no overall one was found in the results.
References
• Amernic, J. H. and T. Beechy, (1984) "Accounting Students' Performance and Cognitive Complexity: Some Empirical Evidence", The Accounting Review, pp. 300 - 313.
• Ayersman, D. J., and R.W. Michael, (1998) “Relationships among Hypermedia-Based Mental Models and hypermedia Knowledge”, Journal of Research in Computing in Education, 30 (3), pp. 222 – 239.
• Bonham, S., D. Deardorff, and R. Beichner, (2003) “Comparison of Student Performance Using Web and Paper-Based Homework in College-Level Physics,” Journal of Research in Science Teaching, Vol. 40, No. 10, pp. 1050-1071.
• Etter, E., S. Burmeister, and R. Elder, (2000) “Improving student performance and retention via supplemental instruction,” Journal of Accounting Education, Vol. 18, pp. 355-368.
• Gay, G., D. Trumball and J. Mazur, (1991) “Designing and Testing Navigational Strategies and Guidance Tools for a Hypermedia Program”, Journal of Educational Computing Research, 7, pp. 189 – 202.
• Heller, R. S., (1990) “The role of Hypermedia in Education: A Look at the Research Issues”, Journal of research on Computing in Education, 22, pp. 431 – 441.
• Jensen, D.L. (1990) “Crisis in Instructional Materials”, Issues in Accounting Education 5 pp. 172-173.
• Jonassen, D.H., (1991) “Representing the Expert’s Knowledge in Hypertext”, Impact Assessment Bulletin, 9(1-2), pp. 93 – 104.
• Jones, J. P. and K.T. Fields, (2001) “The Role of Supplemental Instruction in the First Accounting Course”, Issues in Accounting Education, 16, pp. 531 – 547.
• Lucas, L, “Interactivity: (1992) What is it, and how do you use it?”, Journal of Educational Multimedia and Hypermedia, 1, pp. 7 – 10.
• Marchionini, G., (1988) “Hypermedia and Learning: Freedom and Chaos”, Educational Technology 28(11), pp. 8 – 12.
• Rollock, D., (1992) “Field Dependence/Independence and Learning Condition: An Exploratory Study of Style vs. Ability”, Perceptual and Motor Skills, 74, pp. 807 – 818.
• Unz, D. and F. Hesse, (1999) “The Use of Hypertext for Learning,” Journal of Educational Computing Research, Vol. 20, No. 3, pp. 279-295.
• Weller, H., J. Repman and G.Rooze, (1994) “The Relationship of Learning, Behavior, and Cognitive Style in Hypermedia-Based Instruction: Implications for Design of HBI”, Computers in the Schools, 10(3-4), pp. 401-420.