-
International Journal of Environment, 2(2): 96–105 (2012) ORIGINAL ARTICLE
Community Based Risk Assessment and Adaptation to Climate
Change in the Coastal Wetlands of Bangladesh
Md. Sarwar Hossain and Kushal Roy
ISSN: 2186- 6872 (print) ISSN: 2186-0009 (online)
http://www.BENJapan.org/IJE
ARTICLE HISTORY
Received: 09 May, 2012 Revised: 05 October, 2012 Accepted: 01 December, 2012
Published online: 24 December 2012
Abstract
In recent decades, community based adaptation to climate change has gained enormous attention from scientists, policy makers and development professionals. This paper presents community based risk assessment for identification of risk and local adaptation practices as a response to climate change. The south-western coastal region of Bangladesh was selected as the study area and historical change-chronology study was conducted using statistical analyses and studying community perception. The community’s experience suggests risks are shifting both in magnitude and direction with the increasing frequencies of hydro-meteorological events and their irregularities are threatening adaptation capacities as they are affecting the sensitivity and production of the ecosystem of the region. Communities are increasingly depending on non-agricultural activities while the required time to be spent earning livelihoods is increasing. People are migrating from their traditional occupations towards non-agricultural occupations. In such cases, local adaptation practices are almost absent in the region except for the application of more incentives to compensate production losses. Concerned authorities need to understand the nature of community adaptation and perceptions of climate change in coastal Bangladesh if the country wants to stride forward to negotiate climate change.
Keywords: Community, Adaptation, Risk, Livelihood
2012, International Journal of Environment. All rights reserved.
I.
I
NTRODUCTION1The human civilization is facing the worst challenge ever: global climate change (GCC). Available observational evidence indicates that regional changes in climate, particularly increases in temperature, have already affected a diverse set of physical and biological systems in many parts of the world [1]. However, global climate changes are expected to affect coastal communities around
AUTHORS’ INFO
Md. Sarwar Hossain*
e-mail: koushikadd@yahoo.com
Geography and Environment, Faculty of Social and Human Science, University of Southampton, Building 44, S017 1BJ, UK
Kushal Roy
e-mail: kushalku@gmail.com
Assistant Professor, Environmental Science Discipline, Life Science School, Khulna University, 9208, Khulna, Bangladesh.
*Corresponding author
the world [1, 2] and Bangladesh is already affected severely by the adverse impacts of climate change [3]. Most of the impact of climate change in Bangladesh will affect the south. This coastal part of the country is very susceptible to tropical cyclones, floods, drought, temperature rises, salinity, Sea Level Rise (SLR) etc. [4]. It has been projected for Bangladesh that overall rainfall will increase by around 14% by the year 2020 [5] and will also continue beyond 2075 [6]. Moreover there will be an increase of 2.5-40C in temperature by the year 2075 in the coastal area of Bangladesh [7]. These changes will certainly have impacts on peoples’ livelihoods.
Wetlands cover about 6% of the world’s land surface and contain about 12% of the global carbon pool, playing an important role in the global carbon cycle [8]. This wetland system provides livelihood resources, particularly for food crops, vegetables, fishing and pasture land etc. [9]. For 85% of rural people, this system is the major resource for agriculture and fishery in
Bangladesh [10]. Moreover, the system provides 43% of total fish consumed in Bangladesh [3]. There will be a decrease of 54-75% in access to the natural resources due to changes in temperature and precipitation [11].
The benchmark of the impacts of climate change is already evident in the wetland system. Crop failure is common nowadays due to enhanced temperatures and abrupt changes in precipitation. Increase in production costs is degrading the livelihood security of peoples based in the wetlands [12].
Therefore, risk assessment and adaptation processes are needed for achieving sustainable development, as they introduce an additional layer of complexity and uncertainty into management planning [13]. Moreover, the initial approach to adaptation was dominated by the top-down thinking derived from the original characterization of the issue as a global environmental pollution problem. The best-known formulation is to be found in the IPCC Technical Guidelines for Assessing Climate Change Impacts and Adaptations [14].
Some of the methods can be adapted for use in determining community-based adaptation to climate change and Community Based Risk Assessment (CRA), which has received immense attention in the scientific and policy debate, and is seen as complementary to mitigation [15]. CRA has evolved from the concept of participatory risk assessment. CRA is a participatory process for hazard, risk and vulnerability assessment including coping capacity and final strategy which allows for risk reduction to be carried out in a scientific way by involving stakeholders, especially the local community. This includes risk and social mapping; transect walks, asset inventories, historical and seasonal calendars, risk and hazard prioritization, management options, surveys, focus group discussions (FGD), interviews etc. This tool is mostly used for engagement of stakeholders in national and local risk reduction plans made by governments and non- governmental projects [16–20]. This method can also be used for identifying and understanding climate change effects and local adaptation practices by the community. This mainly involves investigating and gathering information regarding livelihoods, resilience, local risks and hazards. This tool demands special attention for making it simple [17]. Another challenge of this tool is
scale dependency. Since all communities are not the same and different communities are subject to differential risks [4] and scale depended, tools like community based risk assessment are necessary for planning adaptation strategies. Moreover, the perception of the risks of climate change is complex. This multidimensional complexity made up of the understanding of climate risk, the perception of risk by the people for themselves and others [21]. All these studies have been called the classical or first generation of impact and adaptation studies [17].
Responding to recent climate change impacts and vulnerability literature, the purpose of this paper is twofold; first, it provides evidence of changes through risk assessment and secondly, identifies responses in this area, which are referred to as local adaptation practices.
II.
M
ATERIALS ANDM
ETHODSA. Selection of the study area
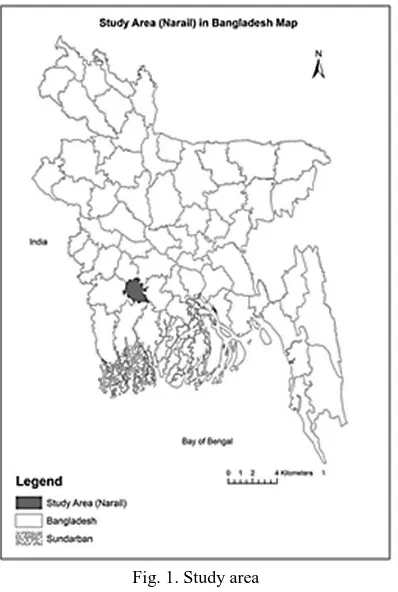
Narail is a southern district (Fig. 1) of Bangladesh with an area of 317 sq km. A river dominant area seasonally nourishes the wetlands of this area. The land elevation is mostly low. Medium depth to shallow depth can be observed along the wetland periphery. This comprises an area of 990 sq km with a population of 730,000. It is apprehended that the average rainfall of the area is 1,467 mm with a 37.1°C maximum and 11.2°C minimum temperature. The hydrological regime of the study area is governed by chitra river in west and Nabaganga river to the north, east and south and by low-lying areas (wetlands) with interconnected channels and water courses. Soils of this area are relatively heavy and low in permeability [22, 23]. This area has been selected because of its socio-environmental aspects. The main economic activity is agriculture and around 73% people are engaged in this occupation. Fishery is the second occupation but only 2% people rely on it as their major occupation. However, around 30-50% people go fishing during the wet season [23]. This area does not suffer from salinity problems due to shrimp revolution which is very common in other coastal parts of the country. Temperature and precipitation changes act as a trigger for changes in water availability, which are linked to human livelihoods in the area and have negative impacts on agricultural production [12]. Moreover, this area is not often threatened by cyclones because of the large distance to the sea. In other parts of
the coastal area which are close to the sea, salinity problems resulting from the shrimp revolution and cyclones create a more complex setting for understanding the impact of climate change. Therefore, we find this an appropriate research study area for exploring socio- environmental dimensions and investigating climate risk and existing coping practices based on the community perceptions.
Fig. 1. Study area
B. Data Collection and Analysis
There were several steps involved in community risk assessment and identification of local adaptation practices in this study. We investigated seasonal and historical calendars, risk identification and prioritization, causal analysis and local adaptation practices. More about this terminology could be found elsewhere [17, 18]. In this study, risks were analysed and community level adaptation practices were investigated using statistical analyses of community perceptions. A historical change- chronology was constructed using FGDs and a questionnaire survey which consisted of a problem census, a seasonal calendar, a causal diagram, a livelihoods mapping problem matrix and a scoring system to identify and prioritize the
risks which are experienced by the community. The time frame is covered two decades (pre-1990s and post 1990s). We have chosen to focus on these two decades because we are concerned with the flexibility and possibility of memorizing events by members of the community who are mostly illiterate, and also because of the sharp rising trend since the 1990s observed in statements regarding climate change by the Intergovernmental Panel on Climate Change (IPCC). The numbers of total respondents (500) were selected by a random sampling method. The survey result has been checked against the reports of FGDs in order to validate the analysis. The problem matrix consisted of intensity and frequency of the problem. Farmers and partly fisherman were involved in this study. Half of the respondents in the FGD were women. First, we established the problems in terms of risks faced by the community. Respondents ranked the problem on a scale of 1-5 both for Intensity and frequency and for risk perception.
Respondents were also asked to score on a scale of 1-10 the historical chronology of risks and social events over the last year, and over the two-decade period Seasonal calendars were also established based on the hazards and livelihood activities for pre-1990s and present time scale. The livelihood resources availability was traced out by scoring on a scale of 1-5. Finally, the local adaptation practices were investigated by consulting with the respondents to understand how the community is currently involved in coping with these risks.
III.
R
ESULTSThe study reveals that community perceptions of common risks around the year are mostly related to hydro-meteorological phenomena. The community’s experience over the last two decades suggests that the main risk persisting is that of the shifting in the period of occurrences of hydro- meteorological events over the year which are, at the same time, expanding in length. This means that the community is facing variable risk events for longer and unusual time periods which are ultimately threatening their adaptation capacities.
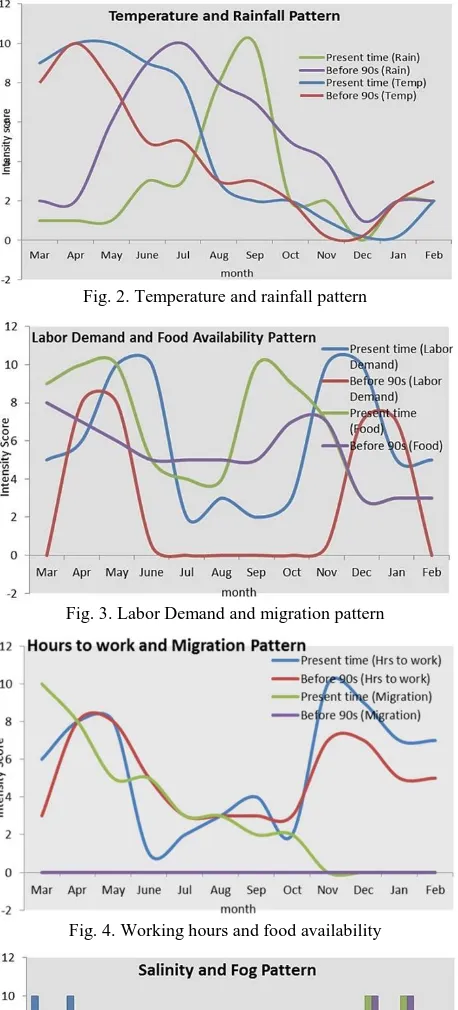
Temperture is observed to have increased over the period of time investigated. Community members reported that they are experiencing enhanced temperatures in combination with abrupt rainfall patterns. Temperture is now intense
-
during summer and colder during winter compared to the 1990s. Rainfall intensity has been observed to have increased whereas the peak rainfall season has shifted. The amount of rain has increased in the post monsoon (Sept-Oct-Nov) season. Before the 1990s, the peak rainfall season was during the monsoon (June-July-August) which coincides with the Bengali months Ashar, Srabon and Vadro. This period was the rainfall season and is also important for the cultivation of local crops. But nowadays, rainfall is mostly occurring in the post monsoon season. This higher amount of late seasonal rainfall is damaging crops (Fig. 2).
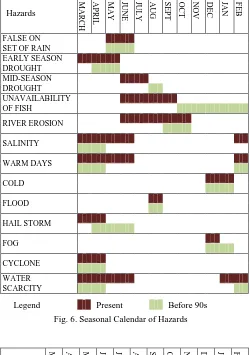
Salinity was rare before the 1990s, but is severely affecting the community nowadays. Communities reported that alongside increasing temperature they are facing more salinity problems in the area, which are almost parallel with drought conditions and have been extended by at least two folds over last 30 years. Severity and frequency of river erosion has also been extended. Hail storms have been observed to have increased while severity of cyclones and floods is reported as negligible in the area (Fig. 5 and Fig. 6). Fig. 3 and Fig.4 show that labor demand has increased compared to the 1990s.
Livelihood activities are demanding more labor input because of the temperature increase, rainfall pattern change and salinity rise. On the other hand, food availability has increased due to adoption of hybrid crops, higher labor inputs, increased technology and intensive cultivation. There was no occupational migration in the 1990s which is very common nowadays. There is no number of working hours except in the monsoon and post monsoon season. Working hours have decreased in the monsoon season and increased in the post monsoon season. The foggy period is observed to have decreased in combination with higher intensity and shorter periods.
Fig. 2. Temperature and rainfall pattern
Fig. 3. Labor Demand and migration pattern
Fig. 4. Working hours and food availability
Fig. 5. Salinity and fog pattern
- Hazards M A R C H A P R IL M A Y JU N E JU LY AUG S EPT OC
T
NOV D EC JAN FEB
FALSE ON SET OF RAIN EARLY SEASON DROUGHT MID-SEASON DROUGHT UNAVAILABILITY OF FISH RIVER EROSION SALINITY WARM DAYS COLD FLOOD HAIL STORM FOG CYCLONE WATER SCARCITY
Legend Present Before 90s
Fig. 6. Seasonal Calendar of Hazards
Livelihood Activities M A R C H A P R IL M A Y JU N E JU LY A U G U S T S EPTEM B E R O C TO B E R N O V EM B E R D EC E M B E R JA N U A R Y F EB R U A R Y BORO T AMAN FISHING DAY LABOR
Legend Present Before 90s
Fig. 7. Seasonal Calendar of Livelihood Activities
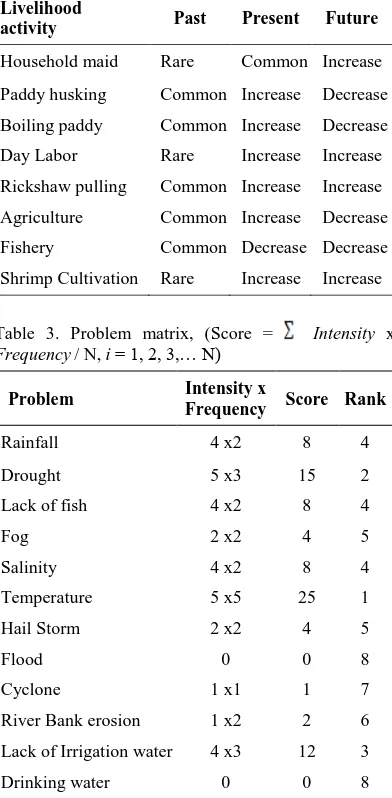
The concept of risk events suggests that most of the threats are posed by temperature rises. For example, Fig. 6 shows that early season drought, mid-season drought, salinity and water scarcity are affecting the livelihoods of the wetland community as the consequence of elevated temperature. Temperature is observed to have risen in all seasons especially from March to September and even in the winter
season. Before the 1990s the period between March and May and the month of August was the period of early season and mid-season drought which now has extended from March to August. The rising of salinity has been observed to be very much parallelto drought. Variation of temperature over time has also affected the sensitivity and production of the ecosystem of the region. The season of ‘unavailability of fish’ has shifted period along with drought conditions. Salinity also increases in the region with the seasonal extension of summer heat and resulting water scarcity of the river.
Fig. 7 reveals that cultivation time of local varieties of rice namely boro and aman are not observed to have changed but farmers reported that their production cost has increased substantially due to the extended length of the foggy period, unusual summer heat, irregular rainfall and extensive salinity. The length of fishing season has been shortening since the 1990s. Due to water scarcity and salinity during the breeding season, fish population in the region has also declined.
Table 1 and Table 2 indicate that livelihood activities round the year are changing in the region. Communities are increasingly depending on non-agricultural activities like day laboring, rickshaw (manual three wheeler) pulling, small business etc. Farmers in the region reported that the production of local aman and aus paddy has reduced by up to 50 percent for the last 5 years. The cost of chemical fertilizers and groundwater irrigation has increased manifolds over the last 15 years whereas these costs were somewhat near to ‘zero’ even in the 1990s.
-
Table 1. Historical trend of sources of livelihoods
Source of livelihoods
Time land Mark After
2000
90s Before 90s
Paddy +++ ++++ +++++
Fish +++ ++++ ++++
Gardening + +++
Cattle +++ ++++ ++++
Tree Product ++ +++ +++
Van/ Rickshaw Puller ++++ ++
Stationary Shop +++ + +
Labor +++ + +
Small Business ++++ ++ ++
Table 2. Trends in source of livelihood
Livelihood
activity Past Present Future
Household maid Rare Common Increase
Paddy husking Common Increase Decrease
Boiling paddy Common Increase Decrease
Day Labor Rare Increase Increase
Rickshaw pulling Common Increase Increase
Agriculture Common Increase Decrease
Fishery Common Decrease Decrease
Shrimp Cultivation Rare Increase Increase
Table 3. Problem matrix, (Score = Intensity x Frequency/ N, i = 1, 2, 3,… N)
Problem Intensity x
Frequency Score Rank
Rainfall 4 x2 8 4
Drought 5 x3 15 2
Lack of fish 4 x2 8 4
Fog 2 x2 4 5
Salinity 4 x2 8 4
Temperature 5 x5 25 1
Hail Storm 2 x2 4 5
Flood 0 0 8
Cyclone 1 x1 1 7
River Bank erosion 1 x2 2 6
Lack of Irrigation water 4 x3 12 3
Drinking water 0 0 8
Concerning trends in livelihood activities, analysis (Table 1 and Table 2) suggests that sources of livelihoods and alternative livelihoods are declining in communities while the required time to be spent engaged in any source of livelihoods is increasing rapidly. For example, a season of winter paddy cultivation requires about 10 hours a day for the entire season nowadays whereas it required less than 5 hours even in the nineties. The pattern of labor demand and seasonal migration has also changed in the region over time. In the past, ‘day labor’, as a source of livelihood was absent but these days this is very common because people are migrating from their traditional occupations such as fishery and agriculture due to high costs and low production. The problem matrix (Table 3) prepared by the communities suggests that climatic events such as rainfall, temperature, drought, salinity are affecting the livelihood. Also, Table 1 entitled ‘Livelihood trends’ constructed by the communities reports that agriculture and direct nature based sources of livelihoods are declining over time while new kind of jobs, of which most were absent in past, like glossary shop, day labor etc. are increasing. This indicates that natural productivity is falling sharply in response to the environmental changes that are occurring in the region. Fig. 6 shows that communities have identified some physical and meteorological causes behind such changes. According to the community, conceived knowledge of hydro meteorological phenomena such as temperature, rainfall, lack of water etc. are the main causes of local environmental problems that are affecting their livelihoods. Livelihood trends and climate change impact shows that dependency of the communities on paddy, fishery and livestock has been reduced over the course of time.
The problem matrix, seasonal calendar and the case studies developed by the communities suggest that climate change might have triggered the changes in livelihoods patterns in the region through the influences of hydro-meteorological events. Temperature is identified as the most severe problem. Communities are experiencing higher intensity and high frequency of heat waves. This is increasing drought intensity and frequency which is also identified as the second most severe problem in the area. However, enhanced temperature is increasing the irrigation water crisis which is also one of the severe problems in the area. Rainfall change, salinity and fish availability are also affecting the community. But
these problems are also strongly related to rainfall change and temperature increase.
Rainfall is following an enhanced trend in the post monsoon season which is increasing the vulnerability of river erosion. Community members reported that water bodies are facing a water crisis in the summer and receiving higher amounts of water discharge in the post monsoon season. This is resulting in river erosion for sudden and intense rainfall within a short period of time. However, the lack water in summer is decreasing water holding capacity by enhancing rates of sedimentation. Water is needed to carry through the sediment which comes from upstream. Moreover, fog is damaging the winter crops because it is getting more intense and lasting for a shorter time period.
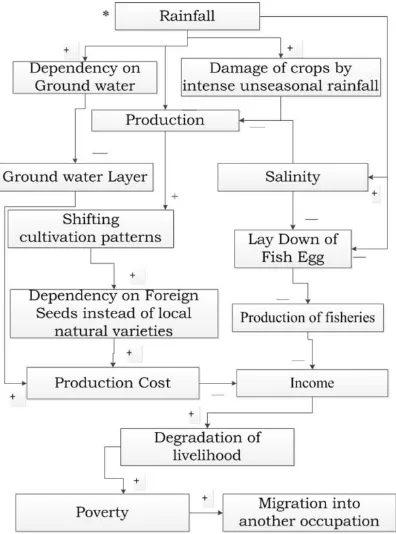
These above problem descriptions comply with the causal relationship of climate change and relevant resources. This causal relationship is obtained from the analysis of community perceptions, which is presented in Fig. 8 and Fig. 9. These figures are mainly representing the above community perceptions in order to understand the linkages between climate change and relevant resources. This has also similarity with the adaptation practices in Table 4.
People are migrating into small business, stationary shops, rickshaw pulling, and day labor as alternative livelihoods and the rate of these changes has gained pace in the recent years. In such cases, local adaptation practices are almost absent in the region except for applying more incentive in the compensation of the rising cost of production of paddy brought on by the application of significant amounts of chemical fertilizer and pesticide, and the use of expensive diesel driven ground water irrigation. Farmers are mostly dependent on foreign seeds instead of local seeds. Local seeds were naturally produced after the harvesting of local crops. The traditional pattern of cultivating local varieties like Jute, Aman, Aus, Til in a pair now seems to be rare. Farmers were used to cultivating this kind of traditional pattern which was suitable for the climate before the 1990s. But nowadays farmers are using hybrid crops which demand extra fertilizer, pesticide and seeds from foreign countries. There is no doubt the demand for food is higher because of the large population, but climatic variation is making the situation complex by adding more pressures
on the cultivation system. However, hybrid crops are adopted to cope with these changes and this requires additional input compared to local crops.
Fig. 8. Causal loop of temperature and relevant resources (+ Increase, – Decrease)
Fig. 9. Causal loop of rainfall and relevant resources (* Irregular or abrupt pattern, + Increase, -Decrease)
-
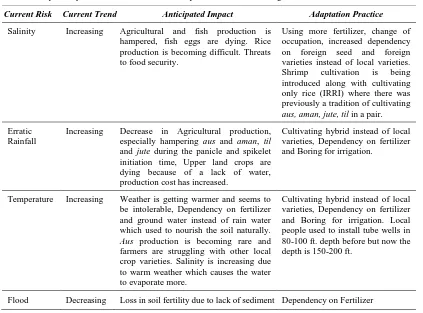
Table 4. Adaptation practices in wetlands under the pressure of climate change
Current Risk Current Trend Anticipated Impact Adaptation Practice
Salinity Increasing Agricultural and fish production is hampered, fish eggs are dying. Rice production is becoming difficult. Threats to food security.
Using more fertilizer, change of occupation, increased dependency on foreign seed and foreign varieties instead of local varieties. Shrimp cultivation is being introduced along with cultivating only rice (IRRI) where there was previously a tradition of cultivating aus, aman, jute, til in a pair. Erratic
Rainfall
Increasing Decrease in Agricultural production, especially hampering aus and aman, til and jute during the panicle and spikelet initiation time, Upper land crops are dying because of a lack of water, production cost has increased.
Cultivating hybrid instead of local varieties, Dependency on fertilizer and Boringfor irrigation.
Temperature Increasing Weather is getting warmer and seems to be intolerable, Dependency on fertilizer and ground water instead of rain water which used to nourish the soil naturally. Aus production is becoming rare and farmers are struggling with other local crop varieties. Salinity is increasing due to warm weather which causes the water to evaporate more.
Cultivating hybrid instead of local varieties, Dependency on fertilizer and Boring for irrigation. Local people used to install tube wells in 80-100 ft. depth before but now the depth is 150-200 ft.
Flood Decreasing Loss in soil fertility due to lack of sediment Dependency on Fertilizer
Shrimp cultivation is getting popular as a measure for increasing the salinity which could alter livelihoods and act as a trigger in changing the environment of the area and this has already been experienced by the southern coastal community of Bangladesh. Trends of increasing temperature and erratic rainfall patterns are creating pressure on ground water resources as the community is dependent on them under extreme climate conditions. Pipe-depth is increasing when tube wells are installed and boring is now common as a strategy for coping with water scarcity under the pressures of climate change. This may lower the ground water table and further increase the depth required for installing pipe for extracting ground water resources.
IV.
D
ISCUSSIONCommunity members’ perceived knowledge of this study resembles the statistical analysis of temperature and rainfall of Bangladesh. Monsoon rainfall is following an irregular pattern in combination with a decreasing trend [4, 24–28]. Rainfall is occurring within a very short period of time [28]. Peak Rainfall is observed to shift from
the monsoon to the post monsoon season [29]. These changes in rainfall are negatively affecting local crop cultivation [12]. Seasonal and annual temperature is following an increasing trend of around 20C per decade in the period 1980-2007. However, the maximum and minimum temperature is also observed to have increased [28]. These changes have also been reported using community perception by CDMP (2006). Changes in seasonal cycle, increase of temperature in combination with extension of summer and enhanced frequency of drought due to climate change have been reported. The community risk perception of the negative effects of these changes and adaptation practices has also been determined. Adaptation practices identified in this study also reveal occupational migration, higher labor inputs and compensation-based adaptation under the odds of climate change. All these adaptation practices are not cost free and also require an extra physical investment [30]. Our findings also resonate with other studies which are focused on the coastal area of Bangladesh. Enhanced frequencies of river erosion, rainfall changes, salinity intrusion etc.
due to changes in climate have been reported. It has also been reported that people are facing higher food insecurity and water crisis due to climate change [31]. However, increasing temperature in combination with abrupt rainfall and salinity increase are resulting in crop failure in the wetlands. These impacts are increasing production costs and dependency on foreign seeds which are also forcing people into occupational migration and towards degraded livelihoods [12].
Three factors point to uncertainty in the outcomes of this study. These are the uncertain nature of climate itself, community perceptions, and scale dependency. It is often challenging to deal with community perceptions in scientific interpretations. These challenges were overcome by engaging a multidisciplinary team for data collection, composed of people with working experience in dealing with communities and familiarity with the study area and technical issues; and by consulting the community. The barriers of scale dependency were overcome by selecting groups with similar livelihood patterns. Farmers and fishermen were selected for the consultation because more than two thirds of the total population belongs to these communities. Half of the total participants were women.
V.
C
ONCLUSIONIt is very clear that climatic variations are increasing and this has multidimensional impacts. However, community perceived evidence states the negative effect of climate change on wetlands resources and ultimately on people’s livelihoods. The scenario is alarming because it suggests the lack of application of indigenous knowledge and local knowledge, shortage of local innovation initiatives, lack of adaptation capacities, and absence of knowledge sharing and lack of understanding. These factors ultimately set these communities in a position of severe vulnerability to future climate change. The government should therefore give immediate attention, should therefore to the issues. Further research should be undertaken to understand the nature of community adaptation and perception of climate change in Bangladesh if we want to stride forward to negotiate climate change and implement community based adaptation to climate change in the country.
A
CKNOWLEDGEMENTThis research is part of the project ‘Mainstreaming Climate Change in National Policy Development Using Environmental Impact Assessment (EIA) Processes in Water Resource Management at Narail, Bangladesh’ supported by the NGO Forum on ADB. This report was published together with other findings of the project in 2010 by Ulashi Sreejony Sangha (USS) and NGO Forum on ADB. Authors’ special acknowledgement goes to Executive Director of USS, Mr. Azizul Haque Moni, for his support in the study. Authors wish to acknowledge Mr. Modasser Hossain and Mr. Mahfuzul Haque for their contribution in data collection.
R
EFERENCES[1] IPCC. 2001. Climate Change 2001: Impacts, adaptation, and vulnerability. Contribution of Working Group II to the third assessment report of the Intergovernmental Panel on Climate Change. Cambridge University Press, pp. 1032.
[2] Monirul M and Mirza Q. 2003. Climate change and extreme weather events: Can developing countries adapt?, Climate Policy, 3: 233-248.
[3] ADB. 2003. Summery Environmental Impact Assessment: South West Area Integrated Water Resources Planning and Management Project in Bangladesh, Asian Development Bank (ADB). [4] Anwar A. 1999. Climate change impacts and
adaptation assessment in Bangladesh. Climate Research, 12: 109-116.
[5] Islam MN. 2009. Rainfall and Temperature Scenario for Bangladesh. The Open Atmospheric Science Journal, 3: 93-103.
[6] Islam MN, Rafiuddin M, Ahmed AU, and Kolli RK. 2008. Calibration of PRECIS in employing future scenarios in Bangladesh. International Journal of Climatology. 28: 617–628.
[7] Roy K, Rahman M, and Kumar U. 2009. Future Climate Change and Moisture Stress: Impact on Crop Agriculture in South-Western Bangladesh. Scientific Briefing series of Unnayan Onneshan.
[8] IPCC. 1996. An Assessment of the Intergovernmental Panel on Climate Change. Intergovernmental Panel on Climate Change (IPCC), Cambridge University Press, New York.
[9] BCAS. 2006. Bangladesh Wetland Ecosystem- Information and Knowledge Base. Bangladesh Centre for Advanced Studies, Dhaka.
[10]DoF (Department of Fisheries). 2000. Fish catch statistics of Bangladesh 1998–1999. Department of Fisheries, Dhaka, Bangladesh.
[11]Saadat. MA and Islam AKMS. 2011. Impact of climate change on rural livelihood: A case study, In: Proc. 3rd International Conference on Water & Flood Management (ICWFM-2011).
[12]Moni AH and Hossain MS. 2010. Response of environmental changes (Climate) in wetlands. In: Proc. 3rd International Conference on Bangladesh Environment 2010 by BEN and BAPA, Dhaka, Bangladesh, pp 167-173.
[13]Allen KM. 2006. Community-based disaster preparedness and climate adaptation: local capacity building in the Philippines, Blackwell Publishing, Disasters, 30:81−101.
[14]Carter TR, Parry ML, Harasawa H, and Nishioka S. 1994. IPCC Technical guidelines for assessing climate change impacts and adaptations. University College London Department of Geography, London, UK, 1994.
[15]UNFCCC. 1997. Kyoto protocol to the United Nations framework convention on climate change. [16]MoFDM. 2008. A facilitator’s guidebook for community risk assessment and risk reduction action plan. Ministry of Food and Disaster Management Bangladesh.
[17]Aalst MK, Cannon T, and Burton I. 2008. Community level adaptation to climate change: The potential role of participatory community risk assessment, Global Environmental Change, 18: 65–179.
[18]Kulatunga U, Zaman M, Biswas AA, Parvez A, and Amaratunga D. 2010. Community risk assessment for disaster risk reduction Challenges and future. In: The Construction, Building and Real Estate Research Conference of the Royal Institution of Chartered Surveyors Held at Dauphine Université, Paris, 2010.
[19]IFRC.2006. VCA Toolbox and Tool Reference Sheets.
[20]Action Aid. 2005. Participatory vulnerability analysis: a step-by-step guide for field staff. Available at:http://www.actionaid.org.uk/doc_lib/ 108_1_participatory_vulnerability_analysis_guide .pdf (accessed 10 June 2007).
[21]Etkin D and Ho E. 2007. Climate change: Perceptions and discourses of risk. Journal of Risk Research, 10: 623-641.
[22]Banglapedia. 2011. The national encyclopedia of Bangladesh. Available at: http://www. banglaped ia.org. [Accessed at: 5th September, 2011].
[23]ADB. 2005. Summery environmental impact assessment: Southwest Area Integrated Water Resources Planning and Management Project in Bangladesh. Asian Development Bank.
[24]Kripalani RH, Inamdar S, and Sontakke NA. 1996. Rainfall variability over Bangladesh and Nepal: Comparison and connections with features over India. International Journal of Climatology, 16: 689-703.
[25]Mirza MQ, Warrick RA, Ericksen NJ, and Kenny GJ. 1998. Trends and persistence in precipitation in the Ganges, Brahmaputra and Meghna river basins. Hydrological Sciences - Journal des Sciences Hydrologiques, 43: 845-858.
[26]Shahid S and Khairulmaini OS. 2009. Spatio- temporal variability of rainfall over bangladesh during the time period 1969-2003. Asia Pacific Journal of Atmospheric Sciences, 45: 375-389. [27]Shahid S. 2009. Rainfall variability and the trends
of wet and dry periods in Bangladesh. International Journal of Climatology, 30: 2299– 2313.
[28]MOEF. 2005. Bangladesh national adaptation programme of action (NAPA). Ministry of Environment and Forest (MOEF) Dhaka.
[29]Hossain MS and Roy R. 2010. Rainfall variability over the south coast of Bangladesh. In: Proc. 3rd International Conference on Bangladesh Environment 2010 by BEN and BAPA, Dhaka, Bangladesh.
[30]MoEF. 2009. Characterizing long-term changes of Bangladesh climate in context of agriculture and irrigation. Climate Change Cell, DoE, MoEF; Component 4b, CDMP, MoFDM. June 2009, Dhaka.
[31]Mahmood SMS, Najneen F, Hoque KS, Rahman S, and Shamim M. 2010. Climate change: A study on impact and people’s perception (a case study on Mongla upazila, Bagerhat district, Bangladesh). Bangladesh Research Publications Journal, 4:153-164.
©2012, International Journal of Environment, 2(2): 95–105