IP Packet Capture on High Throughput Networks by Using NUMA
Architectures
Marco Mezzalama1, Gianluca Oglietti2 and Enrico Venuto3
1, 2, 3
Politecnico di Torino – DAUIN, Corso Duca degli Abruzzi, 24 - 10129 Torino (TO)
1
[email protected], [email protected], [email protected]
ABSTRACT
Capture packets from IP networks is a commonly used technique in many IT fields for monitoring and analysis the IP traffic flows exchanged over computer networks. The new infrastructures for high throughput networks, however, have made this important technique more and more complex to carry out (also in small or medium sized local networks) even if using the newest multi-core systems developed today. This paper therefore shows some limits of a recent packet capture system, implemented by using a NUMA architecture, and suggests a possible solution that could be adopted to obtain a full functional IP packet capture system on high throughput networks.
Keywords: Packet Capture, Networks, High Throughput, Security, NUMA Architecture, Multi-core.
1. INTRODUCTION
Capture packets from IP networks is a commonly used technique in many IT fields for monitoring and analysis the IP traffic flows exchanged over computer networks. It has always been considered of great importance, for instance, in support of computer networks security, due to its role in the identification of anomalous behaviors that could be associated with viruses, hacking, spam or computer fraud. The new infrastructures for high throughput networks, however, have made this important technique more and more complex to carry out (also in small or medium sized local networks) even if using the newest multi-core systems developed today. In the last years, in fact, there has been a substantial increase in the capacity of communication channels used in the LAN/WAN networks to provide users with access to new services made available on Internet: in the local area networks (LAN) the 100 Mbps copper cables have been replaced, in a first time, by 1Gbps copper cable and now by 10 Gpbs optical fibers while in the metropolitan/wide area network (MAN/WAN) it is common to find point-to-point optical fiber connections
with throughput of 1 Tbps or, in laboratory, of 255 Tbps [1]. The implementation of these high capacity network infrastructures has made the real time IP packets capture process more and more complex showing some limits of the currently used acquisition systems.
The following paragraphs show, by making some simple tests, how the number of lost packets increases significantly fast even when using multi-core systems and a modern networks card only in a 1Gbps local area network. This paper therefore shows some limits of a recent packet capture system, implemented by using a NUMA architecture, and a possible solution will then be proposed.
All tests were performed using a NUMA architecture based on Intel hardware but the results can also be extended to other families of CPUs.
2. BACKGROUND OF NEW HARDWARE
TECHNOLOGIES
Modern computers and new network adapters are based on advanced technologies that need to be known in order to assemble a new system to capture and to monitor the IP traffic in high throughput networks.
2.1. Multi-Core Systems: The NUMA Architecture
The latest generation of servers are characterized by a hardware architecture developed with the purpose to insert in the same motherboard a high number of processing units, called cores, also distributed over more than one processor. One of the multi core architectures mostly used today is NUMA (Non Uniform Memory Access).
The opportunity to use, in the same system, two or more NUMA nodes allows to considerably increase the computing capacity: each multi-core processor in fact is able to access, at the same time and independently, the portion of memory directly connected to it. By using this kind of architecture it is possible to achieve another performance gain thanks to the minimization of the number of the processor cache memory’s access failures as well as the minimization of the overall number of system memory accesses. However, in general, it is possible to achieve these performance gains only by scheduling the processes on the cores of the NUMA nodes where the processed data are located. The optimal process scheduling on a NUMA system, however, is very complex [2] because it strongly depends on how the processes use the system memory and how many processes are executed on the same NUMA node [3].
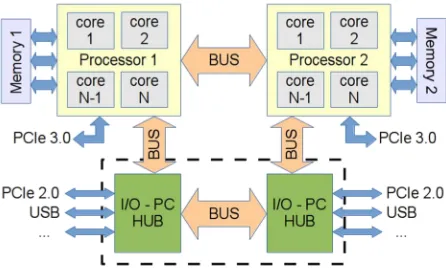
Fig. 1. Block diagram of a generic NUMA architecture
Fig.1 shows a general block diagram of a NUMA architecture. It is composed by two nodes interconnected to the system peripherals by two I/O Controller Hub (ICH or I/O Hub) or Platform Controller Hub (PCH) depending on the server type. Each node results directly connected to the others through a dedicated bus (in the Intel architecture this bus is called “Quick-Path Interconnect” or QPI) and to only one of the two I/O Hub (again with a QPI bus) or PC Hub (with a DMI connection). Each node, furthermore, is also directly connected to only one PCIe 3.0 bus (if available). It is clear that this kind of architecture is not symmetric: without modifying the interconnections between peripherals and the Controller Hub or between peripherals and the PCIe 3.0 bus the system performance may change according to the node selected to execute the programs code. Usually we can reach the best performances by assigning all the processes that need to use a particular peripheral to the node where that particular peripheral is connected and, obviously, using a number of processes smaller or equal to the number of cores made available by that node.
2.2 The Evolution of the Network Adapters
Innovative technologies have been also introduced in network cards in the last years in order to maximize the exploitation of the faster and faster available network links. One of the first such technologies aimed at reducing the number of operations executed by the system CPU (TCP Offload Engine technologies [4][5]) and at reducing of the number of interrupts sent to it
(Interrupt Moderation technology [6]). These
technologies, however, have become insufficient due to the increase of the network throughput.
Last generation network cards (such as those realized with the Intel controller 82599), are based on technological solutions allowing to optimize the memory read and write operations (Direct Cache Access technology [7]) and, with the introduction of multiple receive and transmit queues, to use all the available cores of the modern system CPU: Extended Messaged Signaled Interrupt (or MSI-X, that gives the possibility to assign the interrupts generated by a particular queue always to the same core using the SMP affinity [8][9]) and Receive Side Scaling (or RSS, that, in hardware, allows the network controller to share all the captured packets over all enabled queues). These last two technologies are particularly important for the purposes of this paper.
3. THE PACKET CAPTURE SYSTEM:
HARDWARE, SOFTWARE AND FOUR
DIFFERENT CONFIGURATIONS
The following paragraphs show information about the hardware architecture and the different software configurations used during the tests of network traffic capturing.
3.1 Hardware
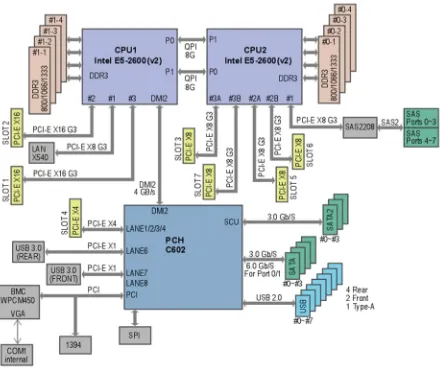
The server used during the four different packet capture tests was built around the Supermicro X9DAX-7F motherboard, whose internal structure is shown in Fig. 2. It is based on a NUMA architecture with two nodes connected between them by two QPI busses. The motherboard provides six external PCIe bus version 3.0 (on X16 and X8 slots) and an integrated network card based on the Intel i350 controller (10/100/1000 Gbit/s). Each node is equipped with 16GB of RAM and a CPU Intel Xeon E5-2670 @ 2.60GHz (16 cores in total: 8+8HT)
The motherboard chosen is capable of supporting all the hardware technologies available on the network card.
Fig. 2. Internal structure of the motherboard used for the tests
3.2 Software
The server we used ran the GNU/Linux Ubuntu 14.04.3 LTS (64 bits) operative system with a kernel updated to the 3.19 version. The 10 Gbit/s network card was configured using the ixgbe driver updated to the 3.7.21-NAPI version (the latest version with the “Node” parameter that allow to manually choose which memory will be allocated).
3.3 Network drivers configuration
The proper configuration of the ixgbe driver require some specific information about the system that is possible to retrieve by using some Linux commands or by checking the content of some particular kernel files. Using the numactl command it was possible to know details about the NUMA architecture: the number of nodes, the size of the installed memory and the subdivision of the cores among the nodes. After that it was possible to identify the network interfaces and, extracting the PCI_ID with the lspci command, to verify to which node they were interconnected to, checking the appropriate /sys/bus/pci/devices/PCI_ID/local_cpulist files. The analysis of the obtained results indicates that the multi-core system has four 10Gbit/s network interfaces directly connected to node 0 (core 0, 1, 2, 3, 4, 5, 6, 7, 16, 17, 18, 19, 20, 21, 22, and 23).
3.4 The Packets Capture Tests
All the tests were performed sending blocks of 50.000.000 IP packets to the packets capture system at different throughput: 1, 2, 3, 4, 5, 6, 7, 8, 9 and 10
Gbit/s. For each of these throughput values seven packets streams of different size were sent as recommended by RFC 2544 [10]: 64, 128, 256, 512, 1024, 1280 e 1518 bytes. During the packets capture tests the used software had only to count the number of received packets for each different stream. All tests were performed three times and the table Tab. 1 contains the average of these repetitions.
In order to identify possible problems in a NUMA architecture, while capturing IP packets from a high throughput LAN, we have analyzed the results of four different tests described in the following paragraphs.
3.4.1 First Test: Best Use of All the Available Technologies
The aim of this first test was to capture IP traffic using a specific ixgbe driver configuration to make the best use of all the available technologies. For this reason 16 queues have been initialized for each network interface (a queue for each available core in a node), while the driver has been configured in order to use the memory provided by node 0, that had the network card directly connected. Linux identified the network interfaces with the names eth2, eth3, eth4 and eth5 but in all the tests has been only used the eth2 interface. The list of all the performed operations is the following:
1) System preconfiguration: before changing the interrupts allocation (SMP affinity) the irqbalance daemon must be disabled (it is used to dynamically redistribute all the interrupts generated from the peripherals among all available cores in order to optimize the performance). The ixgbe driver must also be removed from the system memory before it can be reconfigured.
~# killall irqbalance ~# rmmod ixgbe
2) Loading of the ixgbe module into memory: the ixgbe module must be configured to use only the memory located into node 0 (Node=0,0,0,0) and to initialize 16 receive queues on each interface (RSS=16,16,16,16).
~# insmod /PATH/ixgbe.ko Node=0,0,0,0 RSS=16,16,16,16
the Ethernet protocol and maximize the size of the receive (rx) ring buffers.
~# ethtool -A eth2 autoneg off rx off tx off ~# ethtool -s eth2 speed 10000
~# ifconfig eth2 up ~# ethtool -G eth2 rx 8192
4) Assignment of the interrupts generated by the queues to their core on Node 0: in order to assign the interrupts generated by queues at the cores of Node 0 it is enough to extract their identifier (IRQ_ID) from the /proc/interrupt file and to opportunely modify the
/proc/irq/IRQ_ID/smp_affinity files.
The software used to count the number of the captured IP packets was tshark:
~# tshark -qi eth2
3.4.2 Second Test: Non Optimal Mode
The aim of this second test was to capture IP traffic configuring the ixgbe driver in a non optimal mode. To do this, the driver has been configured in order to use node 1, which had no network card directly connected. To make a comparison with the data obtained in the previous test, also in this case, 16 receive queues have been reinitialized. Here is the list of all the performed operations:
1) System preconfiguration (as in the first test). 2) Loading of the ixgbe module into memory:
~# insmod /PATH/ixgbe.ko Node=1,1,1,1 RSS=16,16,16,16
3) Network interface configuration (as in the first test).
4) Assignment of the interrupts of the queues to the cores on Node 1.
The software used to count the number of the captured IP packets was tshark.
3.4.3 Third Test: Use of a Single Queue with Cache Optimization
The aim of this third test was to verify the effects of using a single queue within the network interface (RSS=1,1,1,1). The only generated interrupt has been assigned to a core of node 0 (core number 2) and, to
optimize the cache use, the capture program has been scheduled on the same core. The performed operations in this case are:
1) System preconfiguration (as in the first test).
2) Loading of the ixgbe module into memory:
~# insmod /PATH/ixgbe.ko Node=0,0,0,0 RSS=1,1,1,1
3) Network interface configuration (as in the first test).
4) Assignment of the interrupt of the only queue to the core 2 of Node 0.
The software used to count the number of the captured IP packets was tshark. However, to make sure that the scheduler runs the tshark command on the core2 of node 0, the following taskset commands must be used:
~# taskset -pc 2 PID_TSHARK
~# taskset -pc 2 PID_TSHARK_CHILD
Where PID_TSHARK is the PID of the tshark process while PID_TSHARK_CHILD is the pid of the child process (dumpcap).
3.4.4 Fourth Test: Use of a Single Queue without Cache Optimization
The aim of this fourth test was to verify the effects of the lack of processor cache optimization guarantee. In this case the IP packets capture software has been scheduled on a core of node 0 (core 3) different from the one used to manage the interrupts generated by the only enabled queue on the interface (RSS=1,1,1,1). The list of all the performed operations is:
1) System preconfiguration (as in the first test).
2) Loading of the ixgbe module into memory:
~# insmod /PATH/ixgbe.ko Node=0,0,0,0 RSS=1,1,1,1
3) Network interface configuration (as in the first test).
4) Assignment of the interrupt of the only queue to the core 2 of Node 0.
The softwares used to count the number of the captured IP packets were tshark and taskset:
~# taskset -pc 3 PID_TSHARK
3.5 Results Obtained During the Four Tests
The data obtained in these first 4 tests, shown in Tab. 1, are quite discouraging: even at a relatively low throughput (1 Gbit/s), in fact, we have never been able to capture more than 81.3% of the transmitted packets. On average, then, during all these tests, the capture system has never been able to capture more than the 35% of the transmitted packets: 15.0% in the first test, 14.7% in the second, 8.6% in the third and 34.5% in the fourth.
3.5.1 The Results of the First Test
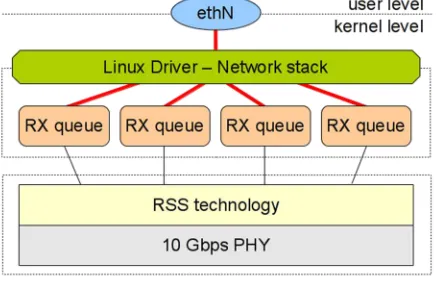
Setting the network card driver to initialized 8 received queues has not proved to be an optimal choice because the network stack of Linux is not able to manage them properly. As can be seen from the data reported in Tab. 1, this test has obtained the worst results with small packets (64, 128 e 256 byte), that is when the number of packets captured by the network card per time unit was maximum. The operative system, in fact, in these conditions, was not able to capture the IP traffic because the network stack had to use almost all the available resources to bring together the IP packets coming from the various queues and deliver them to the user-level program using the only software interface available, eth2. (See Fig. 3).
Fig. 3. Single output interface of the Linux network stack
3.5.2 The Results of the Second Test
The results obtained during the second test allow to evaluate whether it is really necessary to configure the ixgbe driver in order to use the resources of the correct node (the node on which the network adapter is directly connected). By observing the collected data we obtain
that, on average, 0.3% of packets less than in the previous test were captured (15.0%, however, against a discomforting 14.7% of the first test). So, in a first approximation, it would seem that using the correct node is not essential. It is necessary, however, to emphasize the fact that during these tests the user-level process (tshark) was limited to count the captured packets. Then, during these tests, the QPI bus resulted to be used only marginally because no more resource consuming processes were running on the system. In light of these considerations, and given the obtained results (0.3% of degradation), in a real case the configuration of the ixgbe driver in order to properly use the NUMA architecture used is mandatory.
3.5.3 The Results of the Third Test
The results obtained during the third test are absolutely the worst. These results are due to the fact that the capture program has been scheduled to be executed on the same core used to handle the interrupts generated by the queue. If on the one hand this configuration optimizes the utilization of the cache inside the core, on the other hand it completely uses up the resources of the core. The only core used in the test, in fact, had not sufficient computing resources to run both the code of the user-level program and all the necessary operations required to capture packets from the network card. Many of the packets, in this case, were removed directly from the Packet Throttling [11] inside the network card driver.
3.5.4 The Results of the Fourth Test
The results obtained during the fourth test are clearly the best because, compared to the third test, it used two different cores: one for the management of the interrupts coming from the card and one for the execution of the user-level program. This configuration, though it does not guarantee to optimize the use of the cache, allows to have a greater amount of computing resources and also a smaller number of context switches on both of the used cores. The choice to use two cores belonging to the same node guarantees, if not the optimization of the first-level cache, to limit the number of errors of cache miss. Compared to the first test, then, the choice to disable RSS technology allowed the system to avoid wasting resources to reassemble, to the single ethN interface, packets from different queues.
4. A POSSIBLE SOLUTION TO REALIZE
A PACKETS CAPTURE SYSTEM FOR
HIGH THROUGHPUT NETWORKS
The poor obtained results previously described are due to the fact that the standard drivers, the NAPI interface and the network stack of the Linux kernel have been implemented in order to be compatible with almost all of the network adapters on the market and in the most varied application areas. This choice makes this software layer not optimized to be used to capture IP packets in the presence of high throughput. In order to capture this kind of network traffic some new software layers optimized for this purpose must be developed. A solution that has been proposed to overcome this problem is the definition of a packet processing framework, called PF_RING ZC (Zero Copy) [12]. This framework is composed by a socket, called PF_RING [13][14], used to optimize the management of IP packets within the operating system and a set of drivers, called ZC driver, in order to optimize the phase of packets transfer between the hardware layer and the software. To make these technologies accessible to the developers of user level programs specific software API (Application Programming Interface), have been made available. These libraries, among other things, allow the user code to perform many operations on the just acquired IP packets using the zero-copy technology [15] which avoids making copies of data in memory wasting valuable CPU computing resources [16].
In the following paragraphs we show the results of further tests performed to evaluate the actual improvements resulting from the use of PF_RING ZC framework in a packets capture system.
4.1 The Configuration of the New Software
Environment
In order to make a comparison with the results already obtained in the previous tests, no hardware or software changes have been made at the capture system previously described. The only changes concern the driver used to configure the 10 Gbit/s network adapter, ixgbe-ZC driver updated to version 3.22.3 (very close to the NAPI version), and the use of the new PF_RING socket updated to version 6.1.1.
The system configuration is almost identical to the one used in previous tests because no significant change is needed to initialize the socket PF_RING and to load the ZC driver. The PF_RING socket is loaded on the system as a standard kernel module (the kernel does not need to be patched and recompiled) while the ixgbe-ZC driver behaves apparently as the standard ixgbe driver. The only difference between the two drivers is the name assigned to the network interfaces: all operations are
performed by using the zero-copy technology by changing the suffix "eth" in "zc:eth".
In order to use the new features provided by this new layer it is necessary, however, to recompile the user level software by replacing the standard libpcap libraries with libpcap-PF_RING provided by the framework developers.
The execution of the tests is identical to that used previously.
4.2 Fifth Test: Use of a New Packet Capture
Framework
The aim of this test was to capture the IP traffic configuring the new software layer in an optimal way using the least possible amount of hardware resources. For this reason each interface has been initialized with the largest possible number of slots available in the receive circular queue (through ethtool command) while the driver has been configured to use the cache memory made available on core 2 of node 0, directly connected to the card, and a single receive queue. The PF_RING socket, instead, does not need any kind of configuration. Linux identified the network interfaces with the names zc:eth2, zc:eth3, zc:eth4 and zc:eth5 but, in this test, only the zc:eth2 interface has been used. Here is the list of all the performed operations:
1) System preconfiguration (as in the first test).
2) Loading of the PF_RING module into memory
(no particular configuration is required):
~# insmod /PATH/pf_ring.ko
3) Loading of the ixgbe-ZC module into memory:
the ixgbe-ZC module must be configured in order to use, only for the zc:eth2 interface, the memory located on core 2 of node 0 (numa_cpu_affinity=2,0,0,0) and to initialize
one receive queue on each interface
(RSS=1,1,1,1).
~# insmod /PATH/ixgbe.ko
numa_cpu_affinity=2,0,0,0 RSS=1,1,1,1
4) Network interface configuration: the
configuration is almost identical to that used in the first test.
~# ethtool -A eth2 autoneg off rx off tx off ~# ethtool -s eth2 speed 10000
~# ifconfig eth2 up
~# ethtool -G eth2 rx 32768
5) Assignment of the interrupt of the only queue to core 2 of Node 0.
PF_RING socket source code. This software has been configured to run by the scheduler on core 2 (-g2 parameter) and to use the “active packet wait” function (-a parameter). By activating this function, instead of using polling to check if there are IP packets into the receive buffer, pfcount will check the contents of the buffer as soon as it has finished processing the previously captured packet.
~# pfcount -i zc:eth2 -g2 -a
4.3 The Results of the Fifth Test
The data obtained from this test, as can be seen in Tab. 1, are the best of all: the capture system, in fact, has been able to acquire and count all packets sent to all throughput, from 1 Gbit/s to 10 Gbit/s.
It should be also noted that the optimizations made with the introduction of PF_RING ZC framework have permitted to use a single core both to manage the
interrupts from the card and to execute the simple user-level software. This configuration, as seen during the third and the fourth tests, is not optimal because the use of more complex packets processing software could lead to a sudden decrease of the efficiency of the capture system. If we compare, however, the data obtained during this test with those obtained during the third test (identical configuration but standard driver) it is possible to see how the framework is effectively optimized and represent a possible solution for the realization of an IP packet capture systems in high throughput networks.
5. THE RESULTS OBTAINED DURING
THE FIVE TESTS
The results obtained during these five tests are included in the following (Tab. 1) table:
Sent packets (byte @ Gbit/s)
Captured packets (%) Sent packets (byte @ Gbit/s)
Captured packets (%) 1° test 2° test 3° test 4° test 5° test 1° test 2° test 3° test 4° test 5° test 64 @ 1 17,3 17,2 1,2 65,7 100 64 @ 6 2,1 2,1 0 21,1 100 128 @ 1 14,1 13,7 12,7 81,3 100 128 @ 6 2,7 2,3 0 22,4 100 256 @ 1 15,8 15,7 12,8 74,1 100 256 @ 6 12,5 11,7 0 26,8 100 512 @ 1 24,1 24,1 13,1 68,8 100 512 @ 6 17,3 17,4 2,4 25,9 100 1024 @ 1 31,8 31,3 21,3 65,6 100 1024 @ 6 17,4 17,2 14,1 24,3 100 1280 @ 1 35,0 34,8 25,0 69,1 100 1280 @ 6 17,5 17,4 14,6 23,0 100 1518 @ 1 42,4 41,1 26,4 70,2 100 1518 @ 6 17,4 17,5 15,2 23,6 100 64 @ 2 14,3 14,1 0 48,4 100 64 @ 7 2,2 2,0 0 16,9 100 128 @ 2 26,6 26,7 0,5 62,9 100 128 @ 7 2,3 1,9 0 19,5 100 256 @ 2 15,3 14,7 11,9 58,7 100 256 @ 7 9,8 9,5 0 22,1 100 512 @ 2 24,1 23,2 12,3 52,9 100 512 @ 7 15,2 14,7 4,3 23,7 100 1024 @ 2 31,2 30,5 17,3 55,6 100 1024 @ 7 16,5 16,5 14,5 23,5 100 1280 @ 2 33,4 33,1 22,2 55,8 100 1280 @ 7 16,2 15,8 16,4 22,9 100 1518 @ 2 36,1 35,8 30,2 56,3 100 1518 @ 7 16,6 16,4 16,0 22,2 100
64 @ 3 4,1 3,7 0 37,2 100 64 @ 8 1,9 2,1 0 13,8 100
128 @ 3 15,1 14,6 0 57,2 100 128 @ 8 2,1 2,0 0 17,4 100 256 @ 3 27,7 27,5 1,4 57,5 100 256 @ 8 7,9 8,1 0 19,9 100 512 @ 3 25,2 25,3 11,8 51,3 100 512 @ 8 13,7 13,3 0,8 19,7 100 1024 @ 3 24,3 23,9 16,1 52,9 100 1024 @ 8 13,1 12,7 9,5 21,0 100 1280 @ 3 24,1 23,7 24,7 51,7 100 1280 @ 8 13,6 12,9 13,3 20,3 100 1518 @ 3 25,9 25,2 25,3 52,6 100 1518 @ 8 13,6 13,1 13,5 20,6 100
64 @ 4 2,6 2,1 0 31,8 100 64 @ 9 1,5 1,3 0 11,8 100
128 @ 4 10,5 9,8 0 38,3 100 128 @ 9 1,6 1,6 0 14,2 100 256 @ 4 22,8 22,1 0,7 41,6 100 256 @ 9 4,4 3,9 0 17,1 100 512 @ 4 21,7 21,5 12,9 42,4 100 512 @ 9 11,9 11,2 0 19,3 100 1024 @ 4 19,4 19,3 18,5 44,2 100 1024 @ 9 11,5 12,1 8,8 19,1 100 1280 @ 4 18,8 18,4 18,0 43,0 100 1280 @ 9 11,2 10,7 11,2 18,8 100 1518 @ 4 18,4 18,2 18,7 42,7 100 1518 @ 9 11,7 10,9 10,8 18,2 100
64 @ 5 2,3 2,1 0 26,2 100 64 @ 10 1,1 0,9 0 9,7 100
128 @ 5 8,6 7,7 0 27,5 100 128 @ 10 1,2 0,9 0 11,6 100 256 @ 5 16,0 15,5 1,3 32,7 100 256 @ 10 1,1 0,7 0 14,2 100 512 @ 5 18,3 17,8 4,6 31,0 100 512 @ 10 9,9 9,7 0 15,0 100 1024 @ 5 17,4 17,1 17,5 33,2 100 1024 @ 10 10,3 9,9 4,1 16,5 100 1280 @ 5 17,3 17,3 17,0 33,9 100 1280 @ 10 9,7 10,1 9,8 15,3 100 1518 @ 5 16,9 17,1 17,4 31,6 100 1518 @ 10 10,1 9,8 10,0 15,8 100
7. CONCLUSION
The IP packets capture technique, in the last few years, has become fundamental in many IT fields such as the
Information Security where it is routinely used for monitoring computer networks. Being able to capture all IP packets crossing a network, having a fully functional packets capture system, may allow IT Security operators to identify any anomalous behavior possibly related to security issues such as, for example, viral infections, hacking attempts, spam or fraud attempts.
The IP traffic monitoring, with the passing of time, has become more and more complex due to the increase of the throughput. Until today in fact, with a throughput of the order of several hundred Mbit/s, normal mono-core computers were enough to capture all the traffic transmitted over a LAN without need to know in depth any information about the hardware architecture used. With throughput that are now close to 10 Gbit/s, instead, not only it is fundamental to know the hardware used, but also a knowledge of the technologies implemented by producers both on the new motherboard and on the new network adapters is required. One of the purposes of this contribution was in fact to show how the performance (in terms of the number of IP packets acquired) of a capture system realized with a modern NUMA multi-processor server could vary in a consistent way by tuning some simple software parameters (the number of queues used on the network card, the affinity card - processor, the affinity queue - core and the affinity process - core) never taken into consideration by capture systems used until now.
In light of the discouraging results obtained during the first four tests (where it was captured less than 35% of the traffic sent to the network card) it is also possible to assert that, in order to monitor transit traffic over high throughput LANs, the use of powerful computers and network cards of last generation is not sufficient, but it is absolutely necessary to make deep changes to the software used. The poor performance obtained in the first four tests are in fact caused by the use of the standard drivers (NAPI) of network cards and to the network stack of the Linux kernel that was designed to guarantee the normal operation of a network interface and does not appear to be optimized for the packets capture.
In order to realize a high performance packet capture system it is therefore necessary to introduce a new software layer [17]. As seen in the latest test carried out, thanks to the PF_RING ZC framework it was possible to capture all packets transiting over a high-throughput
network using only a small portion of the computing resources provided by last generation multi-core servers.
REFERENCES
[1] “Ultra-high-density spatial division multiplexing with a few-mode multicore fibre”, R.G.H. van Uden, R. Amezcua Correa, E. Antonio Lopez, F.M. Huijskens, C. Xia, G. Li, A. Schülzgen, H. de Waardt, A. M. J. Koonen & C. M. Okonkwo, 2014. [2] “Memory Management in NUMA Multicore
Systems: Trapped between Cache Contention and Interconnect Overhead”, Zoltan Majo et al, 2011. [3] “Memory system performance in a NUMA
multicore multiprocessor”, Zoltan Majo, Thomas R. Gross, 2011.
[4] “TCP offload engine”, http://goo.gl/7Qpl3.
[5] “TCP offload performance for front-end Servers”, K. Kant, 2003.
[6] “Interrupt Moderation Using Intel GbE Controllers”, Intel, http://goo.gl/G8FJ6, 2007.
[7] “Direct cache access for high bandwidth network I/O”, Huggahalli R., Iyer R., Tetrick S., Computer Architecture, 2005.
[8] “SMP IRQ affinity”, Ingo Molnar, Max Krasnyansky, http://goo.gl/fmoHb.
[9] “An in depth analysis of the impact of processor affinity on network performance”, A. Foong, J. Fung, D. Newell, 2004.
[10]“Benchmarking Methodology for Network Interconnect Devices”, S. Bradner, J. McQuaid, http://www6.ietf.org/rfc/rfc2544, 1999.
[11]"napi", Linux Foundation, http://goo.gl/H38Fu, 2009.
[12]"PF_RING ZC (Zero Copy)", http://goo.gl/NUchB6. [13]"PF_RING: High-sped packet capture, filtering and
analysis", http://goo.gl/VWBNh.
[14]"The high performance packet capture based on the PF_RING socket in Linux”, R. Gu, Y. Tan, Y. Jia, J. Wang, 2007.
[15]"Zero-copy", http://goo.gl/re4FM.
[16]"LyraNET: A zero-copy TCP/IP protocol stack for embedded operating systems", Y. C. Li, M. L. Chiang, 2005.