Abstract— Air pollution is assuming alarming dimensions from industries, automobiles and house hold fuel burning. Cement industry can be classified as highly air polluting industry emitting PM (Particulate Matter) into the atmosphere. This pollutant is in the form of PM (Particulate Matter) is required to be control by installing air pollution control equipment like ESP (Electrostatic Precipitators), Bag houses, Wet scrubbers and cyclone. Cyclone is considered to be cheaper having low maintenance cost. The present paper aims at designing of high efficiency cyclone by using STAIRMAND METHOD for a tiny cement plant. The efficiency achieved with this design is of the order of 91.1 %.
Index Terms— Air pollution, cyclone, pm (particulate matter), tiny cement plant
I. INTRODUCTION
The tiny cement plants are having a capacity of ranging from 20tpd to 50tpd. These cement plant are either based on vertical shaft kiln or rotary kiln technologies. The predominant air pollutant emitted on from such plant is SPM (Suspended Particulate Matter). Control of SPM (Suspended Particulate Matter) can be achieved by installing ESP (Electrostatic Precipitators), Bag houses and Wet scrubbers but these equipments are highly cost intensive and may not be feasible to be installed at such small scale cement plants on techno-economical front. Hence, under the present context, installation of cyclone appears to be a reasonable proposition, which is reasonable cheaper and having low operating cost [16].
A. The salient features of the cyclone are as under [13] [14]
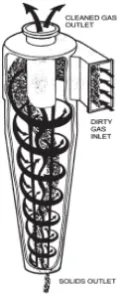
1) Structure without moving parts.
2) Centrifugal force created; tend to drive particles to the wall of cyclone.
3) Inlet velocity of gas stream transformed into a confined vortex or spiral flow downward between walls of gas discharge outlet and body of cyclone or main vortex.
II. APPLICATION OF CYCLONE
Applications of cyclone are as under [14]
Manuscript received August 31, 2011, revised October 10, 2011. This work is supported by Kalol Institute of Technology and Research Center, Kalol, India.
F. A. Niki Gopani and S. B. Dr. Akshey Bhargava are with Institute of Technology and Research Center, Kalol, Gujarat, India. (e-mail: [email protected]; [email protected]).
1) Sawmill 2) Oil refineries 3) Cement industry
4) Feed and grain processing 5) Mineral processing 6) Paper and textile industry 7) Wood working industry
8) Vacuum cleaners and central vacuum cleaners
III. ADVANTAGE OF CYCLONE
Advantages of cyclone are as under [14] 1) Low initial cost
2) Simple construction and Operation 3) Low pressure drop
4) Low maintenance requirements 5) It has no moving parts
6) Continuous disposal of solid particulates
7) They can be constructed of any material which will meet the temperature and pressure requirements and the corrosion potential of the carrier gas stream
IV. DISADVANTAGE OF CYCLONE
Disadvantages of cyclone are as under [14]
1) Low collection efficiency for particles below 5-10 µ in diameter
2) Equipment is subject to severe abrasive deterioration. 3) Decreasing collection efficiencies for decreasing
dispersoid concentration in the gas stream
V. STANDARD CYCLONE DESIGN BY STAIRMAND METHOD
Stairmand developed two standard design for gas-solid cyclones (1) High efficiency cyclone[1], figure 3(a)and (2) high gas rate cyclone, figure 3(b)[11].The performance curve for these design, obtained experimentally under standard test conditions, are shown in figure 4(a) and D(b).[4] This curve can be transformed to other cyclone sizes and operating conditions by use of the following equation, for a given separating efficiency[2]
D2= [(DC2/DC1)3 X Q1/Q2 X ∆ρ1/∆ρ2 X µ2/µ1]1/2 (1) where,
d1=mean diameter of particle separated at the standard conditions, at the chosen separating efficiency, figure 4(a) or 4(b).
Design of High Efficiency Cyclone for Tiny Cement
Industry
D2=mean diameter of the particle separated in the proposed design, at the same separating efficiency, DC1=diameter of the standard cyclone = 8 inches (203 mm),
DC2=diameter of proposed cyclone, mm, Q1=Standard flow rate:
For high efficiency design =223 m3/h, For high throughput design = 669 m3/h, Q2=proposed flow rate, m3/h,
Δρ1=solid-fluid density difference in standard conditions = 2000 kg/m3
Δρ2=density difference, proposed design,
µ1=test fluid viscosity (air at 1 atm,200 C) =0.0018 mNs/m2
µ2=viscosity of proposed fluid.[10]
A performance curve for the proposed design can be drawn up from , figure 4(a) or 4(b) by multiplying the grade diameter at, say each 10 per cent increment of efficiency, by the scaling factor given by equation 1 as show in figure 5[5]
Fig. 1. Reverse-flow cyclones
A. Pressure Drop
The pressure drop in a cyclone will be due to the entry and exist losses along with friction and kinetic energy losses in the cyclone.[12]
The empirical equation given by Stairmand (1949) can be used to estimate the pressure drop:
ΔP=ρf/203 {u12 [1+2φ2 (2r1/re-1)] +2u22} (2) where,
ΔP= cyclone pressure drop, millibar, pf= gas density, kg/m3,
u1= D inlet duct velocity, m/s, u2 =D exit duct velocity, m/s,
rt= D radius of circle to which the centre line of the inlet is tangential, m,
re =D radius of exit pipe, m, φ= factor from Figure 2,
Ψ= parameter in Figure 2, given by:
Ψ=fc As/A1
Fc= friction factor, taken as 0.005 for gases,
As= surface area of cyclone exposed to the spinning fluid, m2.
A1= area of inlet duct, m2.
For design purposes this can be taken as equal to the surface area of a cylinder with the same diameter as the cyclone and length equal to the total height of the cyclone (barrel plus cone).
Radius ratio rt/re Fig. 2. Cyclone pressure drop factor
Fig. 3. Standard Cyclone dimension as per stairmand (a) high efficiency (b) high gas rate cyclone
Fig. 4(b) Performance curves for high gas rate cyclone
Fig. 5. Scaled performance curve
VI. MONITORED DATA
An effort was made to monitor the gaseous emission emitted out from the stack attached kiln by adopting standards method for monitoring and analysis. The results of monitoring are shown below:
PM concentration without control: 1250 mg/Nm3 Density of particle: 2500 kg/m3
Gas Temperature=150 C Gas flow rate: 4000m3/hour Required efficiency=90 % Particle size distribution as under
TABLEI:PARTICLE SIZE DISTRIBUTION
Particle size, µm Percentage by weight less than
50 90 40 75 30 65 20 55 10 30 05 10 02 04
VII. DESIGN OF HIGH EFFICIENCY CYCLONE BY
STAIRMAND METHOD
As 10 per cent of the particles are below 05µm the high-efficiency design will be required to give the specified
recovery.
Flow-rate =4000/3600 = 1.11 m3/s
Area of inlet duct, at 15 m/s =1.11/15 = 0.07 m2 Duct area = 0.5 Dc x 0.2 Dc=0.07
So, Dc = 0.84 m
This is clearly too large compared with the standard design diameter of 0.203 m.
Flow-rate per cyclone = 4000/8=500 m3/h=0.13m3/s Here, area if inlet ducts =0.13/15=0.00925m2
Now area of inlet duct =0.5Dc x 0.2 Dc=0.1Dc2=0.00925 Dc=0.30 meter, which is comparatively safe as it is close to standard size diameter of 0.203 meter.
Density of nitrogen base gas at 150oc
=Mol. Weight of nitrogen/mol. Weight of air xToK of air at 00C/ToK of gases
=28/22.4 x 273/ (273+150) =0.81 kg/m2
Which is negligible compared with solid particle density. Viscosity of nitrogen at 1500 C
=viscosity of standard air x 28/22.4 = 0.018x28/22.4 = 0.023 mNs/m2
From equation (1)
D2= [(DC2/DC1)3 X Q1/Q2 X ∆ρ1/∆ρ2 X µ2/µ1]1/2 Scaling factor
= [(0.30/0.203)3 x 223/500 x 2000/2500 x 0.023/0.018]1/2 =1.20
The performance calculations, using this scaling factor in the table below:
TABLEII:OVERALL COLLECTED EFFICIENCY[6] Particle
size (µm)
Percent in range
Mean particle size ÷Scaling factor
Efficiency at scaled size %
Collected (2) x (4)/100 >50 10 41 99 9.90 50-40 15 37 98 14.70 40-30 10 29 97 9.70 30-20 10 21 96 9.6 20-10 25 12 94 23.5 10-5 20 06 88 17.6 5-2 06 03 85 5.1 2-0 04 01 25 1
100 91.1
Over all collected efficiency =91.1%[6]
Hence, the above design of cyclone is safe, as the designed efficiency is more than 90%.
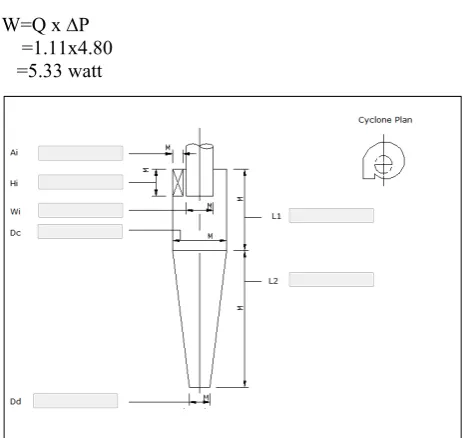
Dc=diameter of cyclone=0.30 m
Height of inlet duct=Hi=0.5 Dc=0.5x0.3=0.15m Width of inlet duct=wi=0.2 Dc =0.2x0.30=0.06 m Diameter of out let duct=D0=0.5 Dc =0.5x0.3=0.15m Diameter of dust outlet=Dd=0.375xDc =0.375x0.3=0.11m Length of cyclone main body = (1.5Dc) =1.5x0.3=L1=0.45m Length of cyclone hopper = 2.5Dc=2.5x0.3=L2=0.75m Total length of cyclone=L1+L2=1.2m
A. Pressure Drop Calculation
Area of inlet duct Ai= Hi xWi=0.15x0.06=0.009 m2 Cyclone surface area As =ΠxDcx (L1+L2) =3.14x0.30x1.35=1.272m2
Fc taken as 0.005 Ψ=fcxAs/Ai
=0.005x1.272/0.009 =0.70
Here,
r1=Dc-Wi/2 = 0.30 -0.06/2 =0.27 And re=Hi=0.15
Thus rt/re =0.27/0.15=1.8 From, fig. 2. φ=0.9
U1 = inlet duct velocity =Flow of air/inlet duct area =0.13/0.009
=14.44 m/s
Area of exit duct =ΠD02/4 =3.14x0.152/4 =0.017 m2 U2=exit velocity =0.13/0.017 =7.64 m/s
From equation 2
ΔP=ρf/203 {U12 [1+2φ2 (2r1/re-1)] +2u22}
=0.81/203[14.442[1+2x0.92 (2x0.27/0.15 – 1)] +2x7.642] =4.80 millibar
=480 N/m2
B. Power Requirement
W=Q x ∆P =1.11x4.80 =5.33 watt
Fig. 6. Proposed Cyclone Design
VIII. CONCLUSION
The designed high efficiency cyclone gives an efficiency of 91.1 % as against the desired 90 % which is safe design for controlling air pollutant concentration in the form of SPM from kiln attached to the cement plant. The monitored PM concentration is 1250 mg/Nm3 withoput control and with 91.1 % efficiency, the outlet emission after control would be 111.25 mg/m3, which is much safer as against the mandatory standards of 150 mg/m3.
ACKNOWLEDGEMENT
I am highly thankful to Prof. Dr. Akshey Bhargava, my guide, who has been Ex. Member Secretary, Rajasthan Pollution Control Board, Jaipur visiting Prof. L. D.College of Engg. and CEPT University and presently Principal, Kalol Institute of Technology and Research Centre. I am also thankful to my parents as my God, who always support me during my work
REFERENCES
[1] Silva, P. D., C. Briens., and A. Bernis. 2003. Development of a New Rapid Method to Measure Erosion Rates in Laboratory and Pilot Plant Cyclones. Powder Technology. 131: 111-119.
[2] Koch, W. H., and W. Licht. 1977. New Design Approach Boosts Cyclone Efficiency. Chem. Engineering. l7:80.
[3] Li Enliang and Wang Yingmin. 1989. A New Collection Theory of Cyclone Separators. AIChE Journal. 35:666-669.
[4] Iozia, D. L., and D. Leith. 1990. The Logistic Function and Cyclone Fractional Efficiency. Aerosol Science and Technology. 12: 598-606. [5] Kim, J. C., and K. W. Lee. 1990. Experimental Study of Particle
Collection by Small Cyclones. Aerosol Science and Technology. 12: 1003-1015.
[6] 7. Ray, M. B., A. C. Hoffmann., and R. S. Postma. 2000. Performance of Different Analytical Methods in Evaluating Grade Efficiency of Centrifugal Separators. J. Aerosol Science. 31: 563-581.
[7] 8. Altmeyer, S., V. Mathieu, S. Jullemier, P. Contal, N. Midoux, S. Rode., and J. P. Leclerc. 2004. Comparison of Different Models of Cyclone Prediction Performance for Various Operating Conditions Using General Software. Chemical Engineering and Processing. 43: 511- 522.
[8] 9. Barth, W. 1956. Design and Layout of the Cyclone Separator on the Basis of New Investigations. Brennstow- Waerme-Kraft. 8: 1-9. [9] 10. Gimbun, J., Thomas S.Y. Choong., and T. G. Chuah. 2003.
Comment on: Performance of Different Analytical Methods in Evaluating Grade Efficiency of Centrifugal Separators by Ray M.B., Hoffmann A.C.and Postma R.S. (2000): J. Aerosol Sci., 31(5), pp. 563–581. Journal of Aerosol Science. 34: 1595-1596.
[10] 11. Avci A., and Irfan Karagoz. 2003. Effects of Flow and Geometrical Parameters on the Collection Efficiency in Cyclone Separators. J. Aerosol Science. 34: 937–955.
[11] 12. Shepherd, C. B., and C. E. Lapple. 1939. Air Pollution Control: A Design Approach. In Cyclones. 2nd Edition, ed. C. David Cooper, and F. C. Alley, pp 127-139. Illinois: Woveland Press Inc.
[12] 13. Parker, R., R. Jain., and S. Calvert. 1981. Particle Collection in Cyclone at High Temperature and High Pressure. Environ. Sci. Technol., 15: 451- 458.
[13] 14. Coker, A. K. 1993. Understand Cyclone Design. Chemical Eng. Progress. pp. 51-55. JTJUN40F [04].
[14] Air Pollution Book, by M.N. Rao and H.V.N. Rao, Tata McGraw-hill Publishing Company Limited, New Delhi, Page No 160-167
[15] Handbook of Air pollution Prevention and control by Nicholas P. Cheremisinoff, P.Hd, N & P Limited
Niki Gopani, has born and brought up in Ahmedabad, Gujarat, India. Her date of birth is 18th july, 1986.
She did her B.E. (Environmental engineering) and also M.E. (Environmental management) from L.D. College of Engineering, Ahmedabad, Gujarat, India. She got university second rank during her Masters.She had also done short term training courses in Air Pollution Monitoring, Prevention and Control AND Air Quality Modelling and Prediction from CEPT University. She had also done cource on climate change from Nirma University.
She had experience in environment related consultancy (Anand Consultants) for 8 month. Then, she had a teaching experience in Kalol Institute of Technology And Research Center (KITRC) for 1 year. Currently, She is in KITRC. She had published 2 international papers. One in IJESDM and another in ICER’2011 also had done 4 national level paper presentation
Akshey Bhargava has born and brought up in Jaipur, Rajasthan, India. He had done B.E. (Civil Engineering), M.E. (Environment engineering) and P.hd (Environment) from Indian Institute of Technology, Delhi.